This site uses cookies, including third-party cookies, that help us to provide and improve our services.

Privacy Policy
- Global Locations -
Headquarters
Future Market Insights, Inc.
Christiana Corporate, 200 Continental Drive, Suite 401, Newark, Delaware - 19713, United States
T: +1-845-579-5705
MEA
Market Access DMCC

1602-6 Jumeirah Bay X2 Tower, Plot No: JLT-PH2-X2A,

Jumeirah Lakes Towers, Dubai,

United Arab Emirates

Americas
Future Market Insights
616 Corporate Way, Suite 2-9018,
Valley Cottage, NY 10989,
United States
T: +1-347-918-3531
Europe
Future Market Insights
3rd Floor, 207 Regent Street,
London W1B 3HH
United Kingdom
T: + 44 (0) 20 8123 9659
D: +44 (0) 20 3287 4268
APAC
Future Market Insights
Office No. 401-A, 4th Floor,
VANTAGE 9, S.No. 36/1/1,
Baner, Pune 411045 India

Absorption Chillers Market

Absorption Chillers uptake receiving traction amid Growing Number of Business Premises and an Increasing Demand for Cooling Them

Absorption Chillers Market by Source of Energy, Refrigerant, Packaging, Application, End Use and Regional Forecast-2022 to 2032

Absorption Chillers Market Outlook (2022-2032)

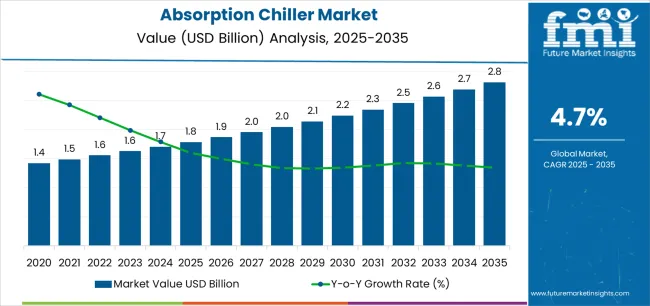
[295 Pages Report] The worldwide absorption chillers market is anticipated to be worth US$ 1,532.7 million in 2022, rising to US$ 2,376.8 million by 2032. During the projected period of 2022-2032, the market is estimated to grow at a CAGR of 4.5%.

Data Points

Key Statistics

Absorption Chillers Market Value 2022

US$ 1,532.7 million

Absorption Chillers Market Projected Value (2032)

US$ 2,376.8 million

Absorption Chillers Market CAGR (2022-2032)

4.5%

A chiller, also known as an absorption chiller, is a thermally driven refrigeration system that uses a sorbent solution or a liquid refrigerant and a heat source to deliver cooling to buildings. These absorption chillers use less energy than traditional absorption chillers such as electronic absorption chillers and industrial equipment, and they cool buildings without using ozone-depleting chlorofluorocarbons (CFCs).

Customize this Report

Let us know your requirement to get
100% FREE customization

Absorption Chillers Demand Analysis (2017 to 2021) Vs Market Outlook (2022 to 2032)

The global demand for absorption chiller projected to increase at a CAGR of 4.5% during the forecast period between 2022 and 2032, reaching a total of US$ 2,376.8 million in 2032, according to a report from Future Market Insights (FMI). From 2017 to 2021, sales witnessed significant growth, registering a CAGR of 3%.

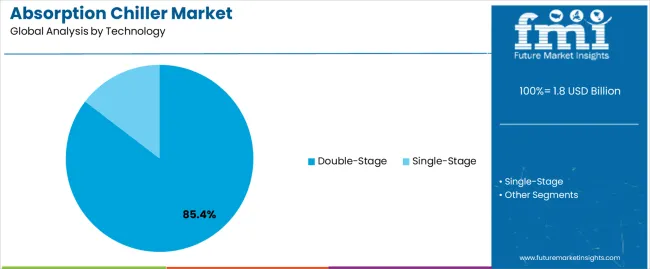
Absorption chillers use thermal energy to pump with the least amount of mechanical energy, and they can be powered by steam, hot water, natural gas, or waste water. There are two types of commercial absorption chillers: single-stage and double-stage systems. A one-stage system employs a single condenser and generator.

Because of the rising popularity of these low-cost cooling solutions, the worldwide absorption chillers market is currently developing. Various characteristics such as inaudible and vibration-free operation, as well as low maintenance and operational costs, are important market drivers for absorption chillers.

Furthermore, increased popularity in the industrial sector, notably the petrochemical industry, is expected to boost market development throughout the projection period. Furthermore, because absorption chillers are more ecologically friendly than traditional vapor compressors due to fewer pollutant and hazardous gas emissions, rigorous government regulation on the use of absorption chillers is another key driver driving market growth.

However, higher initial chiller installation costs are a fundamental constraint in the worldwide absorption chillers sector. Furthermore, rising electricity rates and power shortages are two major impediments to industry development.

Which Drivers underpin Absorption Chillers Industry Expansion?

Increasing Demand for Non-Electricity Driven Equipment to Accelerate the Market Growth

Non-electricity driven equipment is increasingly in demand from a range of end-use sectors where primary sources might be utilized more efficiently. As a result, solar-powered absorption chillers for large chilling operations have gained significant interest in the market. Such absorption chillers provide optimum cooling efficiency while minimizing electrical energy consumption, hence lessening the summer's ever-increasing demand for power. This, in turn, is expected to fuel market growth in the approaching years.

A CLFR solar collector field, for example, has been built to power a 1MW chiller that will supply air conditioning for a 500-seat showcase football stadium in Doha, Qatar, for the Football World Cup 2022.

An air conditioning device is required to ensure that turbines and engines run effectively. The ideal temperature for turbine efficiency is around 1500°C. However, maintaining this temperature becomes problematic, especially in Asia Pacific and the Middle East, where average temperatures reach 2500 degrees Celsius.

As a result, absorption chillers are commonly employed to avoid heat loss from turbines, which may then be effectively used as power absorption chillers at low fuel costs. As a result, the growing number of turbines with efficient heat rate needs is expected to drive market expansion in the near future.

Nikhil Kaitwade
Nikhil Kaitwade
Principal Consultant
LinkedIn
Talk to Analyst

Find your sweet spots for generating winning opportunities in this market.

Talk to Analyst

Which Factors are limiting the Growth of Absorption Chillers Market?

High Initial Cost of Industrial Absorption Chillers to Impede the Market Growth

Industrial absorption chillers are far more costly than standard chiller systems. When calculating the running cost of an industrial absorption chillers system, building operators should include the initial setup cost, operational cost, and energy savings. For equivalent capacity installations, industrial absorption chillers have a higher initial setup cost than commercial absorption chillers.

Furthermore, while establishing chiller systems, operators fail to consider operational expenses, resulting in the acquisition of less expensive HVAC systems. This is why small-scale firms seek cost-effective solutions with low initial setup costs. Furthermore, the long-term benefits of industrial absorption chillers are not sufficiently communicated to industries, suppressing absorption chiller demand and restricting market expansion.

Fluorinated gas (F-gas) laws are one of the most significant challenges facing the chiller industry, impacting the use of absorption chillers as evaporator coils and condensers. The European Union (EU) suggested major changes to F-gas regulations in order to reduce hydrofluorocarbons emissions (HFCs).

The use of hydrofluorocarbons (HFCs) is forbidden in a number of applications. Only if the systems in issue fulfill the Ecodesign requirements are HFC refrigerants authorized. Similar changes are taking place in the US (Significant New Alternative Policy) and China. Such stringent requirements for reducing F-gas emissions pose a substantial barrier to the growth of the absorption chillers industry.

Region-wise Insights

What is the market outlook for North American absorption chillers?

Region's Increasing Usage of Absorption Chillers for the Food Processing and Petroleum Sectors to Fuel the Market Growth

In terms of market share and revenue, the North American market is predicted to grow steadily between 2022 and 2032. Future Market Insights researchers project that by 2022, the market for absorption chillers in North America will account for 23.4% of the global market.

North America is a very profitable location for absorption chillers due to the huge increase in usage of absorption chillers for the food processing and petroleum sectors. Furthermore, the region's need for absorption chillers is growing as a result of the rising usage of environmentally friendly cooling equipment in a variety of end-use sectors such as plastics, rubber, chemicals & petrochemicals, and medical & pharmaceutical.

Because of the production of various gases during the cooling process, governments are stressing energy saving and environmental preservation. As a result, absorption chillers are increasingly being used since they release very little CO2 and other harmful pollutants. Absorption chillers' energy efficiency and higher degree of cooling with less environmental effect are expanding the market for absorption chillers.

What is propelling the growth of the Absorption Chillers in Europe?

Steady Demand from the Frozen Food Industry to Fuel the Market Growth

By 2022, Europe will control around 17.9% of the worldwide market. During the forecast period of 2022-2032, this region is predicted to steadily increase the global absorption chillers market.

The development of the European absorption chillers market is likely to be driven by steady demand from the frozen food industry. Product demand in Europe's food and beverage industry contributed for more than 21% of the region's industrial sector income, owing to customers' increased concern for eco-friendly goods.

The government's objective of reaching carbon neutrality by 2050 is also driving demand for the European absorption chillers market throughout the forecast period. Furthermore, increased demand in Southern Europe for small and medium-power chillers units is likely to drive regional product demand.

What Should the Asia Pacific Market Expect During the Projected Timeframe?

Expanding Number of Data Centres in the Region to Accelerate Market

Asia Pacific is expected to dominate the market and account for 44% of global revenue in 2022 as a result of investments in the residential and commercial building sectors. The region's expanding number of data centres is likely to drive chillers market growth during the forecast period.

The fast growth of transportation infrastructure in the Kingdom of Saudi Arabia (KSA) is projected to spur residential and commercial development in the surrounding areas, raising product demand throughout the projection period. Increased tourism, population growth, and fast urbanisation are driving the construction sector, which in turn is propelling the growth of the country's absorption chillers market.

MarketNage
Become a MarketNgage Insider

A unified Market Research Subscription Platform, built for today's disparate research needs.

Category-wise Insights

Which type of Absorption Chillers is predicted to dominate in terms of End Use?

The Commercial Absorption Chillers Segment to Drive the Absorption Chillers Market

Commercial absorption chillers are estimated to provide 44.6% of worldwide sales in 2022. Absorption chillers are used to maintain the temperature steady in commercial buildings such as corporate offices, educational institutions, public buildings, data centres, healthcare facilities, and warehouses during hot weather.

Absorption chillers are used in data centres to cool the heat generated in high-density enclosed rooms. The demand to keep data centres at a consistent temperature, humidity, air purity, and air circulation to reduce downtime and equipment failure is expected to drive commercial product adoption throughout the projection period.

The Start-Up Ecosystem: How key Players are opening Frontiers for Future Growth?

  • Critical Power Products and Services, LLC is an industrial chillers distributor. There are air-cooled, water-cooled, and liquid absorption chillers with various functionalities available. Three-phase models are available with a range of refrigerants including as R-123, R-134A, and R-22. The capacity ranges from 120 to 910 tonnes, the rated voltage ranges from 460 to 575 volts, and the frequency ranges from 60 to 60 Hz.
  • Trusteel LLC designs and manufactures automated solvent cooling systems out of stainless steel, PTFE, and borosilicate. The parameters include a rated voltage of 208/240 V, a current of 20 A, and a chilled solvent flow rate of 300 gal/h at -60 degrees C. Among the features are alarms, continuous process flow, an integrated fail safe, data logging, and remote control. Acetone, acetonitrile, ethanol, heptane, hexane, and methanol are all acceptable solvents. The FDA approved. UL approved products are manufactured in the United States.

Who are the Leading Players in the Absorption Chillers Market?

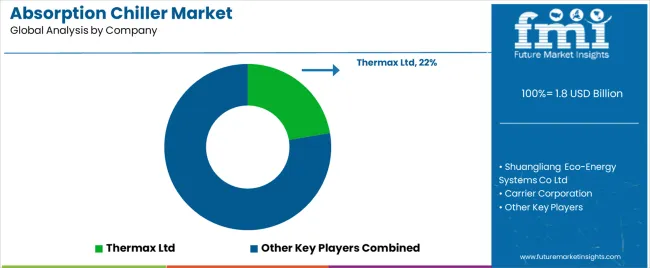
Thermax Ltd, Helioclim, MultiChill Technologies Inc, Kirloskar Pneumatic Company Ltd, World Energy Absorption, Absorption chillers Europe Ltd, Johnson Controls, Inc., LG Air Conditioning (Shandong) Co., Ltd., Hitachi Appliances Inc., EAW, Energieanlagenbau GmbH, Carrier Corporation, Century Corporation, Yazaki Energy Systems Inc. are key players in this market.

Recent Developments:

  • Johnson Controls, Inc. designs and manufactures standard and bespoke air-handling systems, rooftop systems, and sustainable environments, as well as lead acid and lithium ion batteries, building efficiency and technology solutions, and HVAC equipment such as absorption chillers. They also offer training, maintenance, leasing, and repair.
  • Carrier Corporation manufactures commercial refrigeration systems. Refrigeration systems include air-cooled condensing units, absorption chillers, air-cooled gas coolers, compressor racks, multi-rack compressors, heating systems, and heat exchangers. Their uses include cash and carry, supermarkets, hypermarkets, discount shops, persuade stores, small merchants, and distribution hubs.

Report Scope

Report Attribute

Details

Growth Rate

CAGR of 4.5% from 2022-2032

Market Value in 2022

US$ 1,532.7 million

Market Value in 2032

US$ 2,376.8 million

Base Year for Estimation

2021

Historical Data

2017-2021

Forecast Period

2022-2032

Quantitative Units

Revenue in US$ Million and CAGR from 2022-2032

Report Coverage

Revenue Forecast, Company Ranking, Competitive Landscape, Growth Factors, Trends and Pricing Analysis

Segments Covered

  • Source of Energy
  • Refrigerant
  • Packaging
  • Application
  • End Use
  • Region

Regions Covered

  • North America
  • Latin America
  • Europe
  • Asia Pacific
  • The Middle East and Africa (MEA)

Key Countries Profiled

  • U.S
  • Canada
  • Mexico
  • Brazil
  • Germany
  • Italy
  • France
  • U.K
  • Spain
  • China
  • Japan
  • South Korea
  • Malaysia
  • Singapore
  • Australia
  • New Zealand
  • GCC
  • South Africa
  • Israel

Key Companies Profiled

  • Thermax Ltd
  • Helioclim
  • MultiChill Technologies Inc.
  • Kirloskar Pneumatic Company Ltd
  • World Energy Absorption Chillers Europe Ltd
  • LG Air Conditioning (Shandong) Co. Ltd.
  • Johnson Controls, Inc.
  • Hitachi Appliances Inc.
  • EAW Energieanlagenbau GmbH
  • Carrier Corporation
  • Century Corporation
  • Yazaki Energy Systems Inc.

Key Segments Covered in the Absorption Chillers Industry Analysis

Absorption Chillers Market by Source of Energy:

  • Direct Fired Absorption Chillers
  • Steam heated Absorption Chillers
  • Hot Water Heated Absorption Chillers
  • Gaseous Fuels powered Absorption Chillers

Absorption Chillers Market by Refrigerant:

  • Ammonia Absorption Chillers
  • Lithium Bromide (Brine) Absorption Chillers

Absorption Chillers Market by Packaging:

  • Modular Absorption Chillers
  • Packaged Absorption Chillers

Absorption Chillers Market by Application:

  • Absorption Chillers for Food Storage
  • Absorption Chillers for Air Conditioning

Absorption Chillers Market By End Use:

  • Absorption Chillers for Industrial Use
  • Absorption Chillers for Commercial Use
  • Absorption Chillers for Residential Use

Absorption Chillers Market by Region:

  • North America Absorption Chillers Market
  • Latin America Absorption Chillers Market
  • Europe Absorption Chillers Market
  • Asia Pacific Absorption Chillers Market
  • Middle East & Africa Absorption Chillers Market

Frequently Asked Questions

By 2022-end, sales of absorption chillers closed at a value of US$ 1,532.7 million

From 2017 to 2021, absorption chillers demand expanded at a CAGR of 3%

From 2022 to 2032, absorption chillers sales are expected to flourish at a CAGR of 4.5%

By 2032, the market value of absorption chillers expected to reach US$ 2,376.8 million

By end user, commercial absorption chillers are expected to dominate the market in 2022.

Table of Content

1. Executive Summary

    1.1. Global Market Outlook

    1.2. Demand-side Trends

    1.3. Supply-side Trends

    1.4. Technology Roadmap Analysis

    1.5. Analysis and Recommendations

2. Market Overview

    2.1. Market Coverage / Taxonomy

    2.2. Market Definition / Scope / Limitations

3. Market Background

    3.1. Market Dynamics

        3.1.1. Drivers

        3.1.2. Restraints

        3.1.3. Opportunity

        3.1.4. Trends

    3.2. Scenario Forecast

        3.2.1. Demand in Optimistic Scenario

        3.2.2. Demand in Likely Scenario

        3.2.3. Demand in Conservative Scenario

    3.3. Opportunity Map Analysis

    3.4. Product Life Cycle Analysis

    3.5. Supply Chain Analysis

        3.5.1. Supply Side Participants and their Roles

            3.5.1.1. Producers

            3.5.1.2. Mid-Level Participants (Traders/ Agents/ Brokers)

            3.5.1.3. Wholesalers and Distributors

        3.5.2. Value Added and Value Created at Node in the Supply Chain

        3.5.3. List of Raw Material Suppliers

        3.5.4. List of Existing and Potential Buyer’s

    3.6. Investment Feasibility Matrix

    3.7. Value Chain Analysis

        3.7.1. Profit Margin Analysis

        3.7.2. Wholesalers and Distributors

        3.7.3. Retailers

    3.8. PESTLE and Porter’s Analysis

    3.9. Regulatory Landscape

        3.9.1. By Key Regions

        3.9.2. By Key Countries

    3.10. Regional Parent Market Outlook

    3.11. Production and Consumption Statistics

    3.12. Import and Export Statistics

4. Global Absorption Chillers Market Analysis 2016-2021 and Forecast, 2022-2032

    4.1. Historical Market Size Value (US$ Mn) & Volume (Unit) Analysis, 2016-2021

    4.2. Current and Future Market Size Value (US$ Mn) & Volume (Unit) Projections, 2022-2032

        4.2.1. Y-o-Y Growth Trend Analysis

        4.2.2. Absolute $ Opportunity Analysis

5. Global Absorption Chillers Market Analysis 2016-2021 and Forecast 2022-2032, By Source of Energy

    5.1. Introduction / Key Findings

    5.2. Historical Market Size Value (US$ Mn) & Volume (Unit) Analysis By Source of Energy, 2016-2021

    5.3. Current and Future Market Size Value (US$ Mn) & Volume (Unit) Analysis and Forecast By Source of Energy, 2022-2032

        5.3.1. Direct Fired

        5.3.2. Steam Heated

        5.3.3. Hot-Water Heated

        5.3.4. Gaseous Fuels

    5.4. Y-o-Y Growth Trend Analysis By Source of Energy, 2016-2021

    5.5. Absolute $ Opportunity Analysis By Source of Energy, 2022-2032

6. Global Absorption Chillers Market Analysis 2016-2021 and Forecast 2022-2032, By Refrigerant

    6.1. Introduction / Key Findings

    6.2. Historical Market Size Value (US$ Mn) & Volume (Unit) Analysis By Refrigerant, 2016-2021

    6.3. Current and Future Market Size Value (US$ Mn) & Volume (Unit) Analysis and Forecast By Refrigerant, 2022-2032

        6.3.1. Ammonia

        6.3.2. Lithium Bromide (Brine)

    6.4. Y-o-Y Growth Trend Analysis By Refrigerant, 2016-2021

    6.5. Absolute $ Opportunity Analysis By Refrigerant, 2022-2032

7. Global Absorption Chillers Market Analysis 2016-2021 and Forecast 2022-2032, By Packaging of Chillers

    7.1. Introduction / Key Findings

    7.2. Historical Market Size Value (US$ Mn) & Volume (Unit) Analysis By Packaging of Chillers, 2016-2021

    7.3. Current and Future Market Size Value (US$ Mn) & Volume (Unit) Analysis and Forecast By Packaging of Chillers, 2022-2032

        7.3.1. Modular Chillers

        7.3.2. Packaged Chillers

    7.4. Y-o-Y Growth Trend Analysis By Packaging of Chillers, 2016-2021

    7.5. Absolute $ Opportunity Analysis By Packaging of Chillers, 2022-2032

8. Global Absorption Chillers Market Analysis 2016-2021 and Forecast 2022-2032, By Applications

    8.1. Introduction / Key Findings

    8.2. Historical Market Size Value (US$ Mn) & Volume (Unit) Analysis By Applications, 2016-2021

    8.3. Current and Future Market Size Value (US$ Mn) & Volume (Unit) Analysis and Forecast By Applications, 2022-2032

        8.3.1. Food Storage

        8.3.2. Air Conditioning

    8.4. Y-o-Y Growth Trend Analysis By Applications, 2016-2021

    8.5. Absolute $ Opportunity Analysis By Applications, 2022-2032

9. Global Absorption Chillers Market Analysis 2016-2021 and Forecast 2022-2032, By End Use

    9.1. Introduction / Key Findings

    9.2. Historical Market Size Value (US$ Mn) & Volume (Unit) Analysis By End Use, 2016-2021

    9.3. Current and Future Market Size Value (US$ Mn) & Volume (Unit) Analysis and Forecast By End Use, 2022-2032

        9.3.1. Industrial

        9.3.2. Commercial

        9.3.3. Residential

    9.4. Y-o-Y Growth Trend Analysis By End Use, 2016-2021

    9.5. Absolute $ Opportunity Analysis By End Use, 2022-2032

10. Global Absorption Chillers Market Analysis 2016-2021 and Forecast 2022-2032, By Region

    10.1. Introduction

    10.2. Historical Market Size Value (US$ Mn) & Volume (Unit) Analysis By Region, 2016-2021

    10.3. Current Market Size Value (US$ Mn) & Volume (Unit) Analysis and Forecast By Region, 2022-2032

        10.3.1. North America

        10.3.2. Latin America

        10.3.3. Europe

        10.3.4. Asia Pacific

        10.3.5. MEA

    10.4. Market Attractiveness Analysis By Region

11. North America Absorption Chillers Market Analysis 2016-2021 and Forecast 2022-2032, By Country

    11.1. Historical Market Size Value (US$ Mn) & Volume (Unit) Trend Analysis By Market Taxonomy, 2016-2021

    11.2. Market Size Value (US$ Mn) & Volume (Unit) Forecast By Market Taxonomy, 2022-2032

        11.2.1. By Country

            11.2.1.1. U.S.

            11.2.1.2. Canada

        11.2.2. By Source of Energy

        11.2.3. By Refrigerant

        11.2.4. By Packaging of Chillers

        11.2.5. By Applications

        11.2.6. By End Use

    11.3. Market Attractiveness Analysis

        11.3.1. By Country

        11.3.2. By Source of Energy

        11.3.3. By Refrigerant

        11.3.4. By Packaging of Chillers

        11.3.5. By Applications

        11.3.6. By End Use

    11.4. Key Takeaways

12. Latin America Absorption Chillers Market Analysis 2016-2021 and Forecast 2022-2032, By Country

    12.1. Historical Market Size Value (US$ Mn) & Volume (Unit) Trend Analysis By Market Taxonomy, 2016-2021

    12.2. Market Size Value (US$ Mn) & Volume (Unit) Forecast By Market Taxonomy, 2022-2032

        12.2.1. By Country

            12.2.1.1. Brazil

            12.2.1.2. Mexico

            12.2.1.3. Rest of Latin America

        12.2.2. By Source of Energy

        12.2.3. By Refrigerant

        12.2.4. By Packaging of Chillers

        12.2.5. By Applications

        12.2.6. By End Use

    12.3. Market Attractiveness Analysis

        12.3.1. By Country

        12.3.2. By Source of Energy

        12.3.3. By Refrigerant

        12.3.4. By Packaging of Chillers

        12.3.5. By Applications

        12.3.6. By End Use

    12.4. Key Takeaways

13. Europe Absorption Chillers Market Analysis 2016-2021 and Forecast 2022-2032, By Country

    13.1. Historical Market Size Value (US$ Mn) & Volume (Unit) Trend Analysis By Market Taxonomy, 2016-2021

    13.2. Market Size Value (US$ Mn) & Volume (Unit) Forecast By Market Taxonomy, 2022-2032

        13.2.1. By Country

            13.2.1.1. Germany

            13.2.1.2. U.K.

            13.2.1.3. France

            13.2.1.4. Spain

            13.2.1.5. Italy

            13.2.1.6. Rest of Europe

        13.2.2. By Source of Energy

        13.2.3. By Refrigerant

        13.2.4. By Packaging of Chillers

        13.2.5. By Applications

        13.2.6. By End Use

    13.3. Market Attractiveness Analysis

        13.3.1. By Country

        13.3.2. By Source of Energy

        13.3.3. By Refrigerant

        13.3.4. By Packaging of Chillers

        13.3.5. By Applications

        13.3.6. By End Use

    13.4. Key Takeaways

14. Asia Pacific Absorption Chillers Market Analysis 2016-2021 and Forecast 2022-2032, By Country

    14.1. Historical Market Size Value (US$ Mn) & Volume (Unit) Trend Analysis By Market Taxonomy, 2016-2021

    14.2. Market Size Value (US$ Mn) & Volume (Unit) Forecast By Market Taxonomy, 2022-2032

        14.2.1. By Country

            14.2.1.1. China

            14.2.1.2. Japan

            14.2.1.3. South Korea

            14.2.1.4. Malaysia

            14.2.1.5. Singapore

            14.2.1.6. Australia

            14.2.1.7. New Zealand

            14.2.1.8. Rest of APAC

        14.2.2. By Source of Energy

        14.2.3. By Refrigerant

        14.2.4. By Packaging of Chillers

        14.2.5. By Applications

        14.2.6. By End Use

    14.3. Market Attractiveness Analysis

        14.3.1. By Country

        14.3.2. By Source of Energy

        14.3.3. By Refrigerant

        14.3.4. By Packaging of Chillers

        14.3.5. By Applications

        14.3.6. By End Use

    14.4. Key Takeaways

15. MEA Absorption Chillers Market Analysis 2016-2021 and Forecast 2022-2032, By Country

    15.1. Historical Market Size Value (US$ Mn) & Volume (Unit) Trend Analysis By Market Taxonomy, 2016-2021

    15.2. Market Size Value (US$ Mn) & Volume (Unit) Forecast By Market Taxonomy, 2022-2032

        15.2.1. By Country

            15.2.1.1. GCC Countries

            15.2.1.2. South Africa

            15.2.1.3. Israel

            15.2.1.4. Rest of MEA

        15.2.2. By Source of Energy

        15.2.3. By Refrigerant

        15.2.4. By Packaging of Chillers

        15.2.5. By Applications

        15.2.6. By End Use

    15.3. Market Attractiveness Analysis

        15.3.1. By Country

        15.3.2. By Source of Energy

        15.3.3. By Refrigerant

        15.3.4. By Packaging of Chillers

        15.3.5. By Applications

        15.3.6. By End Use

    15.4. Key Takeaways

16. Key Countries Absorption Chillers Market Analysis

    16.1. U.S.

        16.1.1. Pricing Analysis

        16.1.2. Market Share Analysis, 2021

            16.1.2.1. By Source of Energy

            16.1.2.2. By Refrigerant

            16.1.2.3. By Packaging of Chillers

            16.1.2.4. By Applications

            16.1.2.5. By End Use

    16.2. Canada

        16.2.1. Pricing Analysis

        16.2.2. Market Share Analysis, 2021

            16.2.2.1. By Source of Energy

            16.2.2.2. By Refrigerant

            16.2.2.3. By Packaging of Chillers

            16.2.2.4. By Applications

            16.2.2.5. By End Use

    16.3. Brazil

        16.3.1. Pricing Analysis

        16.3.2. Market Share Analysis, 2021

            16.3.2.1. By Source of Energy

            16.3.2.2. By Refrigerant

            16.3.2.3. By Packaging of Chillers

            16.3.2.4. By Applications

            16.3.2.5. By End Use

    16.4. Mexico

        16.4.1. Pricing Analysis

        16.4.2. Market Share Analysis, 2021

            16.4.2.1. By Source of Energy

            16.4.2.2. By Refrigerant

            16.4.2.3. By Packaging of Chillers

            16.4.2.4. By Applications

            16.4.2.5. By End Use

    16.5. Germany

        16.5.1. Pricing Analysis

        16.5.2. Market Share Analysis, 2021

            16.5.2.1. By Source of Energy

            16.5.2.2. By Refrigerant

            16.5.2.3. By Packaging of Chillers

            16.5.2.4. By Applications

            16.5.2.5. By End Use

    16.6. U.K.

        16.6.1. Pricing Analysis

        16.6.2. Market Share Analysis, 2021

            16.6.2.1. By Source of Energy

            16.6.2.2. By Refrigerant

            16.6.2.3. By Packaging of Chillers

            16.6.2.4. By Applications

            16.6.2.5. By End Use

    16.7. France

        16.7.1. Pricing Analysis

        16.7.2. Market Share Analysis, 2021

            16.7.2.1. By Source of Energy

            16.7.2.2. By Refrigerant

            16.7.2.3. By Packaging of Chillers

            16.7.2.4. By Applications

            16.7.2.5. By End Use

    16.8. Spain

        16.8.1. Pricing Analysis

        16.8.2. Market Share Analysis, 2021

            16.8.2.1. By Source of Energy

            16.8.2.2. By Refrigerant

            16.8.2.3. By Packaging of Chillers

            16.8.2.4. By Applications

            16.8.2.5. By End Use

    16.9. Italy

        16.9.1. Pricing Analysis

        16.9.2. Market Share Analysis, 2021

            16.9.2.1. By Source of Energy

            16.9.2.2. By Refrigerant

            16.9.2.3. By Packaging of Chillers

            16.9.2.4. By Applications

            16.9.2.5. By End Use

    16.10. China

        16.10.1. Pricing Analysis

        16.10.2. Market Share Analysis, 2021

            16.10.2.1. By Source of Energy

            16.10.2.2. By Refrigerant

            16.10.2.3. By Packaging of Chillers

            16.10.2.4. By Applications

            16.10.2.5. By End Use

    16.11. Japan

        16.11.1. Pricing Analysis

        16.11.2. Market Share Analysis, 2021

            16.11.2.1. By Source of Energy

            16.11.2.2. By Refrigerant

            16.11.2.3. By Packaging of Chillers

            16.11.2.4. By Applications

            16.11.2.5. By End Use

    16.12. South Korea

        16.12.1. Pricing Analysis

        16.12.2. Market Share Analysis, 2021

            16.12.2.1. By Source of Energy

            16.12.2.2. By Refrigerant

            16.12.2.3. By Packaging of Chillers

            16.12.2.4. By Applications

            16.12.2.5. By End Use

    16.13. Malaysia

        16.13.1. Pricing Analysis

        16.13.2. Market Share Analysis, 2021

            16.13.2.1. By Source of Energy

            16.13.2.2. By Refrigerant

            16.13.2.3. By Packaging of Chillers

            16.13.2.4. By Applications

            16.13.2.5. By End Use

    16.14. Singapore

        16.14.1. Pricing Analysis

        16.14.2. Market Share Analysis, 2021

            16.14.2.1. By Source of Energy

            16.14.2.2. By Refrigerant

            16.14.2.3. By Packaging of Chillers

            16.14.2.4. By Applications

            16.14.2.5. By End Use

    16.15. Australia

        16.15.1. Pricing Analysis

        16.15.2. Market Share Analysis, 2021

            16.15.2.1. By Source of Energy

            16.15.2.2. By Refrigerant

            16.15.2.3. By Packaging of Chillers

            16.15.2.4. By Applications

            16.15.2.5. By End Use

    16.16. New Zealand

        16.16.1. Pricing Analysis

        16.16.2. Market Share Analysis, 2021

            16.16.2.1. By Source of Energy

            16.16.2.2. By Refrigerant

            16.16.2.3. By Packaging of Chillers

            16.16.2.4. By Applications

            16.16.2.5. By End Use

    16.17. GCC Countries

        16.17.1. Pricing Analysis

        16.17.2. Market Share Analysis, 2021

            16.17.2.1. By Source of Energy

            16.17.2.2. By Refrigerant

            16.17.2.3. By Packaging of Chillers

            16.17.2.4. By Applications

            16.17.2.5. By End Use

    16.18. South Africa

        16.18.1. Pricing Analysis

        16.18.2. Market Share Analysis, 2021

            16.18.2.1. By Source of Energy

            16.18.2.2. By Refrigerant

            16.18.2.3. By Packaging of Chillers

            16.18.2.4. By Applications

            16.18.2.5. By End Use

    16.19. Israel

        16.19.1. Pricing Analysis

        16.19.2. Market Share Analysis, 2021

            16.19.2.1. By Source of Energy

            16.19.2.2. By Refrigerant

            16.19.2.3. By Packaging of Chillers

            16.19.2.4. By Applications

            16.19.2.5. By End Use

17. Market Structure Analysis

    17.1. Competition Dashboard

    17.2. Competition Benchmarking

    17.3. Market Share Analysis of Top Players

        17.3.1. By Regional

        17.3.2. By Source of Energy

        17.3.3. By Refrigerant

        17.3.4. By Packaging of Chillers

        17.3.5. By Applications

        17.3.6. By End Use

18. Competition Analysis

    18.1. Competition Deep Dive

        18.1.1. Thermax Ltd

            18.1.1.1. Overview

            18.1.1.2. Product Portfolio

            18.1.1.3. Profitability by Market Segments

            18.1.1.4. Sales Footprint

            18.1.1.5. Strategy Overview

                18.1.1.5.1. Marketing Strategy

                18.1.1.5.2. Product Strategy

                18.1.1.5.3. Channel Strategy

        18.1.2. Helioclim

            18.1.2.1. Overview

            18.1.2.2. Product Portfolio

            18.1.2.3. Profitability by Market Segments

            18.1.2.4. Sales Footprint

            18.1.2.5. Strategy Overview

                18.1.2.5.1. Marketing Strategy

                18.1.2.5.2. Product Strategy

                18.1.2.5.3. Channel Strategy

        18.1.3. MultiChill Technologies Inc.

            18.1.3.1. Overview

            18.1.3.2. Product Portfolio

            18.1.3.3. Profitability by Market Segments

            18.1.3.4. Sales Footprint

            18.1.3.5. Strategy Overview

                18.1.3.5.1. Marketing Strategy

                18.1.3.5.2. Product Strategy

                18.1.3.5.3. Channel Strategy

        18.1.4. Kirloskar Pneumatic Company Ltd

            18.1.4.1. Overview

            18.1.4.2. Product Portfolio

            18.1.4.3. Profitability by Market Segments

            18.1.4.4. Sales Footprint

            18.1.4.5. Strategy Overview

                18.1.4.5.1. Marketing Strategy

                18.1.4.5.2. Product Strategy

                18.1.4.5.3. Channel Strategy

        18.1.5. World Energy Absorption Chillers Europe Ltd

            18.1.5.1. Overview

            18.1.5.2. Product Portfolio

            18.1.5.3. Profitability by Market Segments

            18.1.5.4. Sales Footprint

            18.1.5.5. Strategy Overview

                18.1.5.5.1. Marketing Strategy

                18.1.5.5.2. Product Strategy

                18.1.5.5.3. Channel Strategy

        18.1.6. LG Air Conditioning (Shandong) Co., Ltd.

            18.1.6.1. Overview

            18.1.6.2. Product Portfolio

            18.1.6.3. Profitability by Market Segments

            18.1.6.4. Sales Footprint

            18.1.6.5. Strategy Overview

                18.1.6.5.1. Marketing Strategy

                18.1.6.5.2. Product Strategy

                18.1.6.5.3. Channel Strategy

        18.1.7. Hitachi Appliances Inc.

            18.1.7.1. Overview

            18.1.7.2. Product Portfolio

            18.1.7.3. Profitability by Market Segments

            18.1.7.4. Sales Footprint

            18.1.7.5. Strategy Overview

                18.1.7.5.1. Marketing Strategy

                18.1.7.5.2. Product Strategy

                18.1.7.5.3. Channel Strategy

        18.1.8. EAW Energieanlagenbau GmbH

            18.1.8.1. Overview

            18.1.8.2. Product Portfolio

            18.1.8.3. Profitability by Market Segments

            18.1.8.4. Sales Footprint

            18.1.8.5. Strategy Overview

                18.1.8.5.1. Marketing Strategy

                18.1.8.5.2. Product Strategy

                18.1.8.5.3. Channel Strategy

        18.1.9. Carrier Corporation

            18.1.9.1. Overview

            18.1.9.2. Product Portfolio

            18.1.9.3. Profitability by Market Segments

            18.1.9.4. Sales Footprint

            18.1.9.5. Strategy Overview

                18.1.9.5.1. Marketing Strategy

                18.1.9.5.2. Product Strategy

                18.1.9.5.3. Channel Strategy

        18.1.10. Century Corporation

            18.1.10.1. Overview

            18.1.10.2. Product Portfolio

            18.1.10.3. Profitability by Market Segments

            18.1.10.4. Sales Footprint

            18.1.10.5. Strategy Overview

                18.1.10.5.1. Marketing Strategy

                18.1.10.5.2. Product Strategy

                18.1.10.5.3. Channel Strategy

        18.1.11. Yazaki Energy Systems Inc.

            18.1.11.1. Overview

            18.1.11.2. Product Portfolio

            18.1.11.3. Profitability by Market Segments

            18.1.11.4. Sales Footprint

            18.1.11.5. Strategy Overview

                18.1.11.5.1. Marketing Strategy

                18.1.11.5.2. Product Strategy

                18.1.11.5.3. Channel Strategy

19. Assumptions & Acronyms Used

20. Research Methodology
Customize this Report

Let us know your requirement to get
100% FREE customization

List of Tables

Table 1: Global Absorption Chillers Market Value (US$ Mn) Forecast by Region, 2016-2032

Table 2: Global Absorption Chillers Market Volume (Unit) Forecast by Region, 2016-2032

Table 3: Global Absorption Chillers Market Value (US$ Mn) Forecast by Source of Energy, 2016-2032

Table 4: Global Absorption Chillers Market Volume (Unit) Forecast by Source of Energy, 2016-2032

Table 5: Global Absorption Chillers Market Value (US$ Mn) Forecast by Refrigerant, 2016-2032

Table 6: Global Absorption Chillers Market Volume (Unit) Forecast by Refrigerant, 2016-2032

Table 7: Global Absorption Chillers Market Value (US$ Mn) Forecast by Packaging of Chillers, 2016-2032

Table 8: Global Absorption Chillers Market Volume (Unit) Forecast by Packaging of Chillers, 2016-2032

Table 9: Global Absorption Chillers Market Value (US$ Mn) Forecast by Applications, 2016-2032

Table 10: Global Absorption Chillers Market Volume (Unit) Forecast by Applications, 2016-2032

Table 11: Global Absorption Chillers Market Value (US$ Mn) Forecast by End Use, 2016-2032

Table 12: Global Absorption Chillers Market Volume (Unit) Forecast by End Use, 2016-2032

Table 13: North America Absorption Chillers Market Value (US$ Mn) Forecast by Country, 2016-2032

Table 14: North America Absorption Chillers Market Volume (Unit) Forecast by Country, 2016-2032

Table 15: North America Absorption Chillers Market Value (US$ Mn) Forecast by Source of Energy, 2016-2032

Table 16: North America Absorption Chillers Market Volume (Unit) Forecast by Source of Energy, 2016-2032

Table 17: North America Absorption Chillers Market Value (US$ Mn) Forecast by Refrigerant, 2016-2032

Table 18: North America Absorption Chillers Market Volume (Unit) Forecast by Refrigerant, 2016-2032

Table 19: North America Absorption Chillers Market Value (US$ Mn) Forecast by Packaging of Chillers, 2016-2032

Table 20: North America Absorption Chillers Market Volume (Unit) Forecast by Packaging of Chillers, 2016-2032

Table 21: North America Absorption Chillers Market Value (US$ Mn) Forecast by Applications, 2016-2032

Table 22: North America Absorption Chillers Market Volume (Unit) Forecast by Applications, 2016-2032

Table 23: North America Absorption Chillers Market Value (US$ Mn) Forecast by End Use, 2016-2032

Table 24: North America Absorption Chillers Market Volume (Unit) Forecast by End Use, 2016-2032

Table 25: Latin America Absorption Chillers Market Value (US$ Mn) Forecast by Country, 2016-2032

Table 26: Latin America Absorption Chillers Market Volume (Unit) Forecast by Country, 2016-2032

Table 27: Latin America Absorption Chillers Market Value (US$ Mn) Forecast by Source of Energy, 2016-2032

Table 28: Latin America Absorption Chillers Market Volume (Unit) Forecast by Source of Energy, 2016-2032

Table 29: Latin America Absorption Chillers Market Value (US$ Mn) Forecast by Refrigerant, 2016-2032

Table 30: Latin America Absorption Chillers Market Volume (Unit) Forecast by Refrigerant, 2016-2032

Table 31: Latin America Absorption Chillers Market Value (US$ Mn) Forecast by Packaging of Chillers, 2016-2032

Table 32: Latin America Absorption Chillers Market Volume (Unit) Forecast by Packaging of Chillers, 2016-2032

Table 33: Latin America Absorption Chillers Market Value (US$ Mn) Forecast by Applications, 2016-2032

Table 34: Latin America Absorption Chillers Market Volume (Unit) Forecast by Applications, 2016-2032

Table 35: Latin America Absorption Chillers Market Value (US$ Mn) Forecast by End Use, 2016-2032

Table 36: Latin America Absorption Chillers Market Volume (Unit) Forecast by End Use, 2016-2032

Table 37: Europe Absorption Chillers Market Value (US$ Mn) Forecast by Country, 2016-2032

Table 38: Europe Absorption Chillers Market Volume (Unit) Forecast by Country, 2016-2032

Table 39: Europe Absorption Chillers Market Value (US$ Mn) Forecast by Source of Energy, 2016-2032

Table 40: Europe Absorption Chillers Market Volume (Unit) Forecast by Source of Energy, 2016-2032

Table 41: Europe Absorption Chillers Market Value (US$ Mn) Forecast by Refrigerant, 2016-2032

Table 42: Europe Absorption Chillers Market Volume (Unit) Forecast by Refrigerant, 2016-2032

Table 43: Europe Absorption Chillers Market Value (US$ Mn) Forecast by Packaging of Chillers, 2016-2032

Table 44: Europe Absorption Chillers Market Volume (Unit) Forecast by Packaging of Chillers, 2016-2032

Table 45: Europe Absorption Chillers Market Value (US$ Mn) Forecast by Applications, 2016-2032

Table 46: Europe Absorption Chillers Market Volume (Unit) Forecast by Applications, 2016-2032

Table 47: Europe Absorption Chillers Market Value (US$ Mn) Forecast by End Use, 2016-2032

Table 48: Europe Absorption Chillers Market Volume (Unit) Forecast by End Use, 2016-2032

Table 49: Asia Pacific Absorption Chillers Market Value (US$ Mn) Forecast by Country, 2016-2032

Table 50: Asia Pacific Absorption Chillers Market Volume (Unit) Forecast by Country, 2016-2032

Table 51: Asia Pacific Absorption Chillers Market Value (US$ Mn) Forecast by Source of Energy, 2016-2032

Table 52: Asia Pacific Absorption Chillers Market Volume (Unit) Forecast by Source of Energy, 2016-2032

Table 53: Asia Pacific Absorption Chillers Market Value (US$ Mn) Forecast by Refrigerant, 2016-2032

Table 54: Asia Pacific Absorption Chillers Market Volume (Unit) Forecast by Refrigerant, 2016-2032

Table 55: Asia Pacific Absorption Chillers Market Value (US$ Mn) Forecast by Packaging of Chillers, 2016-2032

Table 56: Asia Pacific Absorption Chillers Market Volume (Unit) Forecast by Packaging of Chillers, 2016-2032

Table 57: Asia Pacific Absorption Chillers Market Value (US$ Mn) Forecast by Applications, 2016-2032

Table 58: Asia Pacific Absorption Chillers Market Volume (Unit) Forecast by Applications, 2016-2032

Table 59: Asia Pacific Absorption Chillers Market Value (US$ Mn) Forecast by End Use, 2016-2032

Table 60: Asia Pacific Absorption Chillers Market Volume (Unit) Forecast by End Use, 2016-2032

Table 61: MEA Absorption Chillers Market Value (US$ Mn) Forecast by Country, 2016-2032

Table 62: MEA Absorption Chillers Market Volume (Unit) Forecast by Country, 2016-2032

Table 63: MEA Absorption Chillers Market Value (US$ Mn) Forecast by Source of Energy, 2016-2032

Table 64: MEA Absorption Chillers Market Volume (Unit) Forecast by Source of Energy, 2016-2032

Table 65: MEA Absorption Chillers Market Value (US$ Mn) Forecast by Refrigerant, 2016-2032

Table 66: MEA Absorption Chillers Market Volume (Unit) Forecast by Refrigerant, 2016-2032

Table 67: MEA Absorption Chillers Market Value (US$ Mn) Forecast by Packaging of Chillers, 2016-2032

Table 68: MEA Absorption Chillers Market Volume (Unit) Forecast by Packaging of Chillers, 2016-2032

Table 69: MEA Absorption Chillers Market Value (US$ Mn) Forecast by Applications, 2016-2032

Table 70: MEA Absorption Chillers Market Volume (Unit) Forecast by Applications, 2016-2032

Table 71: MEA Absorption Chillers Market Value (US$ Mn) Forecast by End Use, 2016-2032

Table 72: MEA Absorption Chillers Market Volume (Unit) Forecast by End Use, 2016-2032
Nikhil Kaitwade
Principal Consultant
LinkedIn
Talk to Analyst

Find your sweet spots for generating winning opportunities in this market.

Talk to Analyst

List of Charts

Figure 1: Global Absorption Chillers Market Value (US$ Mn) by Source of Energy, 2022-2032

Figure 2: Global Absorption Chillers Market Value (US$ Mn) by Refrigerant, 2022-2032

Figure 3: Global Absorption Chillers Market Value (US$ Mn) by Packaging of Chillers, 2022-2032

Figure 4: Global Absorption Chillers Market Value (US$ Mn) by Applications, 2022-2032

Figure 5: Global Absorption Chillers Market Value (US$ Mn) by End Use, 2022-2032

Figure 6: Global Absorption Chillers Market Value (US$ Mn) by Region, 2022-2032

Figure 7: Global Absorption Chillers Market Value (US$ Mn) Analysis by Region, 2016-2032

Figure 8: Global Absorption Chillers Market Volume (Unit) Analysis by Region, 2016-2032

Figure 9: Global Absorption Chillers Market Value Share (%) and BPS Analysis by Region, 2022-2032

Figure 10: Global Absorption Chillers Market Y-o-Y Growth (%) Projections by Region, 2022-2032

Figure 11: Global Absorption Chillers Market Value (US$ Mn) Analysis by Source of Energy, 2016-2032

Figure 12: Global Absorption Chillers Market Volume (Unit) Analysis by Source of Energy, 2016-2032

Figure 13: Global Absorption Chillers Market Value Share (%) and BPS Analysis by Source of Energy, 2022-2032

Figure 14: Global Absorption Chillers Market Y-o-Y Growth (%) Projections by Source of Energy, 2022-2032

Figure 15: Global Absorption Chillers Market Value (US$ Mn) Analysis by Refrigerant, 2016-2032

Figure 16: Global Absorption Chillers Market Volume (Unit) Analysis by Refrigerant, 2016-2032

Figure 17: Global Absorption Chillers Market Value Share (%) and BPS Analysis by Refrigerant, 2022-2032

Figure 18: Global Absorption Chillers Market Y-o-Y Growth (%) Projections by Refrigerant, 2022-2032

Figure 19: Global Absorption Chillers Market Value (US$ Mn) Analysis by Packaging of Chillers, 2016-2032

Figure 20: Global Absorption Chillers Market Volume (Unit) Analysis by Packaging of Chillers, 2016-2032

Figure 21: Global Absorption Chillers Market Value Share (%) and BPS Analysis by Packaging of Chillers, 2022-2032

Figure 22: Global Absorption Chillers Market Y-o-Y Growth (%) Projections by Packaging of Chillers, 2022-2032

Figure 23: Global Absorption Chillers Market Value (US$ Mn) Analysis by Applications, 2016-2032

Figure 24: Global Absorption Chillers Market Volume (Unit) Analysis by Applications, 2016-2032

Figure 25: Global Absorption Chillers Market Value Share (%) and BPS Analysis by Applications, 2022-2032

Figure 26: Global Absorption Chillers Market Y-o-Y Growth (%) Projections by Applications, 2022-2032

Figure 27: Global Absorption Chillers Market Value (US$ Mn) Analysis by End Use, 2016-2032

Figure 28: Global Absorption Chillers Market Volume (Unit) Analysis by End Use, 2016-2032

Figure 29: Global Absorption Chillers Market Value Share (%) and BPS Analysis by End Use, 2022-2032

Figure 30: Global Absorption Chillers Market Y-o-Y Growth (%) Projections by End Use, 2022-2032

Figure 31: Global Absorption Chillers Market Attractiveness by Source of Energy, 2022-2032

Figure 32: Global Absorption Chillers Market Attractiveness by Refrigerant, 2022-2032

Figure 33: Global Absorption Chillers Market Attractiveness by Packaging of Chillers, 2022-2032

Figure 34: Global Absorption Chillers Market Attractiveness by Applications, 2022-2032

Figure 35: Global Absorption Chillers Market Attractiveness by End Use, 2022-2032

Figure 36: Global Absorption Chillers Market Attractiveness by Region, 2022-2032

Figure 37: North America Absorption Chillers Market Value (US$ Mn) by Source of Energy, 2022-2032

Figure 38: North America Absorption Chillers Market Value (US$ Mn) by Refrigerant, 2022-2032

Figure 39: North America Absorption Chillers Market Value (US$ Mn) by Packaging of Chillers, 2022-2032

Figure 40: North America Absorption Chillers Market Value (US$ Mn) by Applications, 2022-2032

Figure 41: North America Absorption Chillers Market Value (US$ Mn) by End Use, 2022-2032

Figure 42: North America Absorption Chillers Market Value (US$ Mn) by Country, 2022-2032

Figure 43: North America Absorption Chillers Market Value (US$ Mn) Analysis by Country, 2016-2032

Figure 44: North America Absorption Chillers Market Volume (Unit) Analysis by Country, 2016-2032

Figure 45: North America Absorption Chillers Market Value Share (%) and BPS Analysis by Country, 2022-2032

Figure 46: North America Absorption Chillers Market Y-o-Y Growth (%) Projections by Country, 2022-2032

Figure 47: North America Absorption Chillers Market Value (US$ Mn) Analysis by Source of Energy, 2016-2032

Figure 48: North America Absorption Chillers Market Volume (Unit) Analysis by Source of Energy, 2016-2032

Figure 49: North America Absorption Chillers Market Value Share (%) and BPS Analysis by Source of Energy, 2022-2032

Figure 50: North America Absorption Chillers Market Y-o-Y Growth (%) Projections by Source of Energy, 2022-2032

Figure 51: North America Absorption Chillers Market Value (US$ Mn) Analysis by Refrigerant, 2016-2032

Figure 52: North America Absorption Chillers Market Volume (Unit) Analysis by Refrigerant, 2016-2032

Figure 53: North America Absorption Chillers Market Value Share (%) and BPS Analysis by Refrigerant, 2022-2032

Figure 54: North America Absorption Chillers Market Y-o-Y Growth (%) Projections by Refrigerant, 2022-2032

Figure 55: North America Absorption Chillers Market Value (US$ Mn) Analysis by Packaging of Chillers, 2016-2032

Figure 56: North America Absorption Chillers Market Volume (Unit) Analysis by Packaging of Chillers, 2016-2032

Figure 57: North America Absorption Chillers Market Value Share (%) and BPS Analysis by Packaging of Chillers, 2022-2032

Figure 58: North America Absorption Chillers Market Y-o-Y Growth (%) Projections by Packaging of Chillers, 2022-2032

Figure 59: North America Absorption Chillers Market Value (US$ Mn) Analysis by Applications, 2016-2032

Figure 60: North America Absorption Chillers Market Volume (Unit) Analysis by Applications, 2016-2032

Figure 61: North America Absorption Chillers Market Value Share (%) and BPS Analysis by Applications, 2022-2032

Figure 62: North America Absorption Chillers Market Y-o-Y Growth (%) Projections by Applications, 2022-2032

Figure 63: North America Absorption Chillers Market Value (US$ Mn) Analysis by End Use, 2016-2032

Figure 64: North America Absorption Chillers Market Volume (Unit) Analysis by End Use, 2016-2032

Figure 65: North America Absorption Chillers Market Value Share (%) and BPS Analysis by End Use, 2022-2032

Figure 66: North America Absorption Chillers Market Y-o-Y Growth (%) Projections by End Use, 2022-2032

Figure 67: North America Absorption Chillers Market Attractiveness by Source of Energy, 2022-2032

Figure 68: North America Absorption Chillers Market Attractiveness by Refrigerant, 2022-2032

Figure 69: North America Absorption Chillers Market Attractiveness by Packaging of Chillers, 2022-2032

Figure 70: North America Absorption Chillers Market Attractiveness by Applications, 2022-2032

Figure 71: North America Absorption Chillers Market Attractiveness by End Use, 2022-2032

Figure 72: North America Absorption Chillers Market Attractiveness by Country, 2022-2032

Figure 73: Latin America Absorption Chillers Market Value (US$ Mn) by Source of Energy, 2022-2032

Figure 74: Latin America Absorption Chillers Market Value (US$ Mn) by Refrigerant, 2022-2032

Figure 75: Latin America Absorption Chillers Market Value (US$ Mn) by Packaging of Chillers, 2022-2032

Figure 76: Latin America Absorption Chillers Market Value (US$ Mn) by Applications, 2022-2032

Figure 77: Latin America Absorption Chillers Market Value (US$ Mn) by End Use, 2022-2032

Figure 78: Latin America Absorption Chillers Market Value (US$ Mn) by Country, 2022-2032

Figure 79: Latin America Absorption Chillers Market Value (US$ Mn) Analysis by Country, 2016-2032

Figure 80: Latin America Absorption Chillers Market Volume (Unit) Analysis by Country, 2016-2032

Figure 81: Latin America Absorption Chillers Market Value Share (%) and BPS Analysis by Country, 2022-2032

Figure 82: Latin America Absorption Chillers Market Y-o-Y Growth (%) Projections by Country, 2022-2032

Figure 83: Latin America Absorption Chillers Market Value (US$ Mn) Analysis by Source of Energy, 2016-2032

Figure 84: Latin America Absorption Chillers Market Volume (Unit) Analysis by Source of Energy, 2016-2032

Figure 85: Latin America Absorption Chillers Market Value Share (%) and BPS Analysis by Source of Energy, 2022-2032

Figure 86: Latin America Absorption Chillers Market Y-o-Y Growth (%) Projections by Source of Energy, 2022-2032

Figure 87: Latin America Absorption Chillers Market Value (US$ Mn) Analysis by Refrigerant, 2016-2032

Figure 88: Latin America Absorption Chillers Market Volume (Unit) Analysis by Refrigerant, 2016-2032

Figure 89: Latin America Absorption Chillers Market Value Share (%) and BPS Analysis by Refrigerant, 2022-2032

Figure 90: Latin America Absorption Chillers Market Y-o-Y Growth (%) Projections by Refrigerant, 2022-2032

Figure 91: Latin America Absorption Chillers Market Value (US$ Mn) Analysis by Packaging of Chillers, 2016-2032

Figure 92: Latin America Absorption Chillers Market Volume (Unit) Analysis by Packaging of Chillers, 2016-2032

Figure 93: Latin America Absorption Chillers Market Value Share (%) and BPS Analysis by Packaging of Chillers, 2022-2032

Figure 94: Latin America Absorption Chillers Market Y-o-Y Growth (%) Projections by Packaging of Chillers, 2022-2032

Figure 95: Latin America Absorption Chillers Market Value (US$ Mn) Analysis by Applications, 2016-2032

Figure 96: Latin America Absorption Chillers Market Volume (Unit) Analysis by Applications, 2016-2032

Figure 97: Latin America Absorption Chillers Market Value Share (%) and BPS Analysis by Applications, 2022-2032

Figure 98: Latin America Absorption Chillers Market Y-o-Y Growth (%) Projections by Applications, 2022-2032

Figure 99: Latin America Absorption Chillers Market Value (US$ Mn) Analysis by End Use, 2016-2032

Figure 100: Latin America Absorption Chillers Market Volume (Unit) Analysis by End Use, 2016-2032

Figure 101: Latin America Absorption Chillers Market Value Share (%) and BPS Analysis by End Use, 2022-2032

Figure 102: Latin America Absorption Chillers Market Y-o-Y Growth (%) Projections by End Use, 2022-2032

Figure 103: Latin America Absorption Chillers Market Attractiveness by Source of Energy, 2022-2032

Figure 104: Latin America Absorption Chillers Market Attractiveness by Refrigerant, 2022-2032

Figure 105: Latin America Absorption Chillers Market Attractiveness by Packaging of Chillers, 2022-2032

Figure 106: Latin America Absorption Chillers Market Attractiveness by Applications, 2022-2032

Figure 107: Latin America Absorption Chillers Market Attractiveness by End Use, 2022-2032

Figure 108: Latin America Absorption Chillers Market Attractiveness by Country, 2022-2032

Figure 109: Europe Absorption Chillers Market Value (US$ Mn) by Source of Energy, 2022-2032

Figure 110: Europe Absorption Chillers Market Value (US$ Mn) by Refrigerant, 2022-2032

Figure 111: Europe Absorption Chillers Market Value (US$ Mn) by Packaging of Chillers, 2022-2032

Figure 112: Europe Absorption Chillers Market Value (US$ Mn) by Applications, 2022-2032

Figure 113: Europe Absorption Chillers Market Value (US$ Mn) by End Use, 2022-2032

Figure 114: Europe Absorption Chillers Market Value (US$ Mn) by Country, 2022-2032

Figure 115: Europe Absorption Chillers Market Value (US$ Mn) Analysis by Country, 2016-2032

Figure 116: Europe Absorption Chillers Market Volume (Unit) Analysis by Country, 2016-2032

Figure 117: Europe Absorption Chillers Market Value Share (%) and BPS Analysis by Country, 2022-2032

Figure 118: Europe Absorption Chillers Market Y-o-Y Growth (%) Projections by Country, 2022-2032

Figure 119: Europe Absorption Chillers Market Value (US$ Mn) Analysis by Source of Energy, 2016-2032

Figure 120: Europe Absorption Chillers Market Volume (Unit) Analysis by Source of Energy, 2016-2032

Figure 121: Europe Absorption Chillers Market Value Share (%) and BPS Analysis by Source of Energy, 2022-2032

Figure 122: Europe Absorption Chillers Market Y-o-Y Growth (%) Projections by Source of Energy, 2022-2032

Figure 123: Europe Absorption Chillers Market Value (US$ Mn) Analysis by Refrigerant, 2016-2032

Figure 124: Europe Absorption Chillers Market Volume (Unit) Analysis by Refrigerant, 2016-2032

Figure 125: Europe Absorption Chillers Market Value Share (%) and BPS Analysis by Refrigerant, 2022-2032

Figure 126: Europe Absorption Chillers Market Y-o-Y Growth (%) Projections by Refrigerant, 2022-2032

Figure 127: Europe Absorption Chillers Market Value (US$ Mn) Analysis by Packaging of Chillers, 2016-2032

Figure 128: Europe Absorption Chillers Market Volume (Unit) Analysis by Packaging of Chillers, 2016-2032

Figure 129: Europe Absorption Chillers Market Value Share (%) and BPS Analysis by Packaging of Chillers, 2022-2032

Figure 130: Europe Absorption Chillers Market Y-o-Y Growth (%) Projections by Packaging of Chillers, 2022-2032

Figure 131: Europe Absorption Chillers Market Value (US$ Mn) Analysis by Applications, 2016-2032

Figure 132: Europe Absorption Chillers Market Volume (Unit) Analysis by Applications, 2016-2032

Figure 133: Europe Absorption Chillers Market Value Share (%) and BPS Analysis by Applications, 2022-2032

Figure 134: Europe Absorption Chillers Market Y-o-Y Growth (%) Projections by Applications, 2022-2032

Figure 135: Europe Absorption Chillers Market Value (US$ Mn) Analysis by End Use, 2016-2032

Figure 136: Europe Absorption Chillers Market Volume (Unit) Analysis by End Use, 2016-2032

Figure 137: Europe Absorption Chillers Market Value Share (%) and BPS Analysis by End Use, 2022-2032

Figure 138: Europe Absorption Chillers Market Y-o-Y Growth (%) Projections by End Use, 2022-2032

Figure 139: Europe Absorption Chillers Market Attractiveness by Source of Energy, 2022-2032

Figure 140: Europe Absorption Chillers Market Attractiveness by Refrigerant, 2022-2032

Figure 141: Europe Absorption Chillers Market Attractiveness by Packaging of Chillers, 2022-2032

Figure 142: Europe Absorption Chillers Market Attractiveness by Applications, 2022-2032

Figure 143: Europe Absorption Chillers Market Attractiveness by End Use, 2022-2032

Figure 144: Europe Absorption Chillers Market Attractiveness by Country, 2022-2032

Figure 145: Asia Pacific Absorption Chillers Market Value (US$ Mn) by Source of Energy, 2022-2032

Figure 146: Asia Pacific Absorption Chillers Market Value (US$ Mn) by Refrigerant, 2022-2032

Figure 147: Asia Pacific Absorption Chillers Market Value (US$ Mn) by Packaging of Chillers, 2022-2032

Figure 148: Asia Pacific Absorption Chillers Market Value (US$ Mn) by Applications, 2022-2032

Figure 149: Asia Pacific Absorption Chillers Market Value (US$ Mn) by End Use, 2022-2032

Figure 150: Asia Pacific Absorption Chillers Market Value (US$ Mn) by Country, 2022-2032

Figure 151: Asia Pacific Absorption Chillers Market Value (US$ Mn) Analysis by Country, 2016-2032

Figure 152: Asia Pacific Absorption Chillers Market Volume (Unit) Analysis by Country, 2016-2032

Figure 153: Asia Pacific Absorption Chillers Market Value Share (%) and BPS Analysis by Country, 2022-2032

Figure 154: Asia Pacific Absorption Chillers Market Y-o-Y Growth (%) Projections by Country, 2022-2032

Figure 155: Asia Pacific Absorption Chillers Market Value (US$ Mn) Analysis by Source of Energy, 2016-2032

Figure 156: Asia Pacific Absorption Chillers Market Volume (Unit) Analysis by Source of Energy, 2016-2032

Figure 157: Asia Pacific Absorption Chillers Market Value Share (%) and BPS Analysis by Source of Energy, 2022-2032

Figure 158: Asia Pacific Absorption Chillers Market Y-o-Y Growth (%) Projections by Source of Energy, 2022-2032

Figure 159: Asia Pacific Absorption Chillers Market Value (US$ Mn) Analysis by Refrigerant, 2016-2032

Figure 160: Asia Pacific Absorption Chillers Market Volume (Unit) Analysis by Refrigerant, 2016-2032

Figure 161: Asia Pacific Absorption Chillers Market Value Share (%) and BPS Analysis by Refrigerant, 2022-2032

Figure 162: Asia Pacific Absorption Chillers Market Y-o-Y Growth (%) Projections by Refrigerant, 2022-2032

Figure 163: Asia Pacific Absorption Chillers Market Value (US$ Mn) Analysis by Packaging of Chillers, 2016-2032

Figure 164: Asia Pacific Absorption Chillers Market Volume (Unit) Analysis by Packaging of Chillers, 2016-2032

Figure 165: Asia Pacific Absorption Chillers Market Value Share (%) and BPS Analysis by Packaging of Chillers, 2022-2032

Figure 166: Asia Pacific Absorption Chillers Market Y-o-Y Growth (%) Projections by Packaging of Chillers, 2022-2032

Figure 167: Asia Pacific Absorption Chillers Market Value (US$ Mn) Analysis by Applications, 2016-2032

Figure 168: Asia Pacific Absorption Chillers Market Volume (Unit) Analysis by Applications, 2016-2032

Figure 169: Asia Pacific Absorption Chillers Market Value Share (%) and BPS Analysis by Applications, 2022-2032

Figure 170: Asia Pacific Absorption Chillers Market Y-o-Y Growth (%) Projections by Applications, 2022-2032

Figure 171: Asia Pacific Absorption Chillers Market Value (US$ Mn) Analysis by End Use, 2016-2032

Figure 172: Asia Pacific Absorption Chillers Market Volume (Unit) Analysis by End Use, 2016-2032

Figure 173: Asia Pacific Absorption Chillers Market Value Share (%) and BPS Analysis by End Use, 2022-2032

Figure 174: Asia Pacific Absorption Chillers Market Y-o-Y Growth (%) Projections by End Use, 2022-2032

Figure 175: Asia Pacific Absorption Chillers Market Attractiveness by Source of Energy, 2022-2032

Figure 176: Asia Pacific Absorption Chillers Market Attractiveness by Refrigerant, 2022-2032

Figure 177: Asia Pacific Absorption Chillers Market Attractiveness by Packaging of Chillers, 2022-2032

Figure 178: Asia Pacific Absorption Chillers Market Attractiveness by Applications, 2022-2032

Figure 179: Asia Pacific Absorption Chillers Market Attractiveness by End Use, 2022-2032

Figure 180: Asia Pacific Absorption Chillers Market Attractiveness by Country, 2022-2032

Figure 181: MEA Absorption Chillers Market Value (US$ Mn) by Source of Energy, 2022-2032

Figure 182: MEA Absorption Chillers Market Value (US$ Mn) by Refrigerant, 2022-2032

Figure 183: MEA Absorption Chillers Market Value (US$ Mn) by Packaging of Chillers, 2022-2032

Figure 184: MEA Absorption Chillers Market Value (US$ Mn) by Applications, 2022-2032

Figure 185: MEA Absorption Chillers Market Value (US$ Mn) by End Use, 2022-2032

Figure 186: MEA Absorption Chillers Market Value (US$ Mn) by Country, 2022-2032

Figure 187: MEA Absorption Chillers Market Value (US$ Mn) Analysis by Country, 2016-2032

Figure 188: MEA Absorption Chillers Market Volume (Unit) Analysis by Country, 2016-2032

Figure 189: MEA Absorption Chillers Market Value Share (%) and BPS Analysis by Country, 2022-2032

Figure 190: MEA Absorption Chillers Market Y-o-Y Growth (%) Projections by Country, 2022-2032

Figure 191: MEA Absorption Chillers Market Value (US$ Mn) Analysis by Source of Energy, 2016-2032

Figure 192: MEA Absorption Chillers Market Volume (Unit) Analysis by Source of Energy, 2016-2032

Figure 193: MEA Absorption Chillers Market Value Share (%) and BPS Analysis by Source of Energy, 2022-2032

Figure 194: MEA Absorption Chillers Market Y-o-Y Growth (%) Projections by Source of Energy, 2022-2032

Figure 195: MEA Absorption Chillers Market Value (US$ Mn) Analysis by Refrigerant, 2016-2032

Figure 196: MEA Absorption Chillers Market Volume (Unit) Analysis by Refrigerant, 2016-2032

Figure 197: MEA Absorption Chillers Market Value Share (%) and BPS Analysis by Refrigerant, 2022-2032

Figure 198: MEA Absorption Chillers Market Y-o-Y Growth (%) Projections by Refrigerant, 2022-2032

Figure 199: MEA Absorption Chillers Market Value (US$ Mn) Analysis by Packaging of Chillers, 2016-2032

Figure 200: MEA Absorption Chillers Market Volume (Unit) Analysis by Packaging of Chillers, 2016-2032

Figure 201: MEA Absorption Chillers Market Value Share (%) and BPS Analysis by Packaging of Chillers, 2022-2032

Figure 202: MEA Absorption Chillers Market Y-o-Y Growth (%) Projections by Packaging of Chillers, 2022-2032

Figure 203: MEA Absorption Chillers Market Value (US$ Mn) Analysis by Applications, 2016-2032

Figure 204: MEA Absorption Chillers Market Volume (Unit) Analysis by Applications, 2016-2032

Figure 205: MEA Absorption Chillers Market Value Share (%) and BPS Analysis by Applications, 2022-2032

Figure 206: MEA Absorption Chillers Market Y-o-Y Growth (%) Projections by Applications, 2022-2032

Figure 207: MEA Absorption Chillers Market Value (US$ Mn) Analysis by End Use, 2016-2032

Figure 208: MEA Absorption Chillers Market Volume (Unit) Analysis by End Use, 2016-2032

Figure 209: MEA Absorption Chillers Market Value Share (%) and BPS Analysis by End Use, 2022-2032

Figure 210: MEA Absorption Chillers Market Y-o-Y Growth (%) Projections by End Use, 2022-2032

Figure 211: MEA Absorption Chillers Market Attractiveness by Source of Energy, 2022-2032

Figure 212: MEA Absorption Chillers Market Attractiveness by Refrigerant, 2022-2032

Figure 213: MEA Absorption Chillers Market Attractiveness by Packaging of Chillers, 2022-2032

Figure 214: MEA Absorption Chillers Market Attractiveness by Applications, 2022-2032

Figure 215: MEA Absorption Chillers Market Attractiveness by End Use, 2022-2032

Figure 216: MEA Absorption Chillers Market Attractiveness by Country, 2022-2032

Need specific information?

Request Customization

Explore Industrial Automation Insights

View Reports

Recommendations

Industrial Automation

Scroll Chiller Market

Published : January 2019

Testing Equipment

Atomic Absorption Spectroscopy Market

Published : January 2019

Automotive

Automotive Energy Absorption (EA) Pads Market

Published : November 2018

Industrial Automation

Atomic Absorption Spectrometer Market

Published : November 2015

Google translate

Absorption Chillers Market