Reports

- Global Locations -

Headquarters

Future Market Insights, Inc.

Christiana Corporate, 200
Continental Drive, Suite 401,
Newark, Delaware - 19713,
United States

T: +1-845-579-5705

Americas

Future Market Insights, Inc.

616 Corporate Way, Suite 2-9018,
Valley Cottage, NY 10989, United States

T: +1-347-918-3531

MEA

Future Market Insights

1602-6 Jumeirah Bay X2 Tower, Plot No: JLT-PH2-X2A,
Jumeirah Lakes Towers, Dubai,
United Arab Emirates

Europe

Future Market Insights

3rd Floor, 207 Regent Street,
W1B 3HH London
United Kingdom

T: + 44 (0) 20 8123 9659
D: +44 (0) 20 3287 4268

Asia Pacific

Future Market Insights

IndiaLand Global Tech Park, Unit UG-1, Behind Grand HighStreet, Phase 1, Hinjawadi, MH, Pune – 411057, India

Beer Glass Chillers Market Outlook (2023 to 2033)

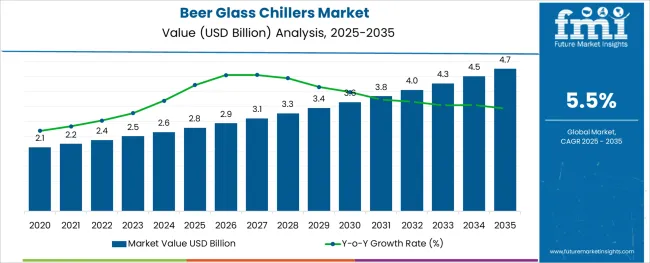
According to research by Future Market Insights, the beer glass chillers market is anticipated to register at a CAGR of 5.5% over the forecasted period. According to analysis, the market is likely to grow to a valuation of US$ 2,497.6 million by 2033, up from US$ 1,462.2 million in 2023.

Attribute Details
The market size value in 2023 US$ 1,462.2 million
Market forecast value in 2033 US$ 2,497.6 million
Forecast period 2023 to 2033
Global growth rate (CAGR) 5.5%
Share of Germany in the Beer Glass Chiller Market 22.5%

The beer glass chiller market is expected to grow significantly in the next few years. The factor is attributed to the rising popularity of craft beer and the increasing number of bars and restaurants. The enthusiasm around instant-crafted beer has made bars adopt the beer glass chiller.

The beer glass chiller companies target to penetrate different drinking styles by introducing a wide range of chiller types, such as regular ice packs, to sophisticated cooking systems. Furthermore, the chillers get segregated based on the end user's budget and applications, helping vendors to target the consumer specifically.

The new beer flavors and crafting of beer with native touch are getting popular among beer glass chillers.

Don't pay for what you don't need

Customize your report by selecting specific countries or regions and save 30%!

Historical Outlook Vs Future Forecast for Beer Glass Chillers Market

According to Future Market Insights, the beer glass chiller market thrived at a CAGR of 5.0% to reach USD 1,386.0 million in 2022 from USD 1,140.2 million in 2018, with numerous reasons at play. Traditionally, the demand for beer glass chillers rose with the growth in the number of leisure and recreational activities, especially in the developed regions. As the trend of wanderlust penetrates developing countries, assisted by the rise in disposable income, the splashes of beer glass chillers market revenue are likely to rise.

Looking to the future, it's clear that beer glass chillers are likely to continue to play an essential role in the world of beer. As understanding pertaining to the science behind brewing and chilling beer continues to grow, it can be expected that these chillers are likely to become even more advanced. Since users are always on the quest for the 'new,' manufacturers eye on the latest technology.

According to research by Future Market Insights, the beer glass chillers market is anticipated to expand at a CAGR of 5.5% over the forecasted period.

Beer Glass Chillers Market

Comparative View of Beer Glass Chillers Market     

Beer Glass Chillers Market:

Attributes Beer Glass Chillers Market
CAGR (2022 to 2032) 5.3%
Market Value (2023) US$ 1.46 billion
Growth Factor The improved lifestyle, advanced technology penetrating in the FMCG sector, and developing taste for better beer equipment have fueled the demand for beer glass chillers.
Opportunity The sophisticated and personalized chillers that offer promotive texts to the outer layer of it provide opportunities to the people.
Key Trends The new craft beer flavors have been in trend for and have pushed people to adopt the latest technology along with the electrical chillers.

Beer Market:

Attributes Beer Market
CAGR (2022 to 2032) 2.5%
Market Value (2023) US$ 705 billion
Growth Factor Beer consumption has increased with the overall alcohol consumption along with the rising number of restaurants and bars flourishing the sales of beer.
Opportunity The rising opportunity for the beer market is attributed to the fact that the rising alcohol-consuming population.
Key Trends Significant growth in the number of breweries over the past few years has shaped the trend for the growing beer market

Glass Liquor Bottles Market:

Attributes Glass Liquor Bottles Market
CAGR (2022 to 2032) 4.5%
Market Value (2023) US$ 6.3 billion
Growth Factor The rising shift in customer preference from plastics-based packaging and increasing inclination towards adopting sustainable packaging materials across the beverage industry is propelling the demand for glass bottles,
Opportunity The demand for clear glass liquor bottles is rising with rum, vodka, or other distilled liquors. The experiments with glass material bring opportunities to the market.
Key Trends The increasing awareness around new types of beers such as crafting beer, and flavored beer along with the new promotional tactics shapes the growth trend for the market.
Nandini Roy Choudhury

Principal Consultant

Talk to Analyst

Find your sweet spots for generating winning opportunities in this market.

Category wise insights

How is the Food and Beverage Industry Supporting Growth of the Beer Glass Chillers Market?

The food and beverage industry is a major segment of growth in the beer glass chillers market. The growing popularity of craft beer and the rise in consumption of chilled beverages are key factors driving the demand for beer glass chillers.

Major players in the food and beverage industry are investing heavily in the development of new and innovative products to cater to the growing demand from consumers. For instance, Molson Coors Brewing Company has launched a new line of beer glass chillers under its Miller Chill brand. The company has also partnered with leading retailers such as Walmart and Target to sell its products.

The rising disposable incomes of consumers and their changing preferences are also fuelling the growth of the beer glass chillers market. Increasing health consciousness among consumers is leading them to prefer healthier alternatives, such as craft beer, over traditional beers. This trend is expected to continue over the forecast period.

Commercial and Residential Segment Bags the Top Spot

The growing demand for beer in the Asia Pacific region is the primary driver for the growth of commercial beer glass chillers in commercial and residential segments. The rise in disposable income and changing lifestyle trends are resulting in increased consumption of beer, which is driving the demand for commercial beer glass chillers. Additionally, the growing hospitality industry in the region is also driving the demand for these products.

The North American and European regions are also expected to witness significant growth during the forecast period due to the presence of a large number of restaurateurs and suppliers in these regions.
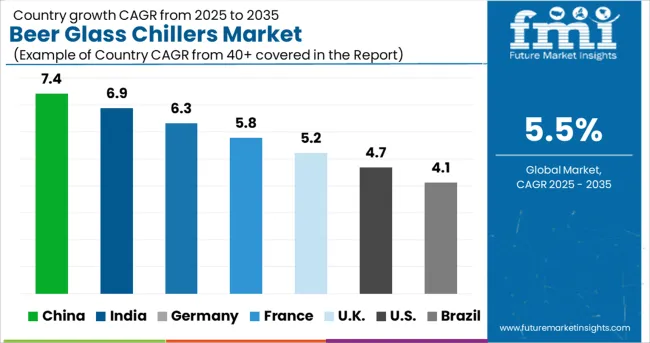
Country-Wise Analysis

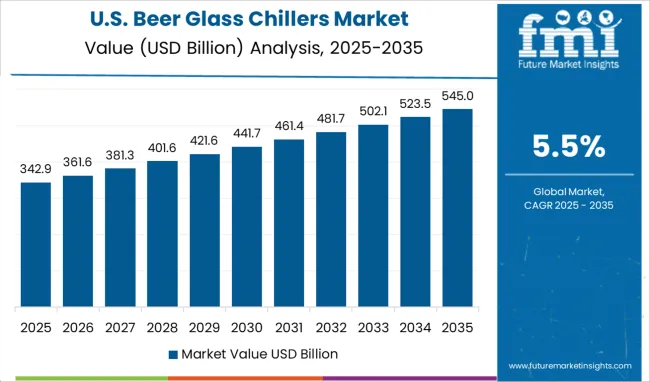
The USA Beer Glass Chillers Market Turns Innovative with Manufacturers becoming Creative with their Products

The rising number of crafted breweries in the USA along with a higher number of youngsters indulging in drinking beer is flourishing the demand for beer glass chillers.

The United States holds the biggest share in the global egg grading machines market. The USA has become the biggest region because of higher alcohol consumption, more FMCG startups, and the presence of different bar and restaurant chains that serve crafted beer at their breweries.

Other than this, the increased awareness around crafted beer and its benefits is also fueling the demand for beer glass chillers. The demand for beer glass chillers is expected to grow in North America as the craft beer industry continues to grow. Craft breweries are expected to account for more than 10% of the total USA beer market by 2033. This growth is being driven by consumers who are looking for new and interesting flavors.

Tourists Play a Key Role in Shaping Up the United Kingdom Beer Glass Chillers Market

Restoration of tourist spots in the United Kingdom region along with the presence of leading craft beer brands.

While the United Kingdom is expected to gain traction during the forecast period. The growth is attributed to the new brands entering the beer equipment markets, such as the beer glass chiller market. Furthermore, the advanced personalized and ice-specific chiller has been in trend and is likely to replace the regular conventional beer chiller. There are different spaces in the European region in which people prefer their beer to be chilled for long hours.
Lenient Government Regulations in China Govern the Market

Soften government regulations around beer drinking coupled with new craft beer mixes are fueling the demand for beer glass chillers.

China is a part of the Asia Pacific region along with being the top emerging economy puts its alcohol consumption at the top. Younger people have started drinking more during the last decade. New experiments with the beer flavor have started attracting a new consumer base in China. The increased number of bars and restaurants have started adopting beer glass chillers. People who don’t like ice prefer these chillers so that the beer can be consumed without a hitch.
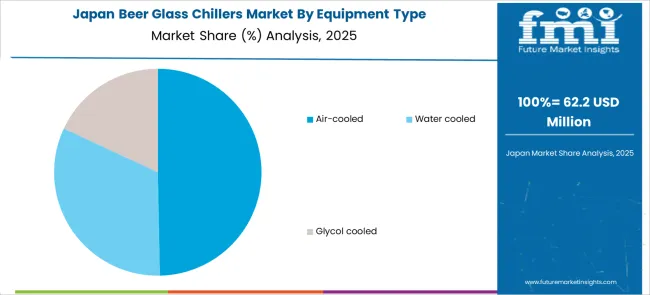
Craze towards Alcohol Grows in Japan and so do Opportunities for Manufacturers

Expanding the Japanese alcohol and beer market along with the rising economic activities in the region has led to market growth.

The new and advanced technology in the FMCG sector enhances the beverage intake experience along with higher restaurant and bar penetration. The rising demand for craft beer in the urban region with the rising awareness around different types of beers fuel the demand for beer glass chillers. The advent of advanced chillers that are efficient in nature while making beer the coldest, which is increasing their adoption among Gen Z and the millennial populace.

Korea Embraces Bar Culture

Rising preference for beer amongst Koreans fuels the growth while stringent policies slow down the market’s growth rate.

Flourishing demand for craft beer in the coastal region of South Korea along with rising craft beer startups has led to the rising demand for beer-related equipment such as glasses, snacks, and chillers. Along with these, the higher number of bars in the region have consumed the most from the global beer glasses chiller market.   `
Competitive landscape        

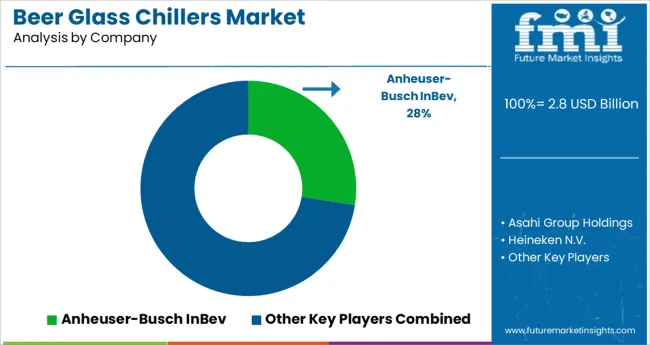
The increasing demand for beer and the changing consumer preferences are the major factors driving the growth of the beer glass chillers market. The growing trend of microbreweries and home brewing is also fueling the market growth. Companies try to produce enhanced electric glass chillers with advanced integrated technology. The efficient cooling is the factor all the major players play their cards on.

The leading players in the beer glass chillers market

  • Asahi Group Holdings
  • Heineken N.V.
  • Anheuser-Busch InBev
  • Carlsberg Group
  • Molson Coors Brewing Company
  • Diageo Plc.

Get the data you need at a Fraction of the cost

Personalize your report by choosing insights you need
and save 40%!

Beer Chillers market Report scope

Attribute Details
Forecast Period 2023 to 2033
Historical Data Available for 2018 to 2022
Market Analysis USD million in value
Key Regions Covered
  • North America
  • Eastern Europe
  • Western Europe
  • Japan
  • South America
  • Asian Pacific
  • Middle east and Africa
Key Countries Covered
  • USA
  • Germany
  • France
  • Italy
  • Canada
  • United Kingdom
  • Spain
  • China
  • India
  • Australia
Key Segments Covered
  • Product Type
  • Mode of operation
  • Application
  • Distribution channel
  • Region
Key Companies Profiled
  • Asahi Group Holdings
  • Heineken N.V.
  • Anheuser-Busch InBev
  • Carlsberg Group
  • Molson Coors Brewing Company
  • Diageo Plc.
  • Zambelli
  • Lasotherm Technologies
  • Alphatech Process Equipments
Report Coverage
  • Market Forecast
  • Company Share Analysis
  • DROT Analysis
  • Market Dynamics
  • Competitive Landscape
  • Challenges
  • Strategic Growth Initiatives
Customization and Pricing
  • Available upon request

Beer glass chillers market segmentation by category

By Equipment Type:

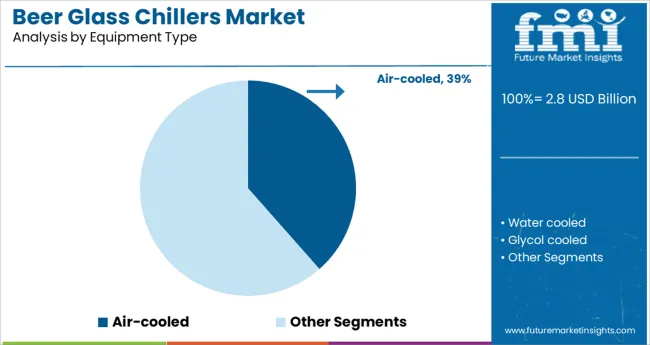
  • Air-cooled
  • Water cooled
  • Glycol cooled

By Application:

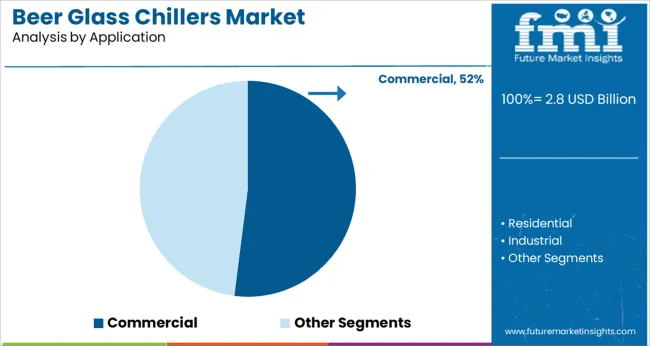
  • Commercial
  • Residential
  • Industrial

By Type:

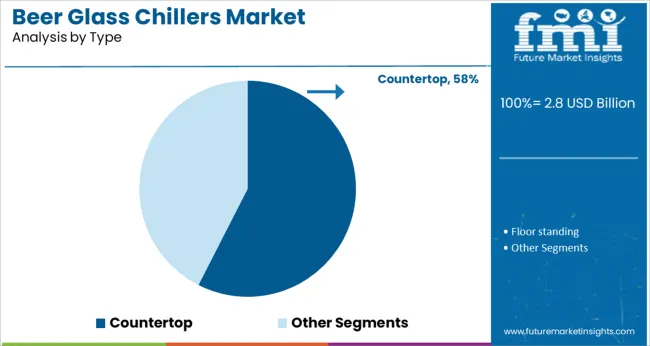
  • Countertop
  • Floor standing

By Distribution channel:

  • Online
  • Offline

By Region:

  • North America
  • Latin America
  • Asia Pacific
  • Eastern Europe
  • Western Europe
  • Japan

Frequently Asked Questions

How big is the Beer Glass Chiller market?

The beer glass chiller market size is assessed to US$ 1,462.2 million in 2023.

At What Rate is Beer Glass Chiller market expected to rise?

The beer glass chiller market is expected to rise at a CAGR of 5.5%.

Which are the major countries driving demand for Beer Glass Chiller market?

The USA, China, Canada, Germany, China, India, the United Kingdom, and Australia are the major countries driving demand for the Beer Glass chiller market.

At what rate will the China Beer Glass Chiller market grow?

China beer glass chiller market is projected to grow at a CAGR of around 5.7% over the next ten years.

What is the market share of Germany Beer Glass Chiller market?

Market share of Germany in beer glass chiller market is about 22.5% of the global market.

Who are the top 5 players operating in the market?

Asahi Group Holdings, Heineken N.V., Anheuser-Busch InBev, Carlsberg Group, Molson Coors Brewing Company are expected to be the top players driving the market growth.

What is the demand outlook forecast for the Beer Glass Chiller market?

The global beer glass chiller market is forecasted to surpass US$ 2,497.6 million by the end of 2033.

Table of Content

1. Executive Summary

    1.1. Global Market Outlook

    1.2. Demand-side Trends

    1.3. Supply-side Trends

    1.4. Technology Roadmap Analysis

    1.5. Analysis and Recommendations

2. Market Overview

    2.1. Market Coverage / Taxonomy

    2.2. Market Definition / Scope / Limitations

3. Market Background

    3.1. Market Dynamics

        3.1.1. Drivers

        3.1.2. Restraints

        3.1.3. Opportunity

        3.1.4. Trends

    3.2. Scenario Forecast

        3.2.1. Demand in Optimistic Scenario

        3.2.2. Demand in Likely Scenario

        3.2.3. Demand in Conservative Scenario

    3.3. Product launches & Recent Developments

    3.4. Product Life Cycle Analysis

    3.5. Value Chain Analysis

        3.5.1. Supply Side Participants and their Roles

            3.5.1.1. Producers

            3.5.1.2. Mid-Level Participants (Traders/ Agents/ Brokers)

            3.5.1.3. Wholesalers and Distributors

        3.5.2. % of Operating Margin Analysis

        3.5.3. List of Raw Material Suppliers

        3.5.4. List of Existing and Potential Buyers

    3.6. Global Market - Pricing Analysis

        3.6.1. Price Point Assessment by Region

        3.6.2. Price Point Assessment by Product Type

        3.6.3. Price Forecast till 2033

        3.6.4. Factors affecting pricing

    3.7. Forecast Factors - Relevance & Impact

    3.8. PESTLE and Porter’s Analysis

    3.9. Regulatory Landscape

        3.9.1. Packaging & Labelling Regulations

        3.9.2. Certifications and Certifying Agency Overview

        3.9.3. Import/Export Policies

    3.10. Regional Parent Market Outlook

    3.11. Production and Consumption Statistics

    3.12. Import and Export Statistics

    3.13. Consumers Survey Analysis

    3.14. Macro-Economic Factors

    3.15. Product Claims & Nutritional Information scanned by Buyers

4. Global Analysis 2018 to 2022 and Forecast, 2023 to 2033

    4.1. Historical Market Size Value (US$ million) & Volume (MT) Analysis, 2018 to 2022

    4.2. Current and Future Market Size Value (US$ million) & Volume (MT) Projections, 2023 to 2033

        4.2.1. Y-o-Y Growth Trend Analysis

        4.2.2. Absolute $ Opportunity Analysis

5. Global Analysis 2018 to 2022 and Forecast 2023 to 2033, By Equipment type

    5.1. Introduction / Key Findings

    5.2. Historical Market Size Value (US$ million) & Volume (MT) Analysis By Equipment Type, 2018 to 2022

    5.3. Current and Future Market Size Value (US$ million) & Volume (MT) Analysis and Forecast By Equipment Type, 2023 to 2033

        5.3.1. Air cooled

        5.3.2. Water cooled

        5.3.3. Glycol cooled

    5.4. Y-o-Y Growth Trend Analysis By Equipment Type, 2018 to 2022

    5.5. Absolute $ Opportunity Analysis By Equipment Type, 2023 to 2033

6. Global Analysis 2018 to 2022 and Forecast 2023 to 2033, By Application

    6.1. Introduction / Key Findings

    6.2. Historical Market Size Value (US$ million) & Volume (MT) Analysis By Application, 2018 to 2022

    6.3. Current and Future Market Size Value (US$ million) & Volume (MT) Analysis and Forecast By Application, 2023 to 2033

        6.3.1. Commercial

        6.3.2. Residential

        6.3.3. Industrial

    6.4. Y-o-Y Growth Trend Analysis By Application, 2018 to 2022

    6.5. Absolute $ Opportunity Analysis By Application, 2023 to 2033

7. Global Analysis 2018 to 2022 and Forecast 2023 to 2033, By Type

    7.1. Introduction / Key Findings

    7.2. Historical Market Size Value (US$ million) & Volume (MT) Analysis By Type, 2018 to 2022

    7.3. Current and Future Market Size Value (US$ million) & Volume (MT) Analysis and Forecast By Type, 2023 to 2033

        7.3.1. Countertop

        7.3.2. Floor standing

    7.4. Y-o-Y Growth Trend Analysis By Type, 2018 to 2022

    7.5. Absolute $ Opportunity Analysis By Type, 2023 to 2033

8. Global Analysis 2018 to 2022 and Forecast 2023 to 2033, By Region

    8.1. Introduction

    8.2. Historical Market Size Value (US$ million) & Volume (MT) Analysis By Region, 2018 to 2022

    8.3. Current Market Size Value (US$ million) & Volume (MT) Analysis and Forecast By Region, 2023 to 2033

        8.3.1. North America

        8.3.2. Latin America

        8.3.3. Europe

        8.3.4. East Asia

        8.3.5. South Asia

        8.3.6. Oceania

        8.3.7. Middle East and Africa (MEA)

    8.4. Market Attractiveness Analysis By Region

9. North America Analysis 2018 to 2022 and Forecast 2023 to 2033, By Country

    9.1. Historical Market Size Value (US$ million) & Volume (MT) Trend Analysis By Market Taxonomy, 2018 to 2022

    9.2. Market Size Value (US$ million) & Volume (MT) Forecast By Market Taxonomy, 2023 to 2033

        9.2.1. By Country

            9.2.1.1. The USA

            9.2.1.2. Canada

        9.2.2. By Equipment type

        9.2.3. By Application

        9.2.4. By Type

    9.3. Market Attractiveness Analysis

        9.3.1. By Country

        9.3.2. By Equipment type

        9.3.3. By Application

        9.3.4. By Type

    9.4. Key Takeaways

10. Latin America Analysis 2018 to 2022 and Forecast 2023 to 2033, By Country

    10.1. Historical Market Size Value (US$ million) & Volume (MT) Trend Analysis By Market Taxonomy, 2018 to 2022

    10.2. Market Size Value (US$ million) & Volume (MT) Forecast By Market Taxonomy, 2023 to 2033

        10.2.1. By Country

            10.2.1.1. Brazil

            10.2.1.2. Mexico

            10.2.1.3. Argentina

            10.2.1.4. Chile

            10.2.1.5. Peru

            10.2.1.6. Rest of Latin America

        10.2.2. By Equipment type

        10.2.3. By Application

        10.2.4. By Type

    10.3. Market Attractiveness Analysis

        10.3.1. By Country

        10.3.2. By Equipment type

        10.3.3. By Application

        10.3.4. By Type

    10.4. Key Takeaways

11. Europe Analysis 2018 to 2022 and Forecast 2023 to 2033, By Country

    11.1. Historical Market Size Value (US$ million) & Volume (MT) Trend Analysis By Market Taxonomy, 2018 to 2022

    11.2. Market Size Value (US$ million) & Volume (MT) Forecast By Market Taxonomy, 2023 to 2033

        11.2.1. By Country

            11.2.1.1. Germany

            11.2.1.2. Italy

            11.2.1.3. France

            11.2.1.4. The United Kingdom

            11.2.1.5. Spain

            11.2.1.6. Russia

            11.2.1.7. BENELUX

            11.2.1.8. Poland

            11.2.1.9. Nordic Countries

            11.2.1.10. Rest of Europe

        11.2.2. By Equipment type

        11.2.3. By Application

        11.2.4. By Type

    11.3. Market Attractiveness Analysis

        11.3.1. By Country

        11.3.2. By Equipment type

        11.3.3. By Application

        11.3.4. By Type

    11.4. Key Takeaways

12. East Asia Analysis 2018 to 2022 and Forecast 2023 to 2033, By Country

    12.1. Historical Market Size Value (US$ million) & Volume (MT) Trend Analysis By Market Taxonomy, 2018 to 2022

    12.2. Market Size Value (US$ million) & Volume (MT) Forecast By Market Taxonomy, 2023 to 2033

        12.2.1. By Country

            12.2.1.1. China

            12.2.1.2. Japan

            12.2.1.3. South Korea

        12.2.2. By Equipment type

        12.2.3. By Application

        12.2.4. By Type

    12.3. Market Attractiveness Analysis

        12.3.1. By Country

        12.3.2. By Equipment type

        12.3.3. By Application

        12.3.4. By Type

    12.4. Key Takeaways

13. South Asia Analysis 2018 to 2022 and Forecast 2023 to 2033, By Country

    13.1. Historical Market Size Value (US$ million) & Volume (MT) Trend Analysis By Market Taxonomy, 2018 to 2022

    13.2. Market Size Value (US$ million) & Volume (MT) Forecast By Market Taxonomy, 2023 to 2033

        13.2.1. By Country

            13.2.1.1. India

            13.2.1.2. Thailand

            13.2.1.3. Malaysia

            13.2.1.4. Indonesia

            13.2.1.5. Singapore

            13.2.1.6. Rest of South Asia

        13.2.2. By Equipment type

        13.2.3. By Application

        13.2.4. By Type

    13.3. Market Attractiveness Analysis

        13.3.1. By Country

        13.3.2. By Equipment type

        13.3.3. By Application

        13.3.4. By Type

    13.4. Key Takeaways

14. Oceania Analysis 2018 to 2022 and Forecast 2023 to 2033, By Country

    14.1. Historical Market Size Value (US$ million) & Volume (MT) Trend Analysis By Market Taxonomy, 2018 to 2022

    14.2. Market Size Value (US$ million) & Volume (MT) Forecast By Market Taxonomy, 2023 to 2033

        14.2.1. By Country

            14.2.1.1. Australia

            14.2.1.2. New Zealand

        14.2.2. By Equipment type

        14.2.3. By Application

        14.2.4. By Type

    14.3. Market Attractiveness Analysis

        14.3.1. By Country

        14.3.2. By Equipment type

        14.3.3. By Application

        14.3.4. By Type

    14.4. Key Takeaways

15. MEA Analysis 2018 to 2022 and Forecast 2023 to 2033, By Country

    15.1. Historical Market Size Value (US$ million) & Volume (MT) Trend Analysis By Market Taxonomy, 2018 to 2022

    15.2. Market Size Value (US$ million) & Volume (MT) Forecast By Market Taxonomy, 2023 to 2033

        15.2.1. By Country

            15.2.1.1. GCC Countries

            15.2.1.2. South Africa

            15.2.1.3. Central Africa

            15.2.1.4. North Africa

        15.2.2. By Equipment type

        15.2.3. By Application

        15.2.4. By Type

    15.3. Market Attractiveness Analysis

        15.3.1. By Country

        15.3.2. By Equipment type

        15.3.3. By Application

        15.3.4. By Type

    15.4. Key Takeaways

16. Key Countries Analysis

    16.1. The USA

        16.1.1. Pricing Analysis

        16.1.2. Market Share Analysis, 2022

            16.1.2.1. By Equipment type

            16.1.2.2. By Application

            16.1.2.3. By Type

    16.2. Canada

        16.2.1. Pricing Analysis

        16.2.2. Market Share Analysis, 2022

            16.2.2.1. By Equipment type

            16.2.2.2. By Application

            16.2.2.3. By Type

    16.3. Brazil

        16.3.1. Pricing Analysis

        16.3.2. Market Share Analysis, 2022

            16.3.2.1. By Equipment type

            16.3.2.2. By Application

            16.3.2.3. By Type

    16.4. Mexico

        16.4.1. Pricing Analysis

        16.4.2. Market Share Analysis, 2022

            16.4.2.1. By Equipment type

            16.4.2.2. By Application

            16.4.2.3. By Type

    16.5. Argentina

        16.5.1. Pricing Analysis

        16.5.2. Market Share Analysis, 2022

            16.5.2.1. By Equipment type

            16.5.2.2. By Application

            16.5.2.3. By Type

    16.6. Chile

        16.6.1. Pricing Analysis

        16.6.2. Market Share Analysis, 2022

            16.6.2.1. By Equipment type

            16.6.2.2. By Application

            16.6.2.3. By Type

    16.7. Peru

        16.7.1. Pricing Analysis

        16.7.2. Market Share Analysis, 2022

            16.7.2.1. By Equipment type

            16.7.2.2. By Application

            16.7.2.3. By Type

    16.8. Germany

        16.8.1. Pricing Analysis

        16.8.2. Market Share Analysis, 2022

            16.8.2.1. By Equipment type

            16.8.2.2. By Application

            16.8.2.3. By Type

    16.9. Italy

        16.9.1. Pricing Analysis

        16.9.2. Market Share Analysis, 2022

            16.9.2.1. By Equipment type

            16.9.2.2. By Application

            16.9.2.3. By Type

    16.10. France

        16.10.1. Pricing Analysis

        16.10.2. Market Share Analysis, 2022

            16.10.2.1. By Equipment type

            16.10.2.2. By Application

            16.10.2.3. By Type

    16.11. Spain

        16.11.1. Pricing Analysis

        16.11.2. Market Share Analysis, 2022

            16.11.2.1. By Equipment type

            16.11.2.2. By Application

            16.11.2.3. By Type

    16.12. United Kingdom

        16.12.1. Pricing Analysis

        16.12.2. Market Share Analysis, 2022

            16.12.2.1. By Equipment type

            16.12.2.2. By Application

            16.12.2.3. By Type

    16.13. Russia

        16.13.1. Pricing Analysis

        16.13.2. Market Share Analysis, 2022

            16.13.2.1. By Equipment type

            16.13.2.2. By Application

            16.13.2.3. By Type

    16.14. Poland

        16.14.1. Pricing Analysis

        16.14.2. Market Share Analysis, 2022

            16.14.2.1. By Equipment type

            16.14.2.2. By Application

            16.14.2.3. By Type

    16.15. BENELUX

        16.15.1. Pricing Analysis

        16.15.2. Market Share Analysis, 2022

            16.15.2.1. By Equipment type

            16.15.2.2. By Application

            16.15.2.3. By Type

    16.16. Nordic Countries

        16.16.1. Pricing Analysis

        16.16.2. Market Share Analysis, 2022

            16.16.2.1. By Equipment type

            16.16.2.2. By Application

            16.16.2.3. By Type

    16.17. China

        16.17.1. Pricing Analysis

        16.17.2. Market Share Analysis, 2022

            16.17.2.1. By Equipment type

            16.17.2.2. By Application

            16.17.2.3. By Type

    16.18. Japan

        16.18.1. Pricing Analysis

        16.18.2. Market Share Analysis, 2022

            16.18.2.1. By Equipment type

            16.18.2.2. By Application

            16.18.2.3. By Type

    16.19. South Korea

        16.19.1. Pricing Analysis

        16.19.2. Market Share Analysis, 2022

            16.19.2.1. By Equipment type

            16.19.2.2. By Application

            16.19.2.3. By Type

    16.20. India

        16.20.1. Pricing Analysis

        16.20.2. Market Share Analysis, 2022

            16.20.2.1. By Equipment type

            16.20.2.2. By Application

            16.20.2.3. By Type

    16.21. Thailand

        16.21.1. Pricing Analysis

        16.21.2. Market Share Analysis, 2022

            16.21.2.1. By Equipment type

            16.21.2.2. By Application

            16.21.2.3. By Type

    16.22. Indonesia

        16.22.1. Pricing Analysis

        16.22.2. Market Share Analysis, 2022

            16.22.2.1. By Equipment type

            16.22.2.2. By Application

            16.22.2.3. By Type

    16.23. Malaysia

        16.23.1. Pricing Analysis

        16.23.2. Market Share Analysis, 2022

            16.23.2.1. By Equipment type

            16.23.2.2. By Application

            16.23.2.3. By Type

    16.24. Singapore

        16.24.1. Pricing Analysis

        16.24.2. Market Share Analysis, 2022

            16.24.2.1. By Equipment type

            16.24.2.2. By Application

            16.24.2.3. By Type

    16.25. Australia

        16.25.1. Pricing Analysis

        16.25.2. Market Share Analysis, 2022

            16.25.2.1. By Equipment type

            16.25.2.2. By Application

            16.25.2.3. By Type

    16.26. New Zealand

        16.26.1. Pricing Analysis

        16.26.2. Market Share Analysis, 2022

            16.26.2.1. By Equipment type

            16.26.2.2. By Application

            16.26.2.3. By Type

    16.27. GCC Countries

        16.27.1. Pricing Analysis

        16.27.2. Market Share Analysis, 2022

            16.27.2.1. By Equipment type

            16.27.2.2. By Application

            16.27.2.3. By Type

    16.28. South Africa

        16.28.1. Pricing Analysis

        16.28.2. Market Share Analysis, 2022

            16.28.2.1. By Equipment type

            16.28.2.2. By Application

            16.28.2.3. By Type

    16.29. North Africa

        16.29.1. Pricing Analysis

        16.29.2. Market Share Analysis, 2022

            16.29.2.1. By Equipment type

            16.29.2.2. By Application

            16.29.2.3. By Type

    16.30. Central Africa

        16.30.1. Pricing Analysis

        16.30.2. Market Share Analysis, 2022

            16.30.2.1. By Equipment type

            16.30.2.2. By Application

            16.30.2.3. By Type

17. Market Structure Analysis

    17.1. Competition Dashboard

    17.2. Competition Benchmarking

    17.3. Market Share Analysis of Top Players

        17.3.1. By Regional

        17.3.2. By Equipment type

        17.3.3. By Application

        17.3.4. By Type

18. Competition Analysis

    18.1. Competition Deep Dive

        18.1.1. Asahi Group Holdings

            18.1.1.1. Overview

            18.1.1.2. Product Portfolio

            18.1.1.3. Profitability by Market Segments (Type/Equipment Type /Application/Region)

            18.1.1.4. Sales Footprint

            18.1.1.5. Strategy Overview

                18.1.1.5.1. Marketing Strategy

                18.1.1.5.2. Product Strategy

                18.1.1.5.3. Channel Strategy

        18.1.2. Heineken N.V.

            18.1.2.1. Overview

            18.1.2.2. Product Portfolio

            18.1.2.3. Profitability by Market Segments (Type/Equipment Type /Application/Region)

            18.1.2.4. Sales Footprint

            18.1.2.5. Strategy Overview

                18.1.2.5.1. Marketing Strategy

                18.1.2.5.2. Product Strategy

                18.1.2.5.3. Channel Strategy

        18.1.3. Anheuser-Busch InBev

            18.1.3.1. Overview

            18.1.3.2. Product Portfolio

            18.1.3.3. Profitability by Market Segments (Type/Equipment Type /Application/Region)

            18.1.3.4. Sales Footprint

            18.1.3.5. Strategy Overview

                18.1.3.5.1. Marketing Strategy

                18.1.3.5.2. Product Strategy

                18.1.3.5.3. Channel Strategy

        18.1.4. Carlsberg Group

            18.1.4.1. Overview

            18.1.4.2. Product Portfolio

            18.1.4.3. Profitability by Market Segments (Type/Equipment Type /Application/Region)

            18.1.4.4. Sales Footprint

            18.1.4.5. Strategy Overview

                18.1.4.5.1. Marketing Strategy

                18.1.4.5.2. Product Strategy

                18.1.4.5.3. Channel Strategy

        18.1.5. Molson Coors Brewing Company

            18.1.5.1. Overview

            18.1.5.2. Product Portfolio

            18.1.5.3. Profitability by Market Segments (Type/Equipment Type /Application/Region)

            18.1.5.4. Sales Footprint

            18.1.5.5. Strategy Overview

                18.1.5.5.1. Marketing Strategy

                18.1.5.5.2. Product Strategy

                18.1.5.5.3. Channel Strategy

        18.1.6. Diageo Plc.

            18.1.6.1. Overview

            18.1.6.2. Product Portfolio

            18.1.6.3. Profitability by Market Segments (Type/Equipment Type /Application/Region)

            18.1.6.4. Sales Footprint

            18.1.6.5. Strategy Overview

                18.1.6.5.1. Marketing Strategy

                18.1.6.5.2. Product Strategy

                18.1.6.5.3. Channel Strategy

        18.1.7. Zambelli

            18.1.7.1. Overview

            18.1.7.2. Product Portfolio

            18.1.7.3. Profitability by Market Segments (Type/Equipment Type /Application/Region)

            18.1.7.4. Sales Footprint

            18.1.7.5. Strategy Overview

                18.1.7.5.1. Marketing Strategy

                18.1.7.5.2. Product Strategy

                18.1.7.5.3. Channel Strategy

        18.1.8. Lasotherm Technologies

            18.1.8.1. Overview

            18.1.8.2. Product Portfolio

            18.1.8.3. Profitability by Market Segments (Type/Equipment Type /Application/Region)

            18.1.8.4. Sales Footprint

            18.1.8.5. Strategy Overview

                18.1.8.5.1. Marketing Strategy

                18.1.8.5.2. Product Strategy

                18.1.8.5.3. Channel Strategy

        18.1.9. Alphatech Process Equipments

            18.1.9.1. Overview

            18.1.9.2. Product Portfolio

            18.1.9.3. Profitability by Market Segments (Type/Equipment Type /Application/Region)

            18.1.9.4. Sales Footprint

            18.1.9.5. Strategy Overview

                18.1.9.5.1. Marketing Strategy

                18.1.9.5.2. Product Strategy

                18.1.9.5.3. Channel Strategy

19. Assumptions & Acronyms Used

20. Research Methodology

Don't pay for what you don't need

Customize your report by selecting specific countries or regions and save 30%!

List of Tables

Table 1: Global Value (US$ million) Forecast by Region, 2018 to 2033

Table 2: Global Volume (MT) Forecast by Region, 2018 to 2033

Table 3: Global Value (US$ million) Forecast by Equipment Type, 2018 to 2033

Table 4: Global Volume (MT) Forecast by Equipment Type, 2018 to 2033

Table 5: Global Value (US$ million) Forecast by Application, 2018 to 2033

Table 6: Global Volume (MT) Forecast by Application, 2018 to 2033

Table 7: Global Value (US$ million) Forecast by Type, 2018 to 2033

Table 8: Global Volume (MT) Forecast by Type, 2018 to 2033

Table 9: North America Value (US$ million) Forecast by Country, 2018 to 2033

Table 10: North America Volume (MT) Forecast by Country, 2018 to 2033

Table 11: North America Value (US$ million) Forecast by Equipment Type, 2018 to 2033

Table 12: North America Volume (MT) Forecast by Equipment Type, 2018 to 2033

Table 13: North America Value (US$ million) Forecast by Application, 2018 to 2033

Table 14: North America Volume (MT) Forecast by Application, 2018 to 2033

Table 15: North America Value (US$ million) Forecast by Type, 2018 to 2033

Table 16: North America Volume (MT) Forecast by Type, 2018 to 2033

Table 17: Latin America Value (US$ million) Forecast by Country, 2018 to 2033

Table 18: Latin America Volume (MT) Forecast by Country, 2018 to 2033

Table 19: Latin America Value (US$ million) Forecast by Equipment Type, 2018 to 2033

Table 20: Latin America Volume (MT) Forecast by Equipment Type, 2018 to 2033

Table 21: Latin America Value (US$ million) Forecast by Application, 2018 to 2033

Table 22: Latin America Volume (MT) Forecast by Application, 2018 to 2033

Table 23: Latin America Value (US$ million) Forecast by Type, 2018 to 2033

Table 24: Latin America Volume (MT) Forecast by Type, 2018 to 2033

Table 25: Europe Value (US$ million) Forecast by Country, 2018 to 2033

Table 26: Europe Volume (MT) Forecast by Country, 2018 to 2033

Table 27: Europe Value (US$ million) Forecast by Equipment Type, 2018 to 2033

Table 28: Europe Volume (MT) Forecast by Equipment Type, 2018 to 2033

Table 29: Europe Value (US$ million) Forecast by Application, 2018 to 2033

Table 30: Europe Volume (MT) Forecast by Application, 2018 to 2033

Table 31: Europe Value (US$ million) Forecast by Type, 2018 to 2033

Table 32: Europe Volume (MT) Forecast by Type, 2018 to 2033

Table 33: East Asia Value (US$ million) Forecast by Country, 2018 to 2033

Table 34: East Asia Volume (MT) Forecast by Country, 2018 to 2033

Table 35: East Asia Value (US$ million) Forecast by Equipment Type, 2018 to 2033

Table 36: East Asia Volume (MT) Forecast by Equipment Type, 2018 to 2033

Table 37: East Asia Value (US$ million) Forecast by Application, 2018 to 2033

Table 38: East Asia Volume (MT) Forecast by Application, 2018 to 2033

Table 39: East Asia Value (US$ million) Forecast by Type, 2018 to 2033

Table 40: East Asia Volume (MT) Forecast by Type, 2018 to 2033

Table 41: South Asia Value (US$ million) Forecast by Country, 2018 to 2033

Table 42: South Asia Volume (MT) Forecast by Country, 2018 to 2033

Table 43: South Asia Value (US$ million) Forecast by Equipment Type, 2018 to 2033

Table 44: South Asia Volume (MT) Forecast by Equipment Type, 2018 to 2033

Table 45: South Asia Value (US$ million) Forecast by Application, 2018 to 2033

Table 46: South Asia Volume (MT) Forecast by Application, 2018 to 2033

Table 47: South Asia Value (US$ million) Forecast by Type, 2018 to 2033

Table 48: South Asia Volume (MT) Forecast by Type, 2018 to 2033

Table 49: Oceania Value (US$ million) Forecast by Country, 2018 to 2033

Table 50: Oceania Volume (MT) Forecast by Country, 2018 to 2033

Table 51: Oceania Value (US$ million) Forecast by Equipment Type, 2018 to 2033

Table 52: Oceania Volume (MT) Forecast by Equipment Type, 2018 to 2033

Table 53: Oceania Value (US$ million) Forecast by Application, 2018 to 2033

Table 54: Oceania Volume (MT) Forecast by Application, 2018 to 2033

Table 55: Oceania Value (US$ million) Forecast by Type, 2018 to 2033

Table 56: Oceania Volume (MT) Forecast by Type, 2018 to 2033

Table 57: MEA Value (US$ million) Forecast by Country, 2018 to 2033

Table 58: MEA Volume (MT) Forecast by Country, 2018 to 2033

Table 59: MEA Value (US$ million) Forecast by Equipment Type, 2018 to 2033

Table 60: MEA Volume (MT) Forecast by Equipment Type, 2018 to 2033

Table 61: MEA Value (US$ million) Forecast by Application, 2018 to 2033

Table 62: MEA Volume (MT) Forecast by Application, 2018 to 2033

Table 63: MEA Value (US$ million) Forecast by Type, 2018 to 2033

Table 64: MEA Volume (MT) Forecast by Type, 2018 to 2033
Nandini Roy Choudhury

Principal Consultant

Talk to Analyst

Find your sweet spots for generating winning opportunities in this market.

List of Charts

Figure 1: Global Value (US$ million) by Equipment Type, 2023 to 2033

Figure 2: Global Value (US$ million) by Application, 2023 to 2033

Figure 3: Global Value (US$ million) by Type, 2023 to 2033

Figure 4: Global Value (US$ million) by Region, 2023 to 2033

Figure 5: Global Value (US$ million) Analysis by Region, 2018 to 2033

Figure 6: Global Volume (MT) Analysis by Region, 2018 to 2033

Figure 7: Global Value Share (%) and BPS Analysis by Region, 2023 to 2033

Figure 8: Global Y-o-Y Growth (%) Projections by Region, 2023 to 2033

Figure 9: Global Value (US$ million) Analysis by Equipment Type, 2018 to 2033

Figure 10: Global Volume (MT) Analysis by Equipment Type, 2018 to 2033

Figure 11: Global Value Share (%) and BPS Analysis by Equipment Type, 2023 to 2033

Figure 12: Global Y-o-Y Growth (%) Projections by Equipment Type, 2023 to 2033

Figure 13: Global Value (US$ million) Analysis by Application, 2018 to 2033

Figure 14: Global Volume (MT) Analysis by Application, 2018 to 2033

Figure 15: Global Value Share (%) and BPS Analysis by Application, 2023 to 2033

Figure 16: Global Y-o-Y Growth (%) Projections by Application, 2023 to 2033

Figure 17: Global Value (US$ million) Analysis by Type, 2018 to 2033

Figure 18: Global Volume (MT) Analysis by Type, 2018 to 2033

Figure 19: Global Value Share (%) and BPS Analysis by Type, 2023 to 2033

Figure 20: Global Y-o-Y Growth (%) Projections by Type, 2023 to 2033

Figure 21: Global Attractiveness by Equipment Type, 2023 to 2033

Figure 22: Global Attractiveness by Application, 2023 to 2033

Figure 23: Global Attractiveness by Type, 2023 to 2033

Figure 24: Global Attractiveness by Region, 2023 to 2033

Figure 25: North America Value (US$ million) by Equipment Type, 2023 to 2033

Figure 26: North America Value (US$ million) by Application, 2023 to 2033

Figure 27: North America Value (US$ million) by Type, 2023 to 2033

Figure 28: North America Value (US$ million) by Country, 2023 to 2033

Figure 29: North America Value (US$ million) Analysis by Country, 2018 to 2033

Figure 30: North America Volume (MT) Analysis by Country, 2018 to 2033

Figure 31: North America Value Share (%) and BPS Analysis by Country, 2023 to 2033

Figure 32: North America Y-o-Y Growth (%) Projections by Country, 2023 to 2033

Figure 33: North America Value (US$ million) Analysis by Equipment Type, 2018 to 2033

Figure 34: North America Volume (MT) Analysis by Equipment Type, 2018 to 2033

Figure 35: North America Value Share (%) and BPS Analysis by Equipment Type, 2023 to 2033

Figure 36: North America Y-o-Y Growth (%) Projections by Equipment Type, 2023 to 2033

Figure 37: North America Value (US$ million) Analysis by Application, 2018 to 2033

Figure 38: North America Volume (MT) Analysis by Application, 2018 to 2033

Figure 39: North America Value Share (%) and BPS Analysis by Application, 2023 to 2033

Figure 40: North America Y-o-Y Growth (%) Projections by Application, 2023 to 2033

Figure 41: North America Value (US$ million) Analysis by Type, 2018 to 2033

Figure 42: North America Volume (MT) Analysis by Type, 2018 to 2033

Figure 43: North America Value Share (%) and BPS Analysis by Type, 2023 to 2033

Figure 44: North America Y-o-Y Growth (%) Projections by Type, 2023 to 2033

Figure 45: North America Attractiveness by Equipment Type, 2023 to 2033

Figure 46: North America Attractiveness by Application, 2023 to 2033

Figure 47: North America Attractiveness by Type, 2023 to 2033

Figure 48: North America Attractiveness by Country, 2023 to 2033

Figure 49: Latin America Value (US$ million) by Equipment Type, 2023 to 2033

Figure 50: Latin America Value (US$ million) by Application, 2023 to 2033

Figure 51: Latin America Value (US$ million) by Type, 2023 to 2033

Figure 52: Latin America Value (US$ million) by Country, 2023 to 2033

Figure 53: Latin America Value (US$ million) Analysis by Country, 2018 to 2033

Figure 54: Latin America Volume (MT) Analysis by Country, 2018 to 2033

Figure 55: Latin America Value Share (%) and BPS Analysis by Country, 2023 to 2033

Figure 56: Latin America Y-o-Y Growth (%) Projections by Country, 2023 to 2033

Figure 57: Latin America Value (US$ million) Analysis by Equipment Type, 2018 to 2033

Figure 58: Latin America Volume (MT) Analysis by Equipment Type, 2018 to 2033

Figure 59: Latin America Value Share (%) and BPS Analysis by Equipment Type, 2023 to 2033

Figure 60: Latin America Y-o-Y Growth (%) Projections by Equipment Type, 2023 to 2033

Figure 61: Latin America Value (US$ million) Analysis by Application, 2018 to 2033

Figure 62: Latin America Volume (MT) Analysis by Application, 2018 to 2033

Figure 63: Latin America Value Share (%) and BPS Analysis by Application, 2023 to 2033

Figure 64: Latin America Y-o-Y Growth (%) Projections by Application, 2023 to 2033

Figure 65: Latin America Value (US$ million) Analysis by Type, 2018 to 2033

Figure 66: Latin America Volume (MT) Analysis by Type, 2018 to 2033

Figure 67: Latin America Value Share (%) and BPS Analysis by Type, 2023 to 2033

Figure 68: Latin America Y-o-Y Growth (%) Projections by Type, 2023 to 2033

Figure 69: Latin America Attractiveness by Equipment Type, 2023 to 2033

Figure 70: Latin America Attractiveness by Application, 2023 to 2033

Figure 71: Latin America Attractiveness by Type, 2023 to 2033

Figure 72: Latin America Attractiveness by Country, 2023 to 2033

Figure 73: Europe Value (US$ million) by Equipment Type, 2023 to 2033

Figure 74: Europe Value (US$ million) by Application, 2023 to 2033

Figure 75: Europe Value (US$ million) by Type, 2023 to 2033

Figure 76: Europe Value (US$ million) by Country, 2023 to 2033

Figure 77: Europe Value (US$ million) Analysis by Country, 2018 to 2033

Figure 78: Europe Volume (MT) Analysis by Country, 2018 to 2033

Figure 79: Europe Value Share (%) and BPS Analysis by Country, 2023 to 2033

Figure 80: Europe Y-o-Y Growth (%) Projections by Country, 2023 to 2033

Figure 81: Europe Value (US$ million) Analysis by Equipment Type, 2018 to 2033

Figure 82: Europe Volume (MT) Analysis by Equipment Type, 2018 to 2033

Figure 83: Europe Value Share (%) and BPS Analysis by Equipment Type, 2023 to 2033

Figure 84: Europe Y-o-Y Growth (%) Projections by Equipment Type, 2023 to 2033

Figure 85: Europe Value (US$ million) Analysis by Application, 2018 to 2033

Figure 86: Europe Volume (MT) Analysis by Application, 2018 to 2033

Figure 87: Europe Value Share (%) and BPS Analysis by Application, 2023 to 2033

Figure 88: Europe Y-o-Y Growth (%) Projections by Application, 2023 to 2033

Figure 89: Europe Value (US$ million) Analysis by Type, 2018 to 2033

Figure 90: Europe Volume (MT) Analysis by Type, 2018 to 2033

Figure 91: Europe Value Share (%) and BPS Analysis by Type, 2023 to 2033

Figure 92: Europe Y-o-Y Growth (%) Projections by Type, 2023 to 2033

Figure 93: Europe Attractiveness by Equipment Type, 2023 to 2033

Figure 94: Europe Attractiveness by Application, 2023 to 2033

Figure 95: Europe Attractiveness by Type, 2023 to 2033

Figure 96: Europe Attractiveness by Country, 2023 to 2033

Figure 97: East Asia Value (US$ million) by Equipment Type, 2023 to 2033

Figure 98: East Asia Value (US$ million) by Application, 2023 to 2033

Figure 99: East Asia Value (US$ million) by Type, 2023 to 2033

Figure 100: East Asia Value (US$ million) by Country, 2023 to 2033

Figure 101: East Asia Value (US$ million) Analysis by Country, 2018 to 2033

Figure 102: East Asia Volume (MT) Analysis by Country, 2018 to 2033

Figure 103: East Asia Value Share (%) and BPS Analysis by Country, 2023 to 2033

Figure 104: East Asia Y-o-Y Growth (%) Projections by Country, 2023 to 2033

Figure 105: East Asia Value (US$ million) Analysis by Equipment Type, 2018 to 2033

Figure 106: East Asia Volume (MT) Analysis by Equipment Type, 2018 to 2033

Figure 107: East Asia Value Share (%) and BPS Analysis by Equipment Type, 2023 to 2033

Figure 108: East Asia Y-o-Y Growth (%) Projections by Equipment Type, 2023 to 2033

Figure 109: East Asia Value (US$ million) Analysis by Application, 2018 to 2033

Figure 110: East Asia Volume (MT) Analysis by Application, 2018 to 2033

Figure 111: East Asia Value Share (%) and BPS Analysis by Application, 2023 to 2033

Figure 112: East Asia Y-o-Y Growth (%) Projections by Application, 2023 to 2033

Figure 113: East Asia Value (US$ million) Analysis by Type, 2018 to 2033

Figure 114: East Asia Volume (MT) Analysis by Type, 2018 to 2033

Figure 115: East Asia Value Share (%) and BPS Analysis by Type, 2023 to 2033

Figure 116: East Asia Y-o-Y Growth (%) Projections by Type, 2023 to 2033

Figure 117: East Asia Attractiveness by Equipment Type, 2023 to 2033

Figure 118: East Asia Attractiveness by Application, 2023 to 2033

Figure 119: East Asia Attractiveness by Type, 2023 to 2033

Figure 120: East Asia Attractiveness by Country, 2023 to 2033

Figure 121: South Asia Value (US$ million) by Equipment Type, 2023 to 2033

Figure 122: South Asia Value (US$ million) by Application, 2023 to 2033

Figure 123: South Asia Value (US$ million) by Type, 2023 to 2033

Figure 124: South Asia Value (US$ million) by Country, 2023 to 2033

Figure 125: South Asia Value (US$ million) Analysis by Country, 2018 to 2033

Figure 126: South Asia Volume (MT) Analysis by Country, 2018 to 2033

Figure 127: South Asia Value Share (%) and BPS Analysis by Country, 2023 to 2033

Figure 128: South Asia Y-o-Y Growth (%) Projections by Country, 2023 to 2033

Figure 129: South Asia Value (US$ million) Analysis by Equipment Type, 2018 to 2033

Figure 130: South Asia Volume (MT) Analysis by Equipment Type, 2018 to 2033

Figure 131: South Asia Value Share (%) and BPS Analysis by Equipment Type, 2023 to 2033

Figure 132: South Asia Y-o-Y Growth (%) Projections by Equipment Type, 2023 to 2033

Figure 133: South Asia Value (US$ million) Analysis by Application, 2018 to 2033

Figure 134: South Asia Volume (MT) Analysis by Application, 2018 to 2033

Figure 135: South Asia Value Share (%) and BPS Analysis by Application, 2023 to 2033

Figure 136: South Asia Y-o-Y Growth (%) Projections by Application, 2023 to 2033

Figure 137: South Asia Value (US$ million) Analysis by Type, 2018 to 2033

Figure 138: South Asia Volume (MT) Analysis by Type, 2018 to 2033

Figure 139: South Asia Value Share (%) and BPS Analysis by Type, 2023 to 2033

Figure 140: South Asia Y-o-Y Growth (%) Projections by Type, 2023 to 2033

Figure 141: South Asia Attractiveness by Equipment Type, 2023 to 2033

Figure 142: South Asia Attractiveness by Application, 2023 to 2033

Figure 143: South Asia Attractiveness by Type, 2023 to 2033

Figure 144: South Asia Attractiveness by Country, 2023 to 2033

Figure 145: Oceania Value (US$ million) by Equipment Type, 2023 to 2033

Figure 146: Oceania Value (US$ million) by Application, 2023 to 2033

Figure 147: Oceania Value (US$ million) by Type, 2023 to 2033

Figure 148: Oceania Value (US$ million) by Country, 2023 to 2033

Figure 149: Oceania Value (US$ million) Analysis by Country, 2018 to 2033

Figure 150: Oceania Volume (MT) Analysis by Country, 2018 to 2033

Figure 151: Oceania Value Share (%) and BPS Analysis by Country, 2023 to 2033

Figure 152: Oceania Y-o-Y Growth (%) Projections by Country, 2023 to 2033

Figure 153: Oceania Value (US$ million) Analysis by Equipment Type, 2018 to 2033

Figure 154: Oceania Volume (MT) Analysis by Equipment Type, 2018 to 2033

Figure 155: Oceania Value Share (%) and BPS Analysis by Equipment Type, 2023 to 2033

Figure 156: Oceania Y-o-Y Growth (%) Projections by Equipment Type, 2023 to 2033

Figure 157: Oceania Value (US$ million) Analysis by Application, 2018 to 2033

Figure 158: Oceania Volume (MT) Analysis by Application, 2018 to 2033

Figure 159: Oceania Value Share (%) and BPS Analysis by Application, 2023 to 2033

Figure 160: Oceania Y-o-Y Growth (%) Projections by Application, 2023 to 2033

Figure 161: Oceania Value (US$ million) Analysis by Type, 2018 to 2033

Figure 162: Oceania Volume (MT) Analysis by Type, 2018 to 2033

Figure 163: Oceania Value Share (%) and BPS Analysis by Type, 2023 to 2033

Figure 164: Oceania Y-o-Y Growth (%) Projections by Type, 2023 to 2033

Figure 165: Oceania Attractiveness by Equipment Type, 2023 to 2033

Figure 166: Oceania Attractiveness by Application, 2023 to 2033

Figure 167: Oceania Attractiveness by Type, 2023 to 2033

Figure 168: Oceania Attractiveness by Country, 2023 to 2033

Figure 169: MEA Value (US$ million) by Equipment Type, 2023 to 2033

Figure 170: MEA Value (US$ million) by Application, 2023 to 2033

Figure 171: MEA Value (US$ million) by Type, 2023 to 2033

Figure 172: MEA Value (US$ million) by Country, 2023 to 2033

Figure 173: MEA Value (US$ million) Analysis by Country, 2018 to 2033

Figure 174: MEA Volume (MT) Analysis by Country, 2018 to 2033

Figure 175: MEA Value Share (%) and BPS Analysis by Country, 2023 to 2033

Figure 176: MEA Y-o-Y Growth (%) Projections by Country, 2023 to 2033

Figure 177: MEA Value (US$ million) Analysis by Equipment Type, 2018 to 2033

Figure 178: MEA Volume (MT) Analysis by Equipment Type, 2018 to 2033

Figure 179: MEA Value Share (%) and BPS Analysis by Equipment Type, 2023 to 2033

Figure 180: MEA Y-o-Y Growth (%) Projections by Equipment Type, 2023 to 2033

Figure 181: MEA Value (US$ million) Analysis by Application, 2018 to 2033

Figure 182: MEA Volume (MT) Analysis by Application, 2018 to 2033

Figure 183: MEA Value Share (%) and BPS Analysis by Application, 2023 to 2033

Figure 184: MEA Y-o-Y Growth (%) Projections by Application, 2023 to 2033

Figure 185: MEA Value (US$ million) Analysis by Type, 2018 to 2033

Figure 186: MEA Volume (MT) Analysis by Type, 2018 to 2033

Figure 187: MEA Value Share (%) and BPS Analysis by Type, 2023 to 2033

Figure 188: MEA Y-o-Y Growth (%) Projections by Type, 2023 to 2033

Figure 189: MEA Attractiveness by Equipment Type, 2023 to 2033

Figure 190: MEA Attractiveness by Application, 2023 to 2033

Figure 191: MEA Attractiveness by Type, 2023 to 2033

Figure 192: MEA Attractiveness by Country, 2023 to 2033

Explore Process Automation Insights

View Reports

Beer Glass Chillers Market