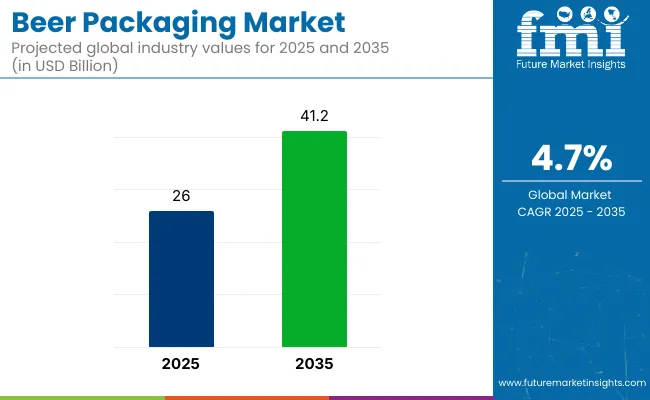
The beer packaging market is projected to grow from USD 26 Billion in 2025 to USD 41.2 Billion by 2035, registering a CAGR of 4.7% during the forecast period. Sales in 2024 reached USD 24.8 billion. Growth has been attributed to innovations in sustainable packaging, the global rise of microbreweries, and the increasing consumer shift toward recyclable cans and eco-friendly glass bottles.

| Attributes | Description |
|---|---|
| Estimated Market Size (2025E) | USD 26 Billion |
| Projected Market Value (2035F) | USD 41.2 Billion |
| Value-based CAGR (2025 to 2035) | 4.7% |
Furthermore, the shift in consumer preferences toward takeaway and direct-to-home beer consumption is boosting demand for robust, printed, and branded packaging formats that offer both preservation and visual appeal across regions.
In 2024, Johnnie Walker, the world’s number one Scotch whisky1 has today unveiled a limited edition first-of-its kind, boundary-breaking innovation. The world’s lightest 70cl Scotch whisky glass bottle. Johnnie Walker Global Brand Director, Jennifer English said, “Johnnie Walker Blue Label Ultra is a truly progressive stride forward for Johnnie Walker, Diageo and the industry. We didn’t know what we were going to be able to achieve when we set out to push the boundaries of luxury, and the result is something that many said would not be possible.”
Eco-conscious consumers and regulatory mandates have pushed beer brands to innovate with sustainable materials and energy-efficient packaging processes. Recyclable aluminum cans, biodegradable wraps, and minimalistic carton formats have been widely adopted to lower the environmental footprint. Many companies are exploring chemical-free inks and water-based adhesives to comply with India's growing packaging sustainability benchmarks.
Automation in material handling and container design optimization has been introduced to minimize waste generation. Smart labels with tamper-evident technology and freshness indicators are gaining ground in urban markets. Localized sourcing of raw materials and decentralization of packaging lines are being encouraged to reduce carbon emissions. The sustainability agenda has been reshaping product development strategies and corporate communication in this market.
Future growth in the beer packaging market is expected to be sustained by digital printing innovation, strategic mergers, and eco-compliance investments. In India, the evolving regulatory environment and ban on single-use plastic are anticipated to reshape the market structure, favoring paperboard and metal solutions.
Companies investing in R&D and smart integration of IoT tracking systems will be positioned competitively. Retail-ready packaging formats and improved cold chain logistics are set to enhance the appeal of premium beer products. The increasing popularity of home deliveries and online beer sales is expected to open new packaging innovation avenues. Profitability will depend on agility in material innovation, scalable logistics, and consumer-driven design adaptability in key Asian markets.
The market is segmented based on packaging format, beer type, distribution channel, end user, region, and key players. By packaging format, segmentation includes primary packaging (such as bottles, cans, kegs, and growlers) and secondary packaging (like shrink wraps, multipack cartons, and basket carriers), tailored for product protection and branding appeal. Beer type segmentation includes lagers, ales, wheat beers, sours, specialty & hybrid beers, and non-alcoholic variants, each requiring specific packaging designs to maintain quality and shelf-life.
Distribution channels are divided into direct-to-customer retail outlets, supermarkets, hypermarkets, convenience stores, and the growing e-commerce segment driven by at-home consumption. End users include bars & pubs, restaurants, events & festivals, and hotels & resorts, with packaging design and logistics adapting to service frequency and branding needs. Regionally, the market spans North America, Latin America, East Asia, South Asia & Pacific, Eastern Europe, Western Europe, Oceania, and Middle East & Africa.
Primary packaging is projected to dominate the beer packaging market with an estimated share of 68.5% in India by 2025. Bottles, cans, and kegs have been utilized extensively to maintain product freshness and ensure shelf appeal. Glass bottles have been preferred in premium segments due to their clarity and traditional branding benefits.
Aluminum cans have gained popularity in urban markets for portability and recyclability. Returnable kegs have been employed in bars and pubs to streamline storage and reduce waste. Cans with easy-open ends and full-wrap branding have supported seasonal and promotional campaigns.
Growlers and crawlers have been used by craft breweries to facilitate takeaway of draft beer. Efforts have been made by manufacturers to improve barrier coatings and seam integrity for longer shelf life.
Packaging innovations such as nitrogen dosed cans and pressure-sensitive labels have been incorporated to enhance customer experience. Shrink sleeves and embossed bottles have been adopted by premium brands to boost visual impact. Glass bottle weight has been reduced to improve logistics efficiency without compromising strength.
Investments in smart closures and tamper-evident packaging have increased for authenticity assurance. Sustainability concerns have encouraged the adoption of recyclable aluminum cans and reusable kegs. Life cycle analyses have guided the choice of materials in large-scale packaging procurement. Lightweight PET bottles have been trialed in select segments for mass distribution. Future demand is expected to be shaped by eco-friendly formats and direct-to-consumer models.

Bars and pubs are anticipated to hold a leading market share of 43.2% in 2025 across India’s beer packaging sector. These venues have favored formats like kegs and growlers that support efficient storage and fast dispensing. Draft beer systems have been optimized to reduce waste and maintain carbonation.
Stainless steel kegs have been used for hygiene, reusability, and cost efficiency. Branded kegs and growlers have been introduced to differentiate offerings at high-footfall locations. Bulk deliveries in reusable containers have reduced packaging waste and ensured freshness for on premise service. RFID-enabled kegs have supported real-time inventory and tracking for breweries. Tamper-proof seals and color-coded caps have been utilized to ensure safety and style.
Beer events and seasonal promotions have driven the use of custom-printed containers and takeaway growlers. Consumer demand for chilled and freshly dispensed beer has supported investment in portable keg systems. Glass growlers and metal crawlers have gained traction among urban microbreweries and taprooms.
Cleaning and refill systems have been standardized across large-format hospitality groups. Partnerships between breweries and pub chains have resulted in co-branded packaging and tap systems. Centralized filling systems have reduced labor at the retail level and improved hygiene standards. Investment in smart dispensing systems has allowed better monitoring of usage and consumer preferences. Future growth is expected to be driven by experiential venues and premiumization of on-tap offerings.

Expansion of Craft Beer Market to Bolster Product Demand
The popularity of craft beer has increased demand for customized yet creative packaging solutions. In addition, craft breweries are known for unique branding and flavors, so the unique packaging of such brews differentiates them in the very competitive brewing industry.
Therefore, this has made packaging design innovation a need, and manufacturers are focusing on differentiation, aesthetic appeal, and other attributes to make their mark. Thus, it is seen that the growth in the craft beer industry is increasingly demanding unique packaging alternatives to fulfill consumer preferences.
Demand for Eco-friendly and Sustainability Packaging
The beer industry is observing a switch toward eco-friendly packaging. Reusable, biodegradable, and recyclable packages are being embraced by many breweries around the globe. This is a part of their step toward decreasing their environmental impact. Moreover, products that can be easily recycled including aluminum cans and glass bottles are being increasingly favored by consumers. Additionally, innovative packaging solutions such as refillable glass bottles and paper bottles are being used by breweries to further reduce waste.
Rising Demand for Lightweight Packaging
Lightweight packaging has emerged as a key trend in the market on account of an emphasis on decreasing transportation costs while enhancing the sustainability of the product. Moreover, fuel consumption can be decreased by lighter bottles, cartons, and cans. They are highly efficient with regard to storage, and this trend has resulted in the creation of thinner glass bottles. Additionally, manufacturers are now developing aluminum cans which result in cost savings and reduce the overall carbon footprint of beer distribution and production.
Surging Demand for Portability and Convenience
Portable and convenient packaging solutions are increasingly being favored by consumers. In this regard, there is a growing demand for smaller packaging sizes, including bottles and cans that can be easily carried, specifically for outdoor activities such as festivals, sports events, and more. Moreover, the surging working class population base demands convenient yet single-serve cans owing to their ease of consumption. Owing to its lightweight and resealable nature, these packs are increasingly being preferred by busy consumers.
Steep Cost of Packaging May Hamper Demand
The cost of raw materials including plastic, glass, and aluminum change due to global demand and supply chain issues, which may add to the overall production cost for breweries. The cost can also increase due to high investments needed in advanced packaging technologies. This factor may make advanced products out of reach for many small companies, which may hamper their ability to compete with giants. Thus, this may limit the mass adoption of the product.
The USA market is slated to register a 24% share in 2025, which can be credited to the booming craft beer industry in the country. This factor has bolstered the requirement for high-quality and varied packaging solutions.
Moreover, the increasing consumption of premium beer varieties owing to a huge working-class population is further contributing to the market growth. Besides this, the strong presence of key market players such as Crown Holdings, Inc., and others who constantly innovate with packaging materials is also accelerating product demand.
The UK beer packaging market is slated to observe a 4.2% CAGR during the study period. The rising emphasis of manufacturers and consumers on sustainability is bolstering the uptake of eco-friendly products in the country. Several breweries in the country are striving to decrease their carbon footprint by embracing eco-friendly materials in beer packages. Furthermore, the government's tightening regulations to phase out carbon emissions are also working in favor of market growth in the country.
Being one of the largest exporters of beer globally, Germany is a major manufacturer of beer packages. Additionally, the country’s low temperature in most times of the year favors the consumption of beer, eventually driving product demand. Besides this, growing product innovations by beer suppliers in terms of materials, labeling, and packaging is also escalating market growth in the country. The export-driven nature of the market in Germany is leading to the introduction of a wide range of premium beer packages.
The rising number of younger consumers looking for new packaging and flavors is leading to the expansion of the beer market in Japan. The growing export of beer products in the country, coupled with surging domestic demand for variety, is leading to market growth in the country. Besides this, the increasing per capita income due to the expanding working class population base has boosted the consumers’ spending on premium beer products, contributing to the market growth.
The market in China is anticipated to expand at 5.1% CAGR from 2025 to 2035. This can be attributed to the country's ever-growing economy. China has evolved into one of the world's biggest beer markets. The boom in beer consumption, especially in younger generations, is creating the need for differentiated packaging solutions.
An expanding middle class and the development of consumer culture have compelled consumers to become increasingly choosy about the brands they buy; hence, it is driving innovation and the attractiveness of packaging. Packaging, which enhances brand identity and appeals to this increasing number of consumers, becomes the focus as beer consumption goes up.
The beer consumers in India, specifically urban consumers who are looking for new and innovative beer options, are making their move toward craft and premium beers. The surge in per capita income and rising trend of sophistication in drinking is boosting the demand for high-quality beer brands in the country.
This is resulting in breweries marketing their products using innovative and attractive packaging, positioning the brands to be high-value products. Thus, changing consumer preferences has already led to demand for attractive and distinctive packaging that will improve the image of the beer and move toward more sophisticated buyers.

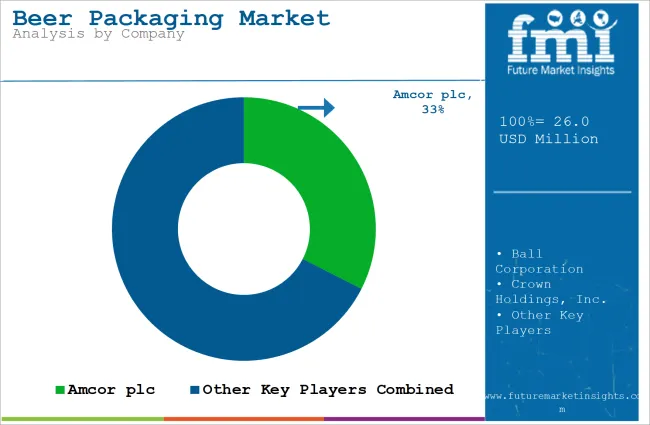
The market has a highly competitive structure, and many giants are leading the industry. Crown Holdings, Amcor, and Ball Corporation are some of the prominent companies present in the market. These players are dominating the production space for glass bottles and other packaging solutions for the beer industry.
These players emphasize boosting their product offerings, harnessing the benefits of advanced technologies, and investing in sustainable packages to stand out from the competition. For instance, Ball Corporation has ramped up its manufacturing capabilities for aluminum cans and is indulging in producing eco-friendly packages. Another key player, Amcor, focuses on developing eco-friendly and lighter packaging material for beverages including beer.
Furthermore, apart from sustainability moves, many players are opting for mergers & acquisition strategies to increase their market reach. For instance, Crown Holdings has completed the acquisition of many companies, which helped it serve different segments of the beer market.
Different startups are releasing sustainable and unique solutions to cater to the ever-changing needs of consumers. Among the prominent startups is Ecovative Design, which focuses on mushroom-based products that can be used to make packaging materials, an eco-friendly alternative to foam and plastic. This is in accordance with the increasing focus on sustainability in the packaging industry.
Furthermore, another startup is Kegstar, which offers an innovative keg rental and management service for craft brewers. It emphasizes efficient and sustainable systems as compared to conventional beer packaging solutions. It focuses on serving the quickly expanding craft beer segment by making investments in smart tracking technologies and a scalable keg pooling system.
The market has been studied based on segments such as type, material, beer type, and region.
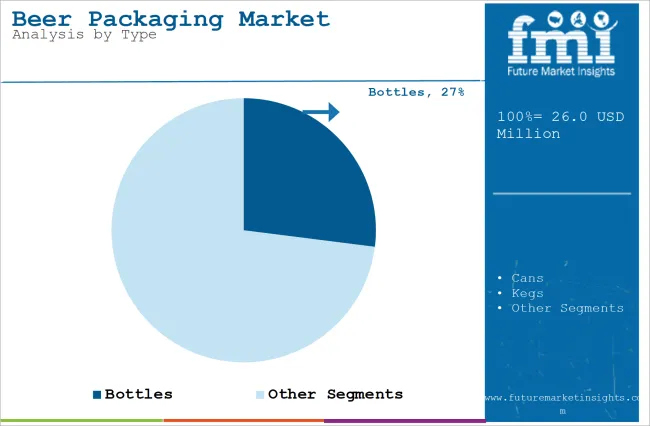
The market is classified into cartons, growlers, cans, kegs, pouches, and bottles.
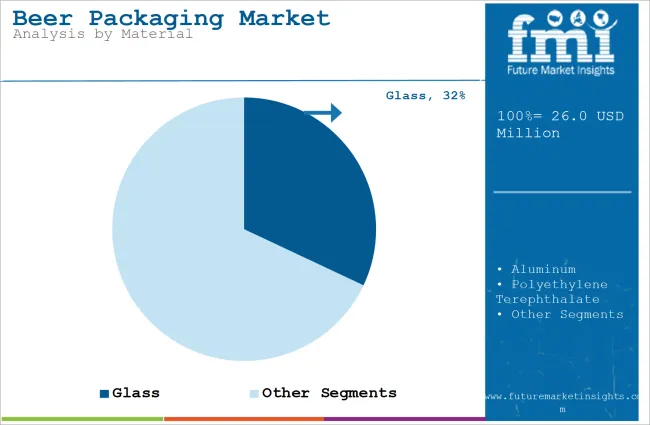
The market is segregated into aluminum, paperboard, stainless steel, glass, polyethylene terephthalate, and plastic.
The market is categorized into specialty and premium beer, mass-produced beer, craft beer, and non-alcoholic and low-alcohol beer.
he market is segregated into Latin America, Asia Pacific, the Middle East & Africa, North America, and Europe.
The market is anticipated to reach USD 26 Billion in 2025.
The market is predicted to reach a size of USD 41.2 Billion by 2035.
Some of the key companies manufacturing the product include Graphic Packaging International, LLC, CCL Industries Inc., Gerresheimer AG, and others.
The USA is a prominent hub for beer packaging manufacturers.


Our Research Products

The "Full Research Suite" delivers actionable market intel, deep dives on markets or technologies, so clients act faster, cut risk, and unlock growth.

The Leaderboard benchmarks and ranks top vendors, classifying them as Established Leaders, Leading Challengers, or Disruptors & Challengers.

Locates where complements amplify value and substitutes erode it, forecasting net impact by horizon

We deliver granular, decision-grade intel: market sizing, 5-year forecasts, pricing, adoption, usage, revenue, and operational KPIs—plus competitor tracking, regulation, and value chains—across 60 countries broadly.

Spot the shifts before they hit your P&L. We track inflection points, adoption curves, pricing moves, and ecosystem plays to show where demand is heading, why it is changing, and what to do next across high-growth markets and disruptive tech

Real-time reads of user behavior. We track shifting priorities, perceptions of today’s and next-gen services, and provider experience, then pace how fast tech moves from trial to adoption, blending buyer, consumer, and channel inputs with social signals (#WhySwitch, #UX).

Partner with our analyst team to build a custom report designed around your business priorities. From analysing market trends to assessing competitors or crafting bespoke datasets, we tailor insights to your needs.
Supplier Intelligence
Discovery & Profiling
Capacity & Footprint
Performance & Risk
Compliance & Governance
Commercial Readiness
Who Supplies Whom
Scorecards & Shortlists
Playbooks & Docs
Category Intelligence
Definition & Scope
Demand & Use Cases
Cost Drivers
Market Structure
Supply Chain Map
Trade & Policy
Operating Norms
Deliverables
Buyer Intelligence
Account Basics
Spend & Scope
Procurement Model
Vendor Requirements
Terms & Policies
Entry Strategy
Pain Points & Triggers
Outputs
Pricing Analysis
Benchmarks
Trends
Should-Cost
Indexation
Landed Cost
Commercial Terms
Deliverables
Brand Analysis
Positioning & Value Prop
Share & Presence
Customer Evidence
Go-to-Market
Digital & Reputation
Compliance & Trust
KPIs & Gaps
Outputs
Full Research Suite comprises of:
Market outlook & trends analysis
Interviews & case studies
Strategic recommendations
Vendor profiles & capabilities analysis
5-year forecasts
8 regions and 60+ country-level data splits
Market segment data splits
12 months of continuous data updates
DELIVERED AS:
PDF EXCEL ONLINE
Cluster Packaging for Beer Market Size and Share Forecast Outlook 2025 to 2035
Market Share Distribution Among Cluster Packaging for Beer Suppliers
Beer Fermenter Market Size and Share Forecast Outlook 2025 to 2035
Beer Stabilizers Market Size and Share Forecast Outlook 2025 to 2035
Beer Bottles Market Size and Share Forecast Outlook 2025 to 2035
Beer Dispensers Market Analysis - Size, Share, and Forecast Outlook 2025 to 2035
Beer Pasteurization Equipment Market Size and Share Forecast Outlook 2025 to 2035
Beer Glass Chillers Market Size and Share Forecast Outlook 2025 to 2035
Beer Market Analysis - Size, Share, and Forecast Outlook 2025 to 2035
Beer Keg System Market Forecast & Outlook for 2025 to 2035
Beer Dispensing Machine Market Trends - Growth, Demand & Analysis 2025 to 2035
Beer Line Cooling System Market Trend Analysis Based on System, Application, and End-Use, and Region 2025 to 2035
Beer Line Cleaning Kit Market Trend Analysis Based on Product, End-User, Type, and Region 2025 to 2035
Beer Filter System Market insights by Equipment Type, Type, Filtration Process, Application, and Region 2025 to 2035
Beer Bottling Kit Market Insights by Equipment, Application, Mode of Operation, Distribution Channel, and Region 2025 to 2035
Market Share Insights for Beer Bottles Providers
Assessing Beer Canning Machines Market Share & Industry Trends
Competitive Overview of Beer Glassware Market Share
Beer Brewing Machine Market
Beer Cans Market

Thank you!
You will receive an email from our Business Development Manager. Please be sure to check your SPAM/JUNK folder too.
Chat With
MaRIA