The growth prospects for the district cooling market have become tremendous because of the demand for climate control that is not only energy-efficient but also environmentally sustainable in urban areas. District cooling system is a method that uses centralized plants to produce cooling energy for commercial, residential or industrial buildings, leading to reduced energy consumption as well as reduced greenhouse gas emissions.
The use of these systems is prevalent in commercial areas, airports, and residential complexes where space saving and energy conservation are vital. This, along with the growing global emphasis on sustainable urban development and the increasing number of smart city initiatives are the major growth drivers.
Furthermore, various government incentives aimed at promoting energy-efficient technologies are also encouraging the adoption of district cooling solutions across various end-use industries, thus propelling the overall market.
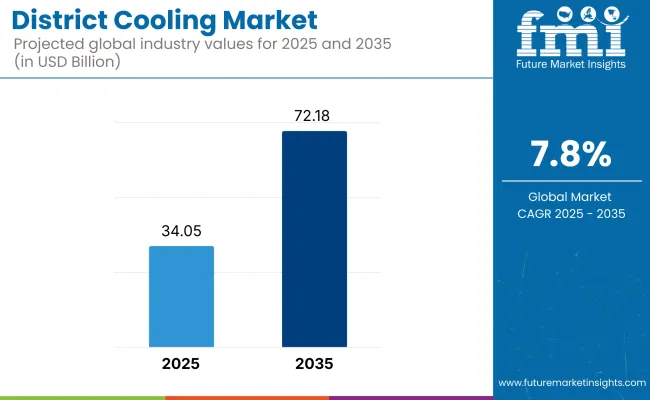
In 2025, the district cooling market size is estimated at approximately USD 34.05 Billion. By 2035, it is projected to reach USD 72.18 Billion, growing at a robust compound annual growth rate (CAGR) of 7.8%.

| Metric | Value |
|---|---|
| Market Size in 2025 | USD 34.05 Billion |
| Projected Market Size in 2035 | USD 72.18 Billion |
| CAGR (2025 to 2035) | 7.8% |
Growth is fueled by surging demand for green building technologies, stringent environmental regulations, and the need for cost-effective cooling solutions in densely populated regions.
Technological advancements such as the integration of renewable energy sources into district cooling plants and the deployment of AI-based monitoring systems are further enhancing operational efficiencies, making district cooling a preferred solution globally.
North America leads the district cooling market share owing to the efforts to promote sustainable building practices and energy efficiency. The USA and Canada are at the forefront, with district cooling solutions also increasingly employed in modern urban wide-ranging developments to university campuses.
Glance, the GIS analytics technology, provided insights into WASH investment planning across regions by identifying the areas that lack basic needs and supporting government initiatives through funding sustainable infrastructure initiatives for climate change adaptation. In Houston and Toronto, new, innovative projects are creating new benchmarks for the adoption of district cooling and developing new market opportunities.
Europe remains a leader in the district cooling market, driven by stringent environmental regulations and aggressive climate targets. Countries like Sweden, Denmark, and Germany are investing heavily in energy-efficient urban infrastructure.
Europe's focus on combining renewable sources of heat with district cooling networks provides opportunities for new entrants in the market. The European Green Deal and the rise in investments towards smart city initiatives are also propelling the adoption of district cooling technologies within commercial and residential applications.
Driven the faster urbanization, increasing temperatures and the demand for sustainable urban development, the Asia-Pacific region is the largest and fastest-growing district cooling market. Countries like the UAE, Singapore, India, and China are heavily investing in district cooling projects in order to mitigate urban heat and energy demand challenges.
Projects such as "Green Cities" and development of infrastructure are contributing to provide better support for increased deployment of district cooling systems, resulting in attractive business opportunities for market players targeting an innovative and large scale cooling systems.
The district cooling industry is positioned for strong growth amid increasing worldwide focus on sustainable development and energy efficiency. The landscape is undergoing a transformation with innovations in renewable integration, smart energy management, and AI-based monitoring.
Decreasing the environmental footprint and aiding realizing more operational cost-saving, district cooling has become a key focus area for governments and the private sector, and will continue to be. With the rapid spatial expansion of urban environments for climate mitigation and the increased focus on climate-responsive solutions for the coordination of infrastructure networks, such as seamless district solutions for cool urban living, the technology for decision-making will gain special importance all over the globe.
High Initial Investment Costs
District cooling systems involve large capital costs up front for infrastructure, including centralized plants, distribution networks, and connections to customers. In regions that lack financial incentives or public-private partnerships, these high initial costs represent a major barrier to widespread deployment of these types of technologies. As well, long payback periods can be a disincentive to would-be investors and developers.
Complex Regulatory and Operational Frameworks
Department of energy helps with District cooling project provided the turning point for stakeholder integration, planning and management. Delays in project implementation can also occur due to navigating the challenging regulatory environment, along with operational challenges such as system integration and demand management. This is further complicated by regional discrepancies in regulation; the approach from jurisdictions often differs considerably.
Growing Demand for Sustainable Cooling Solutions
With cities all over the world adopting greener energy initiatives, efficient, cost-effective, clean air solutions, such as district cooling, become the ultimate solution to reduce both electricity consumption and carbon emissions. Growing awareness of energy efficiency and government policies that promote clean energy systems are creating conducive market conditions particularly in fast urbanizing economies.
Technological Advancements in Energy Efficiency
District cooling systems are becoming more energy efficient, cost-effective, and state-of-the-art, thanks to innovations like thermal energy storage, smart metering and automated plant operations. These systems, along with advanced control systems, help optimize the cooling load to offer district cooling constant peak-load performance, and this makes these systems an attractive solution for large real estate projects and public infrastructure developments.
Further, the district cooling market grew steadily from 2020 to 2024 due to urban expansion, the development of budding smart cities, and rising temperatures in certain regions. Middle Eastern nations, like the UAE and Saudi Arabia, also led in terms of market adoption driven in part by their climate and aggressive urbanization efforts.
In 2025 to 2035 period, the trend will be move towards decentralized cooling system and Hybrid cooling solution integrated with renewable energy sources. Key players will highlight sustainability certifications, energy-efficient designs, and integration with district heating and renewable grids in order to reach carbon neutrality goals more many major cities around the world.
Market Shifts: A Comparative Analysis 2020 to 2024 vs. 2025 to 2035
| Market Aspect | 2020 to 2024 Trends |
|---|---|
| Key Growth Driver | Urbanization and new construction projects |
| Material Innovations | High-performance chilled water pipes |
| Technological Advancements | Thermal storage systems |
| Main Application Areas | Commercial complexes, residential areas |
| Dominant Regions | Middle East, Asia-Pacific |
| Regulatory Landscape | Urban planning policies favoring district cooling |
| Investment Trends | Government-private collaborations |
| Customer Base | Real estate developers, government agencies |
| Competitive Strategy | Capacity expansion, new projects in hot climates |
| Market Aspect | 2025 to 2035 Projections |
|---|---|
| Key Growth Driver | Sustainability goals, integration with renewables |
| Material Innovations | Smart grids and renewable-linked chillers |
| Technological Advancements | AI-driven cooling load optimization |
| Main Application Areas | Smart cities, integrated energy hubs |
| Dominant Regions | Asia-Pacific, Europe |
| Regulatory Landscape | Carbon neutrality and green building mandates |
| Investment Trends | Green financing and carbon credit monetization |
| Customer Base | Smart city operators, sustainable building firms |
| Competitive Strategy | Technological partnerships, service integration |

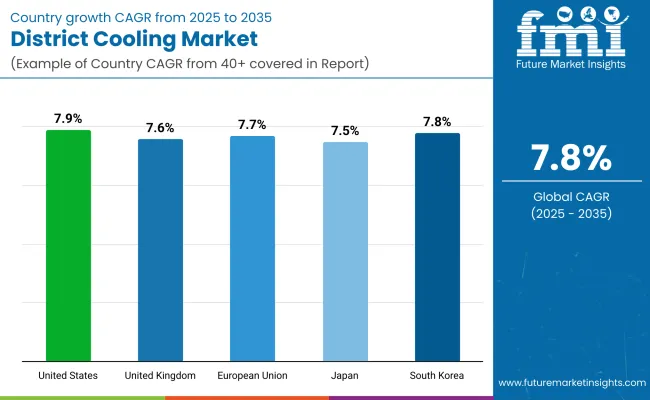
United States district cooling market is propelling at a rapid CAGR due to increasing demand for sustainable and energy efficient cooling solutions in urban developments. Increasing supporting for green building standards such as LEED certification and similar, boost demand even further.
Market opportunities are surging, spurred by rising urbanization projects and government initiatives for energy conservation. With ambitious plans in place to reduce carbon footprints in the cities, the district cooling sector is poised for spectacular development in the next decade across the Middle East.
| Country | CAGR (2025 to 2035) |
|---|---|
| USA | 7.9% |
The district cooling market in the United Kingdom is characterized by increasing demand for cooling systems in the commercial and residential sectors. Investments in alternative energy-efficient infrastructure have gained momentum due to the need for net-zero emissions by 2050.
New deployments are being driven by major urban regeneration projects and increasing awareness of climate-resilient systems. Moreover, government support via grants and policy framework is driving the adoption of district cooling technologies in major cities.
| Country | CAGR (2025 to 2035) |
|---|---|
| UK | 7.6% |
Strong growth has been forecast in the district cooling market across European Union as centralized cooling systems facilitate the sustainability targets of the European Green Deal. Countries such as Sweden and Denmark and France are out in front on installations.
The growth of investments in smart cities and intensifying emphasis on energy security are the key drivers. Moreover, the transition from traditional air conditioning systems to district cooling for commercial complexes, airports, and hospitals is propelling steady market momentum across the region.
| Country | CAGR (2025 to 2035) |
|---|---|
| European Union (EU) | 7.7% |
The district cooling market in Japan is undergoing steady growth as an increasing focus on the development of energy-efficient urban centers and large-scale infrastructure projects continues. It is remarkable how sustainable cooling systems are promoted to prepare for mega-events and urban renovation programs in the future.
District cooling is being integrated into the energy management strategy of key cities around the world. The Japanese market is also predicted to experience sustained growth over the next decade, driven by government initiatives promoting low-carbon technologies, along with corporate investment in smart energy solutions.
| Country | CAGR (2025 to 2035) |
|---|---|
| Japan | 7.5% |
The district cooling market in South Korea is booming owing to smart city projects, a rise in mixed-use urban projects, and policies that enforce energy-efficient building systems. Government's drive to carbon neutrality and green energy transitions is accelerating district cooling network deployment
Dense urban areas and a robust commercial sector are major drivers. Furthermore, collaboration between private companies and public agencies is resulting in technological advancements contributing to higher system efficiency and the further development of district cooling infrastructure throughout the country.
| Country | CAGR (2025 to 2035) |
|---|---|
| South Korea | 7.8% |

| Production Technique | Market Share (2025) |
|---|---|
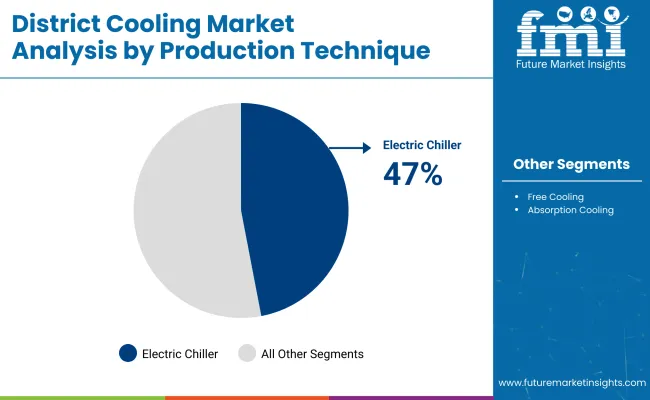
| Electric Chiller | 47% |
Electric chillers hold the largest share of the production technique, due to the operational efficiency, scalability, and integration with modern cooling grids in huge cities, particularly in the developing world where smart city development is progressing at an incredible pace. Electric chillers have many benefits compared to absorption or gas-driven counterparts, including lower emissions, temperature control precision and easy integration with renewable energy sources.
They often provide high coefficients of performance (COP) and are great for citywide (district) cooling systems, commercial complexes, data centers and institutional buildings, so are a great fit for applications where reliable energy-efficient cooling is paramount. The accelerating global urbanization, especially in Asia-pacific, Middle East and some parts of Europe, has influenced smart city initiatives to focus on building sustainable infrastructure, sustainable energy & intelligent building management systems.
Electric chillers, with their increased level of automation and adaptability to IoT-enabled energy grids, slot smoothly into these developing ecosystems. Additionally, innovation in chiller technology with the introduction of magnetic bearing compressors, variable speed drives (VSDs), and low-global-warming-potential (GWP) refrigerants, have made electric chillers increasingly attractive due to improved efficiency, reduced lifecycle costs, and the capability to comply with demanding environmental regulations.
The production technique segment is anticipated to maintain its lead in electric chillers, which would dominate due to growing emphasis on energy conservation, decarbonization goals, and technological modernization.

| Application | Market Share (2025) |
|---|---|
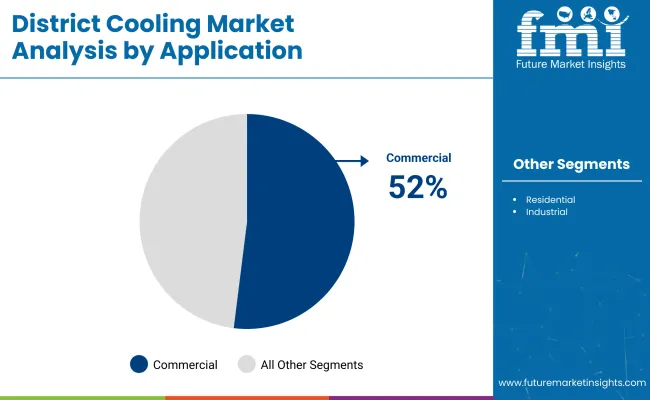
| Commercial | 52% |
By product segment, the commercial sector is expected to dominate the application segment, on account of the high demand from shopping malls, airports, office buildings, and hotels that require centralized, energy-efficient cooling solutions. Commercial facilities focus on energy efficiency, operational reliability, and temperature stability for occupant comfort and building management systems.
This has made the commercial sector the biggest consumer of modern cooling technologies (e.g., electric chillers), which are designed to provide cooling across variable load conditions, alongside long-term reductions in operating cost.
This, in turn, is expected to drive the adoption of advanced HVAC (Heating, Ventilation, and Air Conditioning) systems, due to increasing commercial infrastructure investments owing to urbanization trends across the Asia-Pacific, North America, and Europe. If you’re not aware, commercial developers are also incentivized by green building certifications like LEED (Leadership in Energy and Environmental Design) as well as cross-border, national energy efficiency programs to adopt smart, sustainable cooling technologies.
Hotels and airports, in particular, require 24/7 operational reliability with as little downtime as possible, making efficient chillers an ideal solution. Retail stores, and corporate office spaces and shopping centers exhibit many of the same patterns in zoned cooling, automated control systems, and energy performance, and all strongly favor the deployment of scalable chiller systems. As net-zero carbon targets and sustainable urbanization efforts continue to dominate discussions globally, the commercial segment is likely to continue leading the application segment through 2035.
Rising urbanization, increasing environmental awareness, and growing energy-efficient cooling system demand are driving robust growth in the district cooling market. Governments in different regions are advocating for district cooling projects, which are touted as a more environmentally friendly alternative to traditional refrigeration-based methods of air conditioning.
Technologies such as AI-based energy management and smart grid integration are also fuelling the market. Businesses are pouring money into R&D to maximize energy efficiency and shrink carbon footprints as inputs to production and distribution.
Additionally, the incorporation of renewable energy sources with district cooling in a single network is likely to augment the market growth. The global smart grid market is expected to grow at a substantial CAGR of 7.8% from 2025 to 2035 and the outlook of the industry remains highly positive, particularly at this time when smart city initiatives are gaining traction worldwide.
Market Share Analysis by Company
| Company Name | Estimated Market Share (%) |
|---|---|
| ENGIE | 18-22% |
| Emirates Central Cooling Systems Corporation (Empower) | 15-18% |
| National Central Cooling Company PJSC (Tabreed) | 12-15% |
| Veolia Environment S.A. | 8-11% |
| Siemens AG | 5-8% |
| Other Companies (combined) | 30-40% |
| Company Name | Key Offerings/Activities |
|---|---|
| ENGIE | In 2025, expanded district cooling projects across Europe and Asia. Introduced AI-enabled optimization platforms to maximize energy efficiency and sustainability. Partnered with smart city initiatives for integrated urban cooling networks. |
| Empower | In 2024, completed major expansions in Dubai's Business Bay and Downtown districts. Adopted green building certification standards. Focused on enhancing plant automation and smart metering systems to optimize performance. |
| Tabreed | In 2025, launched new district cooling plants across Saudi Arabia and Bahrain. Collaborated with governmental bodies to support national sustainability goals. Deployed hybrid energy systems to increase operational flexibility. |
| Veolia | In 2024, expanded its cooling services in Southeast Asia. Invested in IoT-based remote monitoring technologies and water-saving solutions. Emphasized energy recovery and waste heat utilization in cooling networks. |
| Siemens | In 2025, launched a new suite of smart controls and automation solutions for district cooling networks. Strengthened strategic partnerships with utility companies and smart city projects globally. |
Key Company Insights
ENGIE (18-22%)
ENGIE hold the market-leading position in the district cooling market due to strong synergies between energy efficiency innovations leading to widespread project rollouts. Moreover, partnerships with smart city developers and investments in AI-based solutions provide a competitive edge. Moreover, ENGIE's focus on decarbonization and climate targets enhances its value proposition as a partner for urban developers and governments.
Empower (15-18%)
As a major player in the Middle East, the UAE in particular, Empower offers a significant opportunity for this gig. Its commitment to sustainable practices, intelligent plant management and green building certifications bolsters its market leadership.
Tabreed (12-15%)
Tabreed's strategy is centered on growth in the GCC (Gulf Cooperation Council) area. It competes for long-term contracts by resonating with national visions about sustainable infrastructure. Hybrid energy models and government partnerships allow it to stake out territory for megaprojects of the future.
Veolia Environment S.A. (8-11%)
Veolia leverages its expertise in environmental services to improve its district cooli by combining water management and energy recovery approaches, it allows for cost-effective and sustainable applications. Their global presence is cemented by strategic expansion in Asia-Pacific.
Siemens AG (5-8%)
Siemens harnesses its core expertise in automation and smart technology to provide intelligent district cooling systems. With smart city partnerships, R&D investments, and cutting-edge area focus, the company continues to help lead the future of technology within the space.
Other Key Players (30-40% Combined)
The overall market size for district cooling market was USD 34,058.88 million in 2025.
The district cooling market expected to reach USD 72,180.18 million in 2035.
Key drivers for district cooling market demand include urbanization, rising energy efficiency needs, government initiatives for sustainable cooling, and growing commercial sector developments.
The top 5 countries which drives the development of cargo bike tire marketare USA, UK, Europe Union, Japan and South Korea.
Commercial sector segment driving market growth to command significant share over the assessment period.


Full Research Suite comprises of:
Market outlook & trends analysis
Interviews & case studies
Strategic recommendations
Vendor profiles & capabilities analysis
5-year forecasts
8 regions and 60+ country-level data splits
Market segment data splits
12 months of continuous data updates
DELIVERED AS:
PDF EXCEL ONLINE
District Heating and Cooling Market Size and Share Forecast Outlook 2025 to 2035
District Heating Market Size and Share Forecast Outlook 2025 to 2035
District Heating Pipeline Network Market Size and Share Forecast Outlook 2025 to 2035
Solar District Heating Market Analysis - Size, Share, and Forecast 2025 to 2035
Cooling Tower Fans Market Size and Share Forecast Outlook 2025 to 2035
Cooling Skincare Gels Market Size and Share Forecast Outlook 2025 to 2035
Cooling Laser Power Measurement Sphere Market Size and Share Forecast Outlook 2025 to 2035
Cooling Agents Market Size and Share Forecast Outlook 2025 to 2035
Cooling Pump Market Size and Share Forecast Outlook 2025 to 2035
Cooling Essences Market Size and Share Forecast Outlook 2025 to 2035
Cooling Tower Market Size and Share Forecast Outlook 2025 to 2035
Cooling Boxes Market Size and Share Forecast Outlook 2025 to 2035
Cooling Tower Rental Market Size, Growth, and Forecast 2025 to 2035
Cooling Management System Market - Growth & Demand 2025 to 2035
Cooling Fans Market Growth - Trends & Forecast 2025 to 2035
Cooling Water Treatment Chemicals Market Growth - Trends & Forecast 2025 to 2035
Cooling and Heating as a Service Market Growth – Trends & Forecast 2025-2035
Gas Cooling System Market Analysis - Size, Share, and Forecast Outlook 2025 to 2035
Self Cooling Packaging Market Size and Share Forecast Outlook 2025 to 2035
Green Cooling Technologies Market

Thank you!
You will receive an email from our Business Development Manager. Please be sure to check your SPAM/JUNK folder too.
Chat With
MaRIA