Cooling Tower Rental Market Forecast and Outlook 2025 to 2035

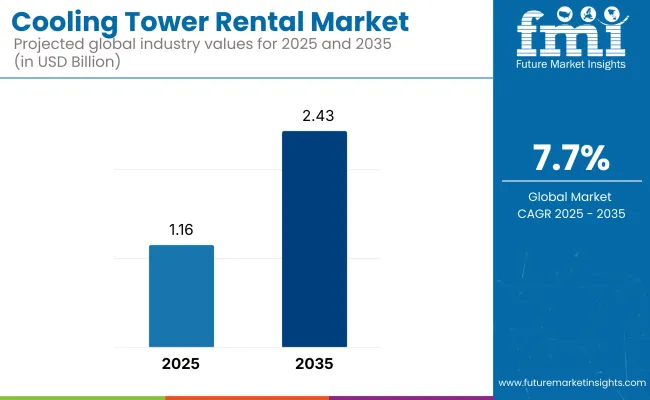
The cooling tower rental market is projected to grow from USD 1.16 billion in 2025 to USD 2.43 billion by 2035, registering a CAGR of 7.7%. This growth is driven by increasing demand from industries such as power generation, chemicals, and data centers, particularly in North America, China, and India. Temporary cooling solutions are becoming critical amid rising infrastructure upgrades, equipment failures, and heatwave emergencies.
Stricter environmental mandates across the USA and Europe are prompting end-users to shift toward water-efficient and energy-saving rental towers. This is further reinforced by the rising adoption of IoT and AI-integrated cooling systems that allow for predictive maintenance and operational efficiency. Hybrid towers-combining wet and dry technologies-are gaining traction in regions with water constraints, notably in Europe and parts of the USA

Looking ahead, modular and compact cooling systems are expected to dominate demand in space-constrained industrial zones in Japan and South Korea. Meanwhile, emerging economies such as China and India are witnessing the highest growth due to rapid industrialization, data center expansion, and evolving emission control norms.

Companies are investing in fast-deployment fleets and smart-enabled cooling units to address shifting customer priorities around sustainability, compliance, and cost.

Cooling Tower Rental Market

Furthermore, the competitive landscape is witnessing consolidation and vertical integration as major players seek to control raw material sourcing, resin formulation, and component fabrication under one roof. Leading manufacturers are forming joint ventures with automotive OEMs, aerospace contractors, and renewable energy firms to secure long-term contracts and reduce supply volatility.

In addition, investments in recycling technologies-such as pyrolysis and solvolysis-are gaining momentum to address regulatory concerns and circular economy goals. This convergence of material science innovation, sustainability compliance, and strategic partnerships will define the next decade of growth in the carbon fiber composites industry.

Cooling Tower Rental Market Analysis by Top Investment Segments

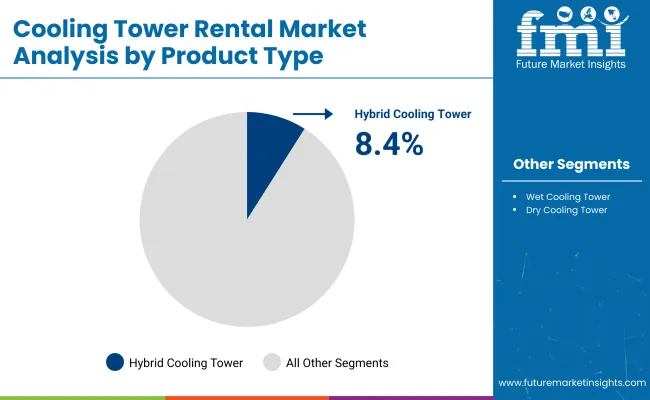
By Product Type, Hybrid Cooling Towers to Lead Future Growth

Wet cooling towers currently dominate due to their high cooling efficiency and widespread use across power generation, petrochemical, and manufacturing sectors. However, growing concerns about water usage and stricter environmental regulations are creating strong momentum for hybrid cooling towers.

These systems, which blend wet and dry cooling mechanisms, offer a sustainable solution for regions facing water scarcity and stringent efficiency norms. Their ability to reduce water consumption while maintaining performance makes them the fastest-growing segment, especially in the USA, Europe, and Australia.
Cooling Tower Rental Market Analysis By Product Type

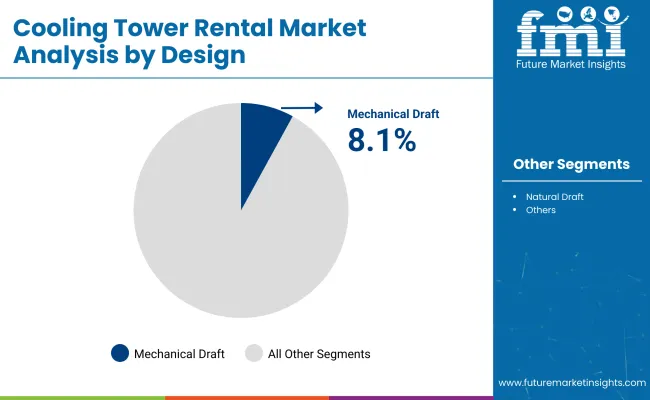
By Design, IoT-Enabled Mechanical Draft Towers to Dominate

Mechanical draft towers lead the market owing to their fan-assisted high airflow efficiency and adaptability across industries like chemicals, refineries, and data centers. Their modularity and lower land requirements make them preferable over natural draft systems.

With increasing demand for predictive maintenance and smart energy use, IoT-enabled mechanical draft towers are seeing accelerated adoption. The integration of digital technologies in mechanical systems is expected to set new benchmarks for performance and uptime in industrial applications.
Cooling Tower Rental Market Analysis By Design

By End User Verticals, Commercial Segment to Witness Fastest Growth

The industrial sector holds the largest share, driven by long-standing usage across power plants, petrochemical refineries, and pharmaceutical manufacturing. However, the commercial segment is projected to grow at the fastest pace due to the rising demand from data centers, malls, and office complexes.

Rapid digitization and urban expansion-especially in North America, Europe, and Southeast Asia-are fueling this surge. Rental cooling systems are also preferred in commercial buildings for seasonal peak loads and emergency situations, making them a strategic choice for facility managers.

Cooling Tower Rental Market Analysis By End User

FMI Survey Results: Cooling Tower Rental Market Dynamics Based on Stakeholder Perspectives

Priorities of Stakeholder

  • Operational Efficiency: For 81% of respondents, maximizing cooling efficiency and uptime remains a "critical" priority, especially in the industrial and energy sectors.
  • Regulations: 78% of respondents indicated compliance with environmental and emissions regulations as their number one concern.
  • Scalability & Flexibility: 69% of industrial operators requested modular and scalable rental solutions for their occasional cooling demand.

Regional Variance

  • USA: 74% highlighted digital monitoring (IoT-enabled cooling towers) versus just 42% in Japan.
  • Western Europe: 85% focused on energy efficiency and water conservation owing to strict EU legislation.
  • Japan/South Korea: 65% wanted a compact cooling system for space-constrained industrial sites.

High Variance in Adoption

  • USA: 61% of the innovative industrial operators adopted IoT-enabled remote monitoring for predictive maintenance.
  • Western Europe: 57% deployed AI-based automation in optimizing water and energy use.
  • Japan: only 29% were forced to implement digital monitoring due to budget constraints and reliance on outdated cooling systems
  • South Korea: 43% in hybrid cooling (air + water) for cost savings

ROI Perspectives: Converging and diverging

75% of USA stakeholders viewed automation as a high-value investment; however, 37% of Japanese stakeholders were hesitant due to perceived initial high costs.

Material & Design Preferences

Consensus

Corrosion-resistant components: 68% of global stakeholders selected reinforced fiberglass or stainless steel due to durability and cost savings over time.

Regional Differences

  • Western Europe: Alphatower series (Aluminum-cased) - 59% (recyclability issues).
  • Japan/South Korea: 46% selected hybrid plastic-metal structures due to the balance of cost and durability.
  • USA: 72% were industrial-grade polymer casings due to impact resistance and lifespan.

Price Sensitivity & Cost Considerations

Shared Challenges

87% cited rising material and energy costs as a factor impacting rental prices.

Regional Differences

  • USA/Western Europe: 66% would pay a 10-15% premium for energy-efficient, IoT-equipped cooling towers.
  • Japan/South Korea: 70% liked low-cost models without digital features.
  • South Korea: 48% of industrial operators preferred subscription rental models to outright purchases.

Value Chain Pains: The Talking Points

Manufacturers

  • This gap is of real concern, as 55% of USA respondents were having difficulties integrating digital monitoring as a result of semiconductor shortages.
  • Western Europe: 52% cited issues with regulatory certifications (CE marking, sustainability compliance).
  • Japan: 60% said the domestic demand was weak because of historic overreliance on the existing infrastructure.

Distributors

  • USA: 66% cited supply chain delays stemming from reliance on offshore components.
  • Western Europe: 58% faced competition from low-cost Asian manufacturers.
  • Japan/South Korea: 62 percent cited logistical challenges in shipping to isolated industrial regions.

End Users (Industrial Operators)

  • USA: "High rental costs"-mentioned by 44%-are a top concern.
  • Western Europe: 42% struggled to retrofit existing plants with new rental cooling solutions.
  • Japan: 55% had complaints about the lack of technical support for smart-enabled cooling systems.

Future Investment Priorities

Alignment Across Regions

70% of global manufacturers plan to invest in IoT-based cooling towers for efficiency improvement.

Divergence in Priorities

  • USA: 62% invested in modular, high-capacity cooling towers with remote monitoring
  • Western Europe: 58% are investing in water-saving and energy-efficient cooling designs.
  • Japan/South Korea: 49% preferred compact, easy-to-install rental units for space-constrained locations.

Regulatory Impact

  • USA: 67% cited OSHA and EPA directives as the primary drivers for the need for cooling tower rental.
  • Western Europe: 82% acknowledge that the EU's Industrial Emissions Directive is shaping sustainable cooling solutions.
  • Japan/South Korea: Only 38% thought regulations had a noticeable impact on investment because enforcement was lax.

Conclusion: Variance vs Consensus

High Consensus

Efficiency, cost containment, and regulatory compliance are global problems.

Key Variances

  • USA: Technologies through high-tech automation (IoT-driven cooling towers); Japan/South Korea: cost-effective adoption of existing designs.
  • Western Europe: Leading the charge for sustainable cooling solutions vs. Asia: Efficient implementation of small, cost-effective designs.

While the data focuses on market-wide performance, companies must develop region-specific adaptation strategies to penetrate highly differentiated markets. The USA has a penchant for high-tech automation; Europe is toward green cooling, and in Asia, low-cost, space-saving designs are the focus.

Government Regulations on the Industry

Countries Government Regulations and Mandatory Certifications
The United States The USA Environmental Protection Agency (EPA) provides guidelines for cooling tower operations to minimize environmental impact and public health risks, particularly concerning Legionella bacteria proliferation. These guidelines recommend best practices for water treatment, system design, and maintenance. Additionally, state regulations vary; for example, California emphasizes water conservation and mandates regular maintenance and water quality testing. In New York City, cooling tower registration is mandatory prior to operation, with annual certifications required to confirm compliance with maintenance and testing protocols.
United Kingdom The Health and Safety Executive (HSE) issues safety notices emphasizing the proper management of risks associated with Legionella in cooling towers. Compliance with these notices is crucial for legal operation, focusing on regular maintenance, risk assessments, and implementation of control measures to prevent bacterial growth.
Germany Germany imposes stringent regulations on short-term rentals to protect residential housing, requiring permits for such activities. However, specific regulations for cooling tower rentals are not detailed in the provided sources.
India The Cooling Technology Institute (CTI) certification is a significant credential in India, ensuring cooling towers meet stringent standards in thermal performance, sound levels, airflow efficiency, water distribution, and drift eliminator efficiency. Achieving CTI certification demonstrates compliance with international quality and performance benchmarks.

Country-Wise Analysis

United States

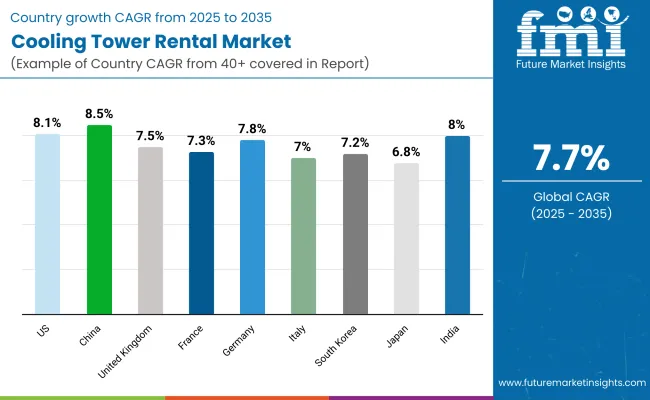
On the strength of active industry and stringent environmental regulations, the USA cooling tower rent market will advance at an 8.1% CAGR, outpacing the world average. The heat-producing industries, such as power generation, oil & gas, and data centers, which require effective cooling, anchor the demand.

Stringent EPA Clean Water Act (CWA) regulations are also motivating businesses to pursue green alternatives for cooling. The adoption of IoT-enabled cooling towers is thus on the rise, helping in real-time monitoring and predictive maintenance. Additionally, official substations for energy-conserving assets and expanding large-scale enterprises will likewise drive the United States rental cooling market.

United Kingdom

The UK market will witness growth at a 7.5% CAGR owing to stringent environmental regulations coupled with the increasing adoption of energy-efficient cooling systems. Legionella cannot infiltrate a workplace, making maintenance and rental facilities essential for the industry.

Portable air conditioners have seen a rise in prevalence in manufacturing, construction, food processing, and other industries. In addition, building regulations Part L and BREEAM certification are promoting low-emission, water-saving cooling towers. However, another significant factor driving the demand for rental cooling systems is the growth of the data center industry.

France

The rental cooling tower market is expected to grow at a 7.3% CAGR in France, primarily due to industrial sustainability drives and stringent ICPE environmental laws. As the government places increasing emphasis on HQE (Haute Qualité Environnementale) certification, industries are integrating water-conserving and low-emission cooling towers.

Rental cooling solutions are the major consumers of food and beverages, chemicals, and pharmaceuticals. In addition, Legionella prevention regulations require the cooling system to be serviced regularly and temporarily replaced. The EU directives that aim for carbon neutrality by 2050 and energy-saving goals will also provide impetus to market growth.

Germany

The market for cooling tower rentals in Germany is anticipated to grow at the rate of 7.8% during the forecast period, owing to the high industrial demand and high emission control regulations. Demand for energy-efficient rental cooling equipment is propelled by stringent cooling tower emissions regulations under the TA Luft (Technical Instructions on Air Quality Control) and the Federal Emission Control Act (BImSchG).

Large chemical, automotive, and data center industries drive market growth. Moreover, Blue Angel Certification encourages businesses to go green with their cooling systems. With Germany leading the way in the transition to renewable energy in Europe, rental cooling towers are increasingly being used in temporary industrial cooling processes.

Italy

While the Italy rental cooling tower market will grow at a 7.0% CAGR, the growth will be mainly attributable to the introduction of Legionella Control Laws (D.Lgs 81/2008 & UNI 8884) and Integrated Environmental Authorisation (AIA) legislation. Rental cooling towers play a crucial role in temporary and emergency cooling for the pharmaceutical, textile, and food processing industries.

In Italy, low-energy cooling is being driven by a compliance focus with the EU Energy Efficiency Directive. However, growth is limited by the slow take-up of intelligent cooling technology, a trend that will be reversed as industrial automation accelerates.

South Korea

A source of South Korean cooling towers is projected to develop at a 7.2% CAGR on the back of government regulations for commercial emissions reduction and energy-efficiency improvement. Acts of rationalization under the Clean Air system drive the high costs of high-cost, low-emission, and high-efficiency cooling systems in various industries.

As precision cooling occupies an important position in manufacturing, the electronics and semiconductor industry is a crucial demand driver for cooling towers. In addition, increasing urban data centers and smart factory automation are boosting the need for IoT-integrated cooling tower rental markets.

Japan

Japan's heating and cooling tower rental market is anticipated to expand at a CAGR of 6.8%, slightly below the global average, attributed to strong reliance on traditional systems and sluggish adoption of novel cooling systems. Compliance with laws such as the Water Pollution Control Act and JIS B 8623 Certification ensures environmental and safety standards.

The expense and need for long-term investment in stationary cooling systems, however, limit growth in the rental segment. Nonetheless, growth in compact cooling systems for space-limited industrial facilities and data center construction in urban areas is expected to create opportunities in the coming years.

China

The rental cooling tower market in China will be growing with a CAGR of 8.5%, the highest growth rate for any of the largest economies across the globe, because of strong industrialization and growth in data centers, as well as stringent emission control regulations. Increased stringent industrial emissions regulations under the Air Pollution Prevention and Control Action Plan will boost the green rental cooling tower market share.

The chemical, power generation, and manufacturing sectors predominantly use rental cooling solutions. In China, The Green Building Evaluation Standards (GBES) and China Compulsory Certification (CCC) encourage low-emission and energy-efficiency cooling systems, which further increases the market.

India

India's demand for cooling towers will see a CAGR of 8.0% in the rental market as there is rapid industrial growth, urbanization, and a rise in environmental standards. A combination of CPCB norms driving more stringent industrial emission norms and companies choosing short-term compliant cooling solutions is awakening the market. Manufacturing, power generation, and pharmaceutical industries are experiencing an increase in demand.

All of these initiatives are driving green rental cooling adoption through energy efficiency incentives and BEE Star Rating for Cooling Towers. The challenges posed by the water shortage for industry are significant and increasing, which provides a strong business case for hybrid and water-conserving cooling solutions.
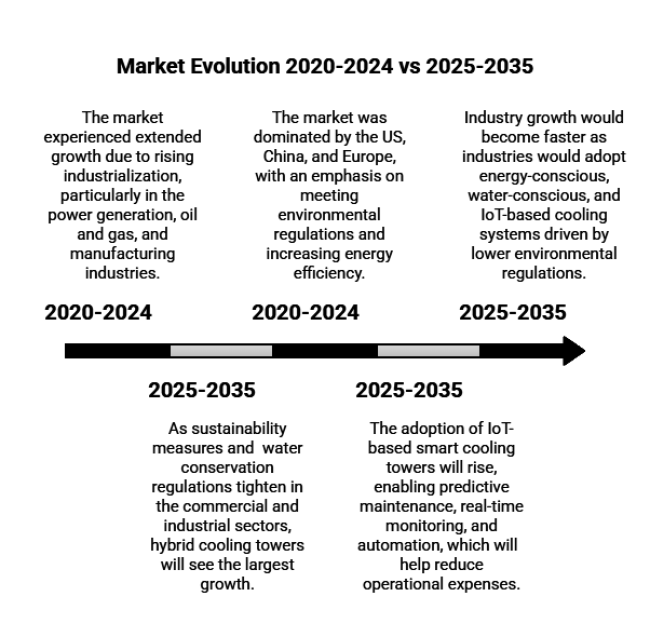
Industry Evolution 2020 to 2024 vs 2025 to 2035

Cooling Tower Rental Market Evolution 2020-2024 Vs 2025-2035

2020 to 2024 2025 to 2035
The market experienced extended growth due to rising industrialization, particularly in the power generation, oil and gas, and manufacturing industries. Industry growth would become faster as industries would adopt energy-conscious, water-conscious, and IoT-based cooling systems driven by lower environmental regulations.
Due to the disruption caused by COVID-19, industrial activities saw a short-term depletion in 2020, which impacted cooling tower rental demand. Still, the market recovered in 2021 to 2022 owing to increased investment in infrastructure and manufacturing. Industrialization 3.0: Demand will continue to be driven by post-pandemic industrial growth and economic recovery, with the big growth markets emerging as developing economies, such as India, China, and Southeast Asia.
The market was dominated by the USA, China, and Europe, with an emphasis on meeting environmental regulations and increasing energy efficiency. Although North America and Europe will still lead the overall market, the highest growth rate will be in the Asia-Pacific region due to advanced industrialization and increasing rule enforcement.
Hybrid cooling towers and dry cooling technologies began to be adopted, particularly in water-scarce regions. As sustainability measures and water conservation regulations tighten in the commercial and industrial sectors, hybrid cooling towers will see the largest growth.
Automatic mechanical draught cooling towers remained the most popular choice as the most efficient and lowest cost -of-ownership solution-especially in industrial settings. The adoption of IoT-based smart cooling towers will rise, enabling predictive maintenance, real-time monitoring, and automation, which will help reduce operational expenses.

Macro-Economic Outlook

The global cooling tower rental market's growth is attributed to industrial development, infrastructure growth, climate policy, and technology. Demand is rising as economies recover from the pandemic, manufacturing activity increases, data centers multiply, and environmental regulations tighten. Governments worldwide are mandating carbon reduction targets, water conservation policies, and energy efficiency standards, which lead fields to invest in short-term, high-efficiency chillers.

This is also influencing the development of the market due to the trend towards IoT-enabled smart cooling solutions and green cooling technologies. Emerging markets like India, China, and Southeast Asia are also growing due to urbanization and industrialization. At the same time, supply chain constraints and inflationary pressures may play into pricing trends. Shortages of water and energy, in addition to strict rules on energy efficiency, will drive growth in the long term, in addition to a rising demand for climate-friendly cooling solutions.

Key Players

  • Aggreko
  • Baltimore Aircoil Australia
  • Carrier Rental Systems
  • Caterpillar
  • Cooling Tower Depot
  • Engie Refrigeration
  • ICS Cool Energy
  • Jacir
  • Johnson Controls
  • KTK Kühlturm
  • Enexio Management GmbH
  • Hertz Equipment Rental Corporation
  • Midwest Cooling Towers, Inc.
  • Mobile Air & Power Rentals

Top Segments in Cooling Tower Rental Market Report

By Product Type:

The industry is fragmented into wet cooling towers, dry cooling towers, and hybrid cooling towers.

By Design:

It is segmented into mechanical draft, natural draft, and other Designs.

End User Verticals:

Is fragmented into industrial and commercial uses.

By Region:

The industry is segmented into the North American Market, Latin America Market, Europe Market, East Asia Market, South Asia and Pacific Market, and the Middle East and Africa (MEA) Market.

Table of Content

  1. Executive Summary
  2. Market Overview
  3. Market Background
  4. Global Analysis 2020 to 2024 and Forecast 2025 to 2035
  5. Global Analysis 2020 to 2024 and Forecast 2025 to 2035, By Type
    • Wet
    • Dry
    • Hybrid
  6. Global Analysis 2020 to 2024 and Forecast 2025 to 2035, By Design
    • Mechanical Draft
    • Natural Draft
  7. Global Analysis 2020 to 2024 and Forecast 2025 to 2035, By End-Use
    • Industrial
    • Commercial
  8. Global Analysis 2020 to 2024 and Forecast 2025 to 2035, By Region
    • North America
    • Latin America
    • Europe
    • South Asia
    • East Asia
    • Oceania
    • MEA
  9. North America Analysis 2020 to 2024 and Forecast 2025 to 2035, By Country
  10. Latin America Analysis 2020 to 2024 and Forecast 2025 to 2035, By Country
  11. Europe Analysis 2020 to 2024 and Forecast 2025 to 2035, By Country
  12. South Asia Analysis 2020 to 2024 and Forecast 2025 to 2035, By Country
  13. East Asia Analysis 2020 to 2024 and Forecast 2025 to 2035, By Country
  14. Oceania Analysis 2020 to 2024 and Forecast 2025 to 2035, By Country
  15. MEA Analysis 2020 to 2024 and Forecast 2025 to 2035, By Country
  16. Key Countries Analysis
  17. Market Structure Analysis
  18. Competition Analysis
    • Aggreko
    • Baltimore Aircoil Australia
    • Carrier Rental Systems
    • Caterpillar
    • Cooling Tower Depot
    • Engie Refrigeration
    • ICS Cool Energy
    • Jacir
    • Johnson Controls
    • KTK Kühlturm
    • Enexio Management GmbH
    • Hertz Equipment Rental Corporation
    • Midwest Cooling Towers, Inc.
    • Mobile Air & Power Rentals
  19. Assumptions & Acronyms Used
  20. Research Methodology

List of Tables

Table 1: Global Value (US$ Million) Forecast by Region, 2018 to 2033

Table 2: Global Value (US$ Million) Forecast by Type, 2018 to 2033

Table 3: Global Value (US$ Million) Forecast by Design, 2018 to 2033

Table 4: Global Value (US$ Million) Forecast by End-Use, 2018 to 2033

Table 5: North America Value (US$ Million) Forecast by Country, 2018 to 2033

Table 6: North America Value (US$ Million) Forecast by Type, 2018 to 2033

Table 7: North America Value (US$ Million) Forecast by Design, 2018 to 2033

Table 8: North America Value (US$ Million) Forecast by End-Use, 2018 to 2033

Table 9: Latin America Value (US$ Million) Forecast by Country, 2018 to 2033

Table 10: Latin America Value (US$ Million) Forecast by Type, 2018 to 2033

Table 11: Latin America Value (US$ Million) Forecast by Design, 2018 to 2033

Table 12: Latin America Value (US$ Million) Forecast by End-Use, 2018 to 2033

Table 13: Europe Value (US$ Million) Forecast by Country, 2018 to 2033

Table 14: Europe Value (US$ Million) Forecast by Type, 2018 to 2033

Table 15: Europe Value (US$ Million) Forecast by Design, 2018 to 2033

Table 16: Europe Value (US$ Million) Forecast by End-Use, 2018 to 2033

Table 17: South Asia Value (US$ Million) Forecast by Country, 2018 to 2033

Table 18: South Asia Value (US$ Million) Forecast by Type, 2018 to 2033

Table 19: South Asia Value (US$ Million) Forecast by Design, 2018 to 2033

Table 20: South Asia Value (US$ Million) Forecast by End-Use, 2018 to 2033

Table 21: East Asia Value (US$ Million) Forecast by Country, 2018 to 2033

Table 22: East Asia Value (US$ Million) Forecast by Type, 2018 to 2033

Table 23: East Asia Value (US$ Million) Forecast by Design, 2018 to 2033

Table 24: East Asia Value (US$ Million) Forecast by End-Use, 2018 to 2033

Table 25: Oceania Value (US$ Million) Forecast by Country, 2018 to 2033

Table 26: Oceania Value (US$ Million) Forecast by Type, 2018 to 2033

Table 27: Oceania Value (US$ Million) Forecast by Design, 2018 to 2033

Table 28: Oceania Value (US$ Million) Forecast by End-Use, 2018 to 2033

Table 29: MEA Value (US$ Million) Forecast by Country, 2018 to 2033

Table 30: MEA Value (US$ Million) Forecast by Type, 2018 to 2033

Table 31: MEA Value (US$ Million) Forecast by Design, 2018 to 2033

Table 32: MEA Value (US$ Million) Forecast by End-Use, 2018 to 2033

List of Figures

Figure 1: Global Value (US$ Million) by Type, 2023 to 2033

Figure 2: Global Value (US$ Million) by Design, 2023 to 2033

Figure 3: Global Value (US$ Million) by End-Use, 2023 to 2033

Figure 4: Global Value (US$ Million) by Region, 2023 to 2033

Figure 5: Global Value (US$ Million) Analysis by Region, 2018 to 2033

Figure 6: Global Value Share (%) and BPS Analysis by Region, 2023 to 2033

Figure 7: Global Y-o-Y Growth (%) Projections by Region, 2023 to 2033

Figure 8: Global Value (US$ Million) Analysis by Type, 2018 to 2033

Figure 9: Global Value Share (%) and BPS Analysis by Type, 2023 to 2033

Figure 10: Global Y-o-Y Growth (%) Projections by Type, 2023 to 2033

Figure 11: Global Value (US$ Million) Analysis by Design, 2018 to 2033

Figure 12: Global Value Share (%) and BPS Analysis by Design, 2023 to 2033

Figure 13: Global Y-o-Y Growth (%) Projections by Design, 2023 to 2033

Figure 14: Global Value (US$ Million) Analysis by End-Use, 2018 to 2033

Figure 15: Global Value Share (%) and BPS Analysis by End-Use, 2023 to 2033

Figure 16: Global Y-o-Y Growth (%) Projections by End-Use, 2023 to 2033

Figure 17: Global Attractiveness by Type, 2023 to 2033

Figure 18: Global Attractiveness by Design, 2023 to 2033

Figure 19: Global Attractiveness by End-Use, 2023 to 2033

Figure 20: Global Attractiveness by Region, 2023 to 2033

Figure 21: North America Value (US$ Million) by Type, 2023 to 2033

Figure 22: North America Value (US$ Million) by Design, 2023 to 2033

Figure 23: North America Value (US$ Million) by End-Use, 2023 to 2033

Figure 24: North America Value (US$ Million) by Country, 2023 to 2033

Figure 25: North America Value (US$ Million) Analysis by Country, 2018 to 2033

Figure 26: North America Value Share (%) and BPS Analysis by Country, 2023 to 2033

Figure 27: North America Y-o-Y Growth (%) Projections by Country, 2023 to 2033

Figure 28: North America Value (US$ Million) Analysis by Type, 2018 to 2033

Figure 29: North America Value Share (%) and BPS Analysis by Type, 2023 to 2033

Figure 30: North America Y-o-Y Growth (%) Projections by Type, 2023 to 2033

Figure 31: North America Value (US$ Million) Analysis by Design, 2018 to 2033

Figure 32: North America Value Share (%) and BPS Analysis by Design, 2023 to 2033

Figure 33: North America Y-o-Y Growth (%) Projections by Design, 2023 to 2033

Figure 34: North America Value (US$ Million) Analysis by End-Use, 2018 to 2033

Figure 35: North America Value Share (%) and BPS Analysis by End-Use, 2023 to 2033

Figure 36: North America Y-o-Y Growth (%) Projections by End-Use, 2023 to 2033

Figure 37: North America Attractiveness by Type, 2023 to 2033

Figure 38: North America Attractiveness by Design, 2023 to 2033

Figure 39: North America Attractiveness by End-Use, 2023 to 2033

Figure 40: North America Attractiveness by Country, 2023 to 2033

Figure 41: Latin America Value (US$ Million) by Type, 2023 to 2033

Figure 42: Latin America Value (US$ Million) by Design, 2023 to 2033

Figure 43: Latin America Value (US$ Million) by End-Use, 2023 to 2033

Figure 44: Latin America Value (US$ Million) by Country, 2023 to 2033

Figure 45: Latin America Value (US$ Million) Analysis by Country, 2018 to 2033

Figure 46: Latin America Value Share (%) and BPS Analysis by Country, 2023 to 2033

Figure 47: Latin America Y-o-Y Growth (%) Projections by Country, 2023 to 2033

Figure 48: Latin America Value (US$ Million) Analysis by Type, 2018 to 2033

Figure 49: Latin America Value Share (%) and BPS Analysis by Type, 2023 to 2033

Figure 50: Latin America Y-o-Y Growth (%) Projections by Type, 2023 to 2033

Figure 51: Latin America Value (US$ Million) Analysis by Design, 2018 to 2033

Figure 52: Latin America Value Share (%) and BPS Analysis by Design, 2023 to 2033

Figure 53: Latin America Y-o-Y Growth (%) Projections by Design, 2023 to 2033

Figure 54: Latin America Value (US$ Million) Analysis by End-Use, 2018 to 2033

Figure 55: Latin America Value Share (%) and BPS Analysis by End-Use, 2023 to 2033

Figure 56: Latin America Y-o-Y Growth (%) Projections by End-Use, 2023 to 2033

Figure 57: Latin America Attractiveness by Type, 2023 to 2033

Figure 58: Latin America Attractiveness by Design, 2023 to 2033

Figure 59: Latin America Attractiveness by End-Use, 2023 to 2033

Figure 60: Latin America Attractiveness by Country, 2023 to 2033

Figure 61: Europe Value (US$ Million) by Type, 2023 to 2033

Figure 62: Europe Value (US$ Million) by Design, 2023 to 2033

Figure 63: Europe Value (US$ Million) by End-Use, 2023 to 2033

Figure 64: Europe Value (US$ Million) by Country, 2023 to 2033

Figure 65: Europe Value (US$ Million) Analysis by Country, 2018 to 2033

Figure 66: Europe Value Share (%) and BPS Analysis by Country, 2023 to 2033

Figure 67: Europe Y-o-Y Growth (%) Projections by Country, 2023 to 2033

Figure 68: Europe Value (US$ Million) Analysis by Type, 2018 to 2033

Figure 69: Europe Value Share (%) and BPS Analysis by Type, 2023 to 2033

Figure 70: Europe Y-o-Y Growth (%) Projections by Type, 2023 to 2033

Figure 71: Europe Value (US$ Million) Analysis by Design, 2018 to 2033

Figure 72: Europe Value Share (%) and BPS Analysis by Design, 2023 to 2033

Figure 73: Europe Y-o-Y Growth (%) Projections by Design, 2023 to 2033

Figure 74: Europe Value (US$ Million) Analysis by End-Use, 2018 to 2033

Figure 75: Europe Value Share (%) and BPS Analysis by End-Use, 2023 to 2033

Figure 76: Europe Y-o-Y Growth (%) Projections by End-Use, 2023 to 2033

Figure 77: Europe Attractiveness by Type, 2023 to 2033

Figure 78: Europe Attractiveness by Design, 2023 to 2033

Figure 79: Europe Attractiveness by End-Use, 2023 to 2033

Figure 80: Europe Attractiveness by Country, 2023 to 2033

Figure 81: South Asia Value (US$ Million) by Type, 2023 to 2033

Figure 82: South Asia Value (US$ Million) by Design, 2023 to 2033

Figure 83: South Asia Value (US$ Million) by End-Use, 2023 to 2033

Figure 84: South Asia Value (US$ Million) by Country, 2023 to 2033

Figure 85: South Asia Value (US$ Million) Analysis by Country, 2018 to 2033

Figure 86: South Asia Value Share (%) and BPS Analysis by Country, 2023 to 2033

Figure 87: South Asia Y-o-Y Growth (%) Projections by Country, 2023 to 2033

Figure 88: South Asia Value (US$ Million) Analysis by Type, 2018 to 2033

Figure 89: South Asia Value Share (%) and BPS Analysis by Type, 2023 to 2033

Figure 90: South Asia Y-o-Y Growth (%) Projections by Type, 2023 to 2033

Figure 91: South Asia Value (US$ Million) Analysis by Design, 2018 to 2033

Figure 92: South Asia Value Share (%) and BPS Analysis by Design, 2023 to 2033

Figure 93: South Asia Y-o-Y Growth (%) Projections by Design, 2023 to 2033

Figure 94: South Asia Value (US$ Million) Analysis by End-Use, 2018 to 2033

Figure 95: South Asia Value Share (%) and BPS Analysis by End-Use, 2023 to 2033

Figure 96: South Asia Y-o-Y Growth (%) Projections by End-Use, 2023 to 2033

Figure 97: South Asia Attractiveness by Type, 2023 to 2033

Figure 98: South Asia Attractiveness by Design, 2023 to 2033

Figure 99: South Asia Attractiveness by End-Use, 2023 to 2033

Figure 100: South Asia Attractiveness by Country, 2023 to 2033

Figure 101: East Asia Value (US$ Million) by Type, 2023 to 2033

Figure 102: East Asia Value (US$ Million) by Design, 2023 to 2033

Figure 103: East Asia Value (US$ Million) by End-Use, 2023 to 2033

Figure 104: East Asia Value (US$ Million) by Country, 2023 to 2033

Figure 105: East Asia Value (US$ Million) Analysis by Country, 2018 to 2033

Figure 106: East Asia Value Share (%) and BPS Analysis by Country, 2023 to 2033

Figure 107: East Asia Y-o-Y Growth (%) Projections by Country, 2023 to 2033

Figure 108: East Asia Value (US$ Million) Analysis by Type, 2018 to 2033

Figure 109: East Asia Value Share (%) and BPS Analysis by Type, 2023 to 2033

Figure 110: East Asia Y-o-Y Growth (%) Projections by Type, 2023 to 2033

Figure 111: East Asia Value (US$ Million) Analysis by Design, 2018 to 2033

Figure 112: East Asia Value Share (%) and BPS Analysis by Design, 2023 to 2033

Figure 113: East Asia Y-o-Y Growth (%) Projections by Design, 2023 to 2033

Figure 114: East Asia Value (US$ Million) Analysis by End-Use, 2018 to 2033

Figure 115: East Asia Value Share (%) and BPS Analysis by End-Use, 2023 to 2033

Figure 116: East Asia Y-o-Y Growth (%) Projections by End-Use, 2023 to 2033

Figure 117: East Asia Attractiveness by Type, 2023 to 2033

Figure 118: East Asia Attractiveness by Design, 2023 to 2033

Figure 119: East Asia Attractiveness by End-Use, 2023 to 2033

Figure 120: East Asia Attractiveness by Country, 2023 to 2033

Figure 121: Oceania Value (US$ Million) by Type, 2023 to 2033

Figure 122: Oceania Value (US$ Million) by Design, 2023 to 2033

Figure 123: Oceania Value (US$ Million) by End-Use, 2023 to 2033

Figure 124: Oceania Value (US$ Million) by Country, 2023 to 2033

Figure 125: Oceania Value (US$ Million) Analysis by Country, 2018 to 2033

Figure 126: Oceania Value Share (%) and BPS Analysis by Country, 2023 to 2033

Figure 127: Oceania Y-o-Y Growth (%) Projections by Country, 2023 to 2033

Figure 128: Oceania Value (US$ Million) Analysis by Type, 2018 to 2033

Figure 129: Oceania Value Share (%) and BPS Analysis by Type, 2023 to 2033

Figure 130: Oceania Y-o-Y Growth (%) Projections by Type, 2023 to 2033

Figure 131: Oceania Value (US$ Million) Analysis by Design, 2018 to 2033

Figure 132: Oceania Value Share (%) and BPS Analysis by Design, 2023 to 2033

Figure 133: Oceania Y-o-Y Growth (%) Projections by Design, 2023 to 2033

Figure 134: Oceania Value (US$ Million) Analysis by End-Use, 2018 to 2033

Figure 135: Oceania Value Share (%) and BPS Analysis by End-Use, 2023 to 2033

Figure 136: Oceania Y-o-Y Growth (%) Projections by End-Use, 2023 to 2033

Figure 137: Oceania Attractiveness by Type, 2023 to 2033

Figure 138: Oceania Attractiveness by Design, 2023 to 2033

Figure 139: Oceania Attractiveness by End-Use, 2023 to 2033

Figure 140: Oceania Attractiveness by Country, 2023 to 2033

Figure 141: MEA Value (US$ Million) by Type, 2023 to 2033

Figure 142: MEA Value (US$ Million) by Design, 2023 to 2033

Figure 143: MEA Value (US$ Million) by End-Use, 2023 to 2033

Figure 144: MEA Value (US$ Million) by Country, 2023 to 2033

Figure 145: MEA Value (US$ Million) Analysis by Country, 2018 to 2033

Figure 146: MEA Value Share (%) and BPS Analysis by Country, 2023 to 2033

Figure 147: MEA Y-o-Y Growth (%) Projections by Country, 2023 to 2033

Figure 148: MEA Value (US$ Million) Analysis by Type, 2018 to 2033

Figure 149: MEA Value Share (%) and BPS Analysis by Type, 2023 to 2033

Figure 150: MEA Y-o-Y Growth (%) Projections by Type, 2023 to 2033

Figure 151: MEA Value (US$ Million) Analysis by Design, 2018 to 2033

Figure 152: MEA Value Share (%) and BPS Analysis by Design, 2023 to 2033

Figure 153: MEA Y-o-Y Growth (%) Projections by Design, 2023 to 2033

Figure 154: MEA Value (US$ Million) Analysis by End-Use, 2018 to 2033

Figure 155: MEA Value Share (%) and BPS Analysis by End-Use, 2023 to 2033

Figure 156: MEA Y-o-Y Growth (%) Projections by End-Use, 2023 to 2033

Figure 157: MEA Attractiveness by Type, 2023 to 2033

Figure 158: MEA Attractiveness by Design, 2023 to 2033

Figure 159: MEA Attractiveness by End-Use, 2023 to 2033

Figure 160: MEA Attractiveness by Country, 2023 to 2033

Frequently Asked Questions

What are the reasons companies are choosing to rent cooling towers instead of purchasing them?

Rentals reduce costs, increase flexibility, and allow for immediate deployment for short-term or seasonal cooling applications.

Which industries have the highest demand for cooling tower rentals?

There is a high demand for cooling energy efficiency standards for data centers, power generators, petrochemicals, and manufacturing.

What legal framework governs cooling tower rentals, and in what way?

Sustainable brands are  leaving hybrid and green solutions due to stricter water-use policies and energy efficiency mandates.

What are the new technologies used in cooling tower rentals?

The combination of IoT-based remote monitoring, AI-enabled predictive maintenance, and modular Design is revolutionizing efficiency and reliability.

Where do we observe growth in the cooling tower rentals market segments?

Industrialization and cooling climate needs are driving growth in the Asia-Pacific, Middle East, and Latin America.

Explore Similar Insights

Future Market Insights

Cooling Tower Rental Market