Combined Cooling Heat and Power Plant Market Outlook (2023 to 2033)

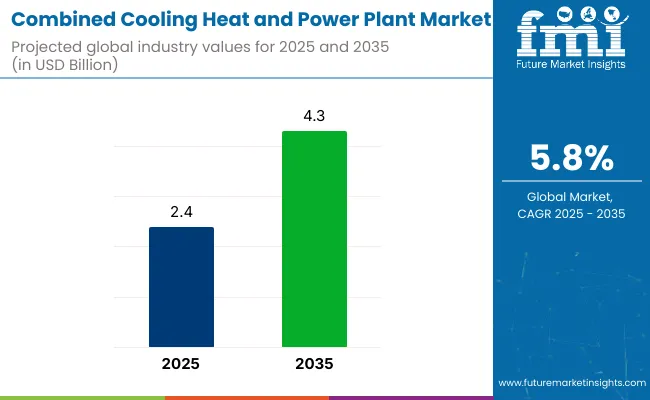
The combined cooling heat and power plant market is on the brink of surpassing the impressive milestone of US$ 2.27 billion by 2023, exhibiting a remarkable CAGR of 5.8% throughout 2033, ultimately reaching a valuation of US$ 4.0 billion by 2033.

The combined cooling heat and power (CHP) plant market is expected to gain traction over the forecast period owing to government regulations regarding the emission of greenhouse gasses and the emergence of new technologies, such as absorption chillers, that efficiently convert heat into cooling.

Cooling heat and power together, also known as trigeneration, is a process in which the heat produced by combined heat and power plants is used to generate cooling energy for refrigerators and air conditioning. It is the most economical and eco-friendly way to generate heat, cooling, and electricity, making it the ideal solution for organizations that have significant cooling requirements.

The important benefits of CCHP include great efficiency, i.e., a single fuel source can generate several forms of energy, such as electrical energy, heat energy, and cooling energy, catering to the rising demand for the same.

Attributes Details
Combined Cooling Heat and Power Plant Market Estimated Value (2023) US$ 2.27 billion
Combined Cooling Heat and Power Plant Market Estimated Value (2033) US$ 4.0 billion
Combined Cooling Heat and Power Plant Market Value CAGR (2023 to 2033) 5.8%

Don't pay for what you don't need

Customize your report by selecting specific countries or regions and save 30%!

A Comparative Outlook: Global Combined Cooling Heat and Power Plant Market from 2018 to 2022 vs. the Thriving Forecast from 2023 to 2033

The global combined cooling heat and power (CHP) plant market has exhibited promising growth over the years. From 2018 to 2022, the market witnessed a steady CAGR of 4.1%. However, the forecast between 2023 and 2033 presents an even thriving outlook, with an anticipated CAGR of 5.8%.

Projected growth is attributed to various factors such as increasing energy demand, rising focus on energy efficiency, and the growing adoption of sustainable and decentralized power generation solutions. Further, the CHP plant market is poised to capitalize on these trends, offering integrated energy solutions that provide simultaneous cooling, heating, and power generation for enhanced operational efficiency and reduced carbon emissions.

Which are Some Prominent Drivers of the CHP Market?

  • Environmental regulations on CO2 emissions act as a significant driver for the growth of the combined cooling heat and power plant market.
  • The inherent efficiency of combined cooling heat and power plants compared to separate electricity and energy generation contributes to the market's growth.
  • Combined cooling heat and power plants offer various benefits, including a substantial reduction in greenhouse gas emissions, lower fuel and energy costs, and decreased electric usage. These advantages further drive the growth of the combined cooling heat and power plant market.
  • The market's expansion is driven by the increasing demand for energy-efficient and environment-friendly solutions in various industries and sectors.

What are the Challenges Faced by the CHP Market?

  • High initial investment and a long recovery period pose significant barriers to the growth of the combined cooling heat and power plant market.
  • Challenges arising from the dynamic and non-coincidental nature of electrical loads and thermal loads in specific applications hinder the market's growth.
  • The integration of developed algorithms into control technology hardware and software creates anxiety and acts as a restraining factor for the growth of the combined cooling heat and power plant market.

Overcoming these challenges is crucial for the market to realize its full potential and drive future growth.

Comparative View of the Combined Cooling Heat and Power Plant Market

Combined Cooling Heat and Power Plant Market:

Attributes Combined Cooling Heat and Power Plant Market
CAGR (2023 to 2033) 5.8%
Market Value (2033) US$ 4.0 billion
Opportunity The rising focus on sustainability and energy efficiency creates a prime opportunity for the combined cooling heat and power plant market to meet the demand for integrated solutions and maximize energy conservation.
Key Trends Decentralization of power generation emerges as a prominent trend in the combined cooling heat and power plant market, facilitating localized energy production and enhancing grid resilience through distributed energy systems.

District Cooling Market:

Attributes District Cooling Market
CAGR (2023 to 2033) 8.0%
Market Value (2033) US$ 29.2 billion
Opportunity The rapid urbanization and increasing demand for sustainable cooling solutions present a key opportunity in the district cooling market, as centralized systems can efficiently meet the growing cooling needs of densely populated areas.
Key Trends The integration of renewable energy sources, such as solar and geothermal energy, is a prominent trend in the district cooling market. This trend aligns with the global focus on clean energy and enhances the sustainability and energy efficiency of district cooling systems.

Ductless Heating & Cooling Systems Market:

Attributes Ductless Heating & Cooling Systems Market
CAGR (2023 to 2033) 8.3%
Market Value (2033) US$ 115.41 billion
Opportunity The key opportunity in the ductless heating & cooling systems market lies in the increasing demand for energy-efficient and flexible HVAC solutions. Ductless systems offer easy installation, zoning capabilities, and reduced energy consumption, providing an opportunity to cater to evolving customer needs.
Key Trends The key trend in the ductless heating & cooling systems market is the adoption of smart and connected technologies. Integration with smart home platforms, advanced sensors, and remote control features enables users to optimize comfort, monitor energy usage, and enhance overall system efficiency.
Nikhil Kaitwade
Nikhil Kaitwade

Principal Consultant

Talk to Analyst

Find your sweet spots for generating winning opportunities in this market.

Country-wise Insights

How is the Rapid Industrialization Creating Key Opportunities for the CHP Market in the United States of America?

The United States of America, being a mature market, is expected to lead in the global CHP market share, over the forecast period. It is expected to witness immense growth in the combined cooling heat and power plant market due to rapid industrialization.

Factors like ongoing power generation projects, technological innovations, investments in large new gas-fired cogeneration plants and large coal-fired plants, along with rising production of electricity are driving the market growth in the country. Thus, due to the reasons mentioned above, the market in the United States of America is likely to possess a 17.0% market share for CHP in 2023.

Is the Demand from Construction Industry Bolstering Demand for CHP in the United Kingdom?

The United Kingdom is a hotspot of technological advancements. With a focus on sustainable and low-carbon solutions, the construction industry in the United Kingdom is increasingly adopting CHP systems to meet its energy needs and contribute to environmental goals.

The market is expected to grow due to rapid industrialization, urbanization, and economic growth in the region, leading to the installation of new CHP systems. Thus, owing to the aforementioned reasons, the market in the United Kingdom is expected to advance at 4.3% CAGR from 2023 to 2033.

Category-wise Insights

What Factors are Expected to Contribute to the Absorption Chiller Sub-segment’s Supremacy in the Market?

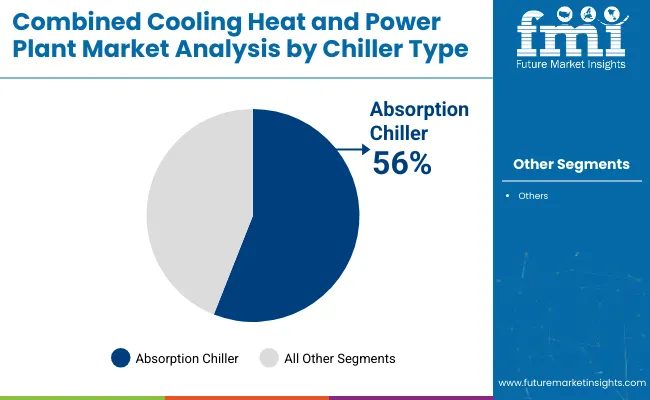
The absorption chiller sub-segment is anticipated to achieve supremacy in the market with a value share of 36.3% in 2023. Firstly, energy efficiency plays a significant role. Chiller absorption systems have proven to be highly efficient in terms of energy utilization compared to traditional chiller systems. Chiller absorption systems utilize waste heat or alternative energy sources, such as natural gas or solar energy, to generate cooling, resulting in reduced energy consumption and low operational costs for end-users.

Secondly, environmental sustainability is a crucial factor driving the dominance of the chiller absorption sub-segment. As organizations and industries increasingly prioritize eco-friendly practices, chiller absorption systems provide a green alternative for cooling needs. Moreover, by utilizing waste heat or renewable energy sources, they significantly reduce greenhouse gas emissions and contribute to a small carbon footprint.

Which Sub-segment is Forecasted to Lead the Market by Application?

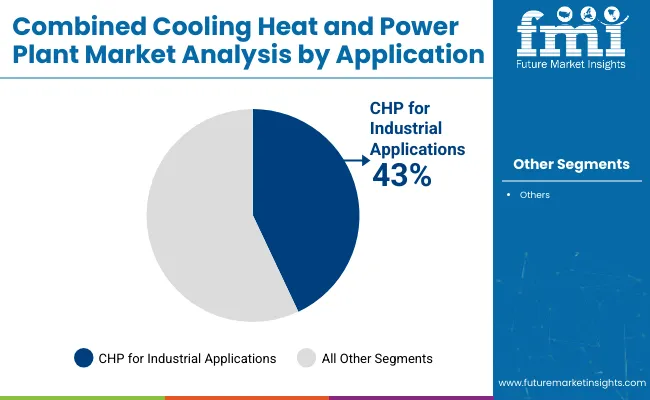
According to the FMI study, the industrial sub-segment is likely to lead the market with a value of 56.0% in 2023. The industrial sector has a substantial cooling demand due to the nature of its operations, which often involve large-scale manufacturing processes, machinery, and equipment.

Industries such as manufacturing, pharmaceuticals, food processing, and chemicals require efficient and reliable cooling systems to maintain optimal operating conditions and preserve product quality. This high cooling demand positions the industrial sub-segment as a significant driver of the market.

Get the data you need at a Fraction of the cost

Personalize your report by choosing insights you need
and save 40%!

How are Booming Start-ups Likely to Hold a Sway over the Market?

Various new startups are entering the market space with their own set of innovations attributed to the presence of a very highly competitive scenario. Let's consider a few examples:

  • ClearCell Power is a United States-based startup that offers turnkey alternative energy solutions. The startup’s PureCell system combines energy production with heat recovery. The fuel processor converts natural gas to hydrogen to feed the fuel cell stack. Further, an electrochemical process combines hydrogen and air to produce electricity, water, and heat. As a result, the solution’s heat recovery system heats water in the facility for different purposes.
  • Enexor Bioenergy is a United States-based startup that provides onsite, renewable energy solutions. The startup’s Bio-CHP system uses organic waste and plastics to provide continuous renewable energy. Furthermore, the solution also directs waste heat to produce hot water or steam, replacing fossil fuel use for onsite boilers. The system is designed to operate in humid and salty environments, typical of island nations.
  • Polish startup Lerta develops diverse renewable energy solutions. The startup installs CHP units for industrial clients, enabling savings in energy costs. Lerta also provides automated energy management and virtual power plants to improve energy efficiency and frequency stability. The startup also offers residential solar power plants to help homeowners offset rising energy prices.

How Intense is the Market Competition?

The CHP market is currently witnessing several strategic collaboration and partnership activities by manufacturers and distribution channels with intense competition.

Key Players Operating in the Global Market

  • GETEC heat & power AG
  • Peter Brotherhood Ltd.
  • Clarke Energy
  • Siemens
  • ABB
  • AGO AG Energie + Anlagen
  • MAN Diesel & Turbo SE
  • M-Trigen
  • O’Hair Shutter Ltd
  • Grastim Energia
  • Biomass Power
  • International Coil Ltd.

Recent Development in the Market:

  • In May 2022, Caterpillar Inc. announced a three-year project with Minnesota-based District Energy St. Paul to demonstrate a hydrogen-fueled combined heat and power (CHP) system. The project is supported and partially funded by the United States Department of Energy and backed by the National Renewable Energy Laboratory.

This hydrogen demonstration project enables the company to evaluate additional hydrogen fuel options for an existing energy-efficient engine, providing many possibilities for helping our customers meet their climate-related goals and objectives.

CHP systems from Caterpillar provide both electricity and heat simultaneously, increasing overall efficiency and reducing exhaust emissions. To assess the potential of a hydrogen-fueled CHP system under real-world operating conditions, power and heat from the demonstration project integrate into District Energy St. Paul’s electrical and thermal infrastructure.

Segmentation Analysis

By System Type:

  • Smaller CHP System (less than 5 MW)
  • Medium CHP System (5 MW to 20 MW)
  • Large CHP System (above 20 MW)

By Technology:

  • CHP Reciprocating Engines
  • CHP Turbines
  • CHP Fuel Cells

By Chiller Type:

  • Absorption Chiller
  • Engine Drive Chiller

By Application:

  • CHP for Industrial Applications
  • CHP for Commercial Applications
  • CHP for Institutional Applications

By Region:

  • North America
  • Latin America
  • Europe
  • Asia Pacific
  • The Middle East & Africa

Frequently Asked Questions

What is the Market's Potential for Growth?

The market is expected to thrive at a 5.8% CAGR through 2033.

What is the Current Market Value?

In 2023, the market is predicted to be worth US$ 2.27 billion.

What is the Estimated Market Size By 2033?

By 2033, the market is estimated to attain US$ 4 billion.

What is the Market CAGR in the United Kingdom?

From 2023 to 2033, the market in the United Kingdom to develop at a 4.3% CAGR.

What is the United States' Market Share?

The market share to be held by the United States, which is going to account for 17%.

How Has the Market Performed Historically?

The market surged at a 4.1% CAGR from 2018 to 2022.

Which is the Market's Leading Segment by Chiller Type?

The absorption chiller sub-segment may take precedence the market with a 36.3% value share.

Table of Content
1. Executive Summary

    1.1. Global Market Outlook

    1.2. Demand-side Trends

    1.3. Supply-side Trends

    1.4. Technology Roadmap Analysis

    1.5. Analysis and Recommendations

2. Market Overview

    2.1. Market Coverage / Taxonomy

    2.2. Market Definition / Scope / Limitations

3. Market Background

    3.1. Market Dynamics

        3.1.1. Drivers

        3.1.2. Restraints

        3.1.3. Opportunity

        3.1.4. Trends

    3.2. Scenario Forecast

        3.2.1. Demand in Optimistic Scenario

        3.2.2. Demand in Likely Scenario

        3.2.3. Demand in Conservative Scenario

    3.3. Opportunity Map Analysis

    3.4. Product Life Cycle Analysis

    3.5. Supply Chain Analysis

        3.5.1. Supply Side Participants and their Roles

            3.5.1.1. Producers

            3.5.1.2. Mid-Level Participants (Traders/ Agents/ Brokers)

            3.5.1.3. Wholesalers and Distributors

        3.5.2. Value Added and Value Created at Node in the Supply Chain

        3.5.3. List of Raw Material Suppliers

        3.5.4. List of Existing and Potential Buyer’s

    3.6. Investment Feasibility Matrix

    3.7. Value Chain Analysis

        3.7.1. Profit Margin Analysis

        3.7.2. Wholesalers and Distributors

        3.7.3. Retailers

    3.8. PESTLE and Porter’s Analysis

    3.9. Regulatory Landscape

        3.9.1. By Key Regions

        3.9.2. By Key Countries

    3.10. Regional Parent Market Outlook

    3.11. Production and Consumption Statistics

    3.12. Import and Export Statistics

4. Global Market Analysis 2018 to 2022 and Forecast, 2023 to 2033

    4.1. Historical Market Size Value (US$ Million) & Volume (Units) Analysis, 2018 to 2022

    4.2. Current and Future Market Size Value (US$ Million) & Volume (Units) Projections, 2023 to 2033

        4.2.1. Y-o-Y Growth Trend Analysis

        4.2.2. Absolute $ Opportunity Analysis

5. Global Market Analysis 2018 to 2022 and Forecast 2023 to 2033, By System Type

    5.1. Introduction / Key Findings

    5.2. Historical Market Size Value (US$ Million) & Volume (Units) Analysis By System Type, 2018 to 2022

    5.3. Current and Future Market Size Value (US$ Million) & Volume (Units) Analysis and Forecast By System Type, 2023 to 2033

        5.3.1. Smaller System (less than 5 MW)

        5.3.2. Medium System (5 MW to 20 MW)

        5.3.3. Large System (above 20 MW)

    5.4. Y-o-Y Growth Trend Analysis By System Type, 2018 to 2022

    5.5. Absolute $ Opportunity Analysis By System Type, 2023 to 2033

6. Global Market Analysis 2018 to 2022 and Forecast 2023 to 2033, By Technology

    6.1. Introduction / Key Findings

    6.2. Historical Market Size Value (US$ Million) & Volume (Units) Analysis By Technology, 2018 to 2022

    6.3. Current and Future Market Size Value (US$ Million) & Volume (Units) Analysis and Forecast By Technology, 2023 to 2033

        6.3.1. Reciprocating Engines

        6.3.2. Turbines

        6.3.3. Fuel Cells

    6.4. Y-o-Y Growth Trend Analysis By Technology, 2018 to 2022

    6.5. Absolute $ Opportunity Analysis By Technology, 2023 to 2033

7. Global Market Analysis 2018 to 2022 and Forecast 2023 to 2033, By Chiller Type

    7.1. Introduction / Key Findings

    7.2. Historical Market Size Value (US$ Million) & Volume (Units) Analysis By Chiller Type, 2018 to 2022

    7.3. Current and Future Market Size Value (US$ Million) & Volume (Units) Analysis and Forecast By Chiller Type, 2023 to 2033

        7.3.1. Absorption Chiller

        7.3.2. Engine Drive Chiller

    7.4. Y-o-Y Growth Trend Analysis By Chiller Type, 2018 to 2022

    7.5. Absolute $ Opportunity Analysis By Chiller Type, 2023 to 2033

8. Global Market Analysis 2018 to 2022 and Forecast 2023 to 2033, By Application

    8.1. Introduction / Key Findings

    8.2. Historical Market Size Value (US$ Million) & Volume (Units) Analysis By Application, 2018 to 2022

    8.3. Current and Future Market Size Value (US$ Million) & Volume (Units) Analysis and Forecast By Application, 2023 to 2033

        8.3.1. Industrial

        8.3.2. Commercial

        8.3.3. Institutional

    8.4. Y-o-Y Growth Trend Analysis By Application, 2018 to 2022

    8.5. Absolute $ Opportunity Analysis By Application, 2023 to 2033

9. Global Market Analysis 2018 to 2022 and Forecast 2023 to 2033, By Region

    9.1. Introduction

    9.2. Historical Market Size Value (US$ Million) & Volume (Units) Analysis By Region, 2018 to 2022

    9.3. Current Market Size Value (US$ Million) & Volume (Units) Analysis and Forecast By Region, 2023 to 2033

        9.3.1. North America

        9.3.2. Latin America

        9.3.3. Western Europe

        9.3.4. Eastern Europe

        9.3.5. South Asia and Pacific

        9.3.6. East Asia

        9.3.7. Middle East and Africa

    9.4. Market Attractiveness Analysis By Region

10. North America Market Analysis 2018 to 2022 and Forecast 2023 to 2033, By Country

    10.1. Historical Market Size Value (US$ Million) & Volume (Units) Trend Analysis By Market Taxonomy, 2018 to 2022

    10.2. Market Size Value (US$ Million) & Volume (Units) Forecast By Market Taxonomy, 2023 to 2033

        10.2.1. By Country

            10.2.1.1. U.S.

            10.2.1.2. Canada

        10.2.2. By System Type

        10.2.3. By Technology

        10.2.4. By Chiller Type

        10.2.5. By Application

    10.3. Market Attractiveness Analysis

        10.3.1. By Country

        10.3.2. By System Type

        10.3.3. By Technology

        10.3.4. By Chiller Type

        10.3.5. By Application

    10.4. Key Takeaways

11. Latin America Market Analysis 2018 to 2022 and Forecast 2023 to 2033, By Country

    11.1. Historical Market Size Value (US$ Million) & Volume (Units) Trend Analysis By Market Taxonomy, 2018 to 2022

    11.2. Market Size Value (US$ Million) & Volume (Units) Forecast By Market Taxonomy, 2023 to 2033

        11.2.1. By Country

            11.2.1.1. Brazil

            11.2.1.2. Mexico

            11.2.1.3. Rest of Latin America

        11.2.2. By System Type

        11.2.3. By Technology

        11.2.4. By Chiller Type

        11.2.5. By Application

    11.3. Market Attractiveness Analysis

        11.3.1. By Country

        11.3.2. By System Type

        11.3.3. By Technology

        11.3.4. By Chiller Type

        11.3.5. By Application

    11.4. Key Takeaways

12. Western Europe Market Analysis 2018 to 2022 and Forecast 2023 to 2033, By Country

    12.1. Historical Market Size Value (US$ Million) & Volume (Units) Trend Analysis By Market Taxonomy, 2018 to 2022

    12.2. Market Size Value (US$ Million) & Volume (Units) Forecast By Market Taxonomy, 2023 to 2033

        12.2.1. By Country

            12.2.1.1. Germany

            12.2.1.2. U.K.

            12.2.1.3. France

            12.2.1.4. Spain

            12.2.1.5. Italy

            12.2.1.6. Rest of Western Europe

        12.2.2. By System Type

        12.2.3. By Technology

        12.2.4. By Chiller Type

        12.2.5. By Application

    12.3. Market Attractiveness Analysis

        12.3.1. By Country

        12.3.2. By System Type

        12.3.3. By Technology

        12.3.4. By Chiller Type

        12.3.5. By Application

    12.4. Key Takeaways

13. Eastern Europe Market Analysis 2018 to 2022 and Forecast 2023 to 2033, By Country

    13.1. Historical Market Size Value (US$ Million) & Volume (Units) Trend Analysis By Market Taxonomy, 2018 to 2022

    13.2. Market Size Value (US$ Million) & Volume (Units) Forecast By Market Taxonomy, 2023 to 2033

        13.2.1. By Country

            13.2.1.1. Poland

            13.2.1.2. Russia

            13.2.1.3. Czech Republic

            13.2.1.4. Romania

            13.2.1.5. Rest of Eastern Europe

        13.2.2. By System Type

        13.2.3. By Technology

        13.2.4. By Chiller Type

        13.2.5. By Application

    13.3. Market Attractiveness Analysis

        13.3.1. By Country

        13.3.2. By System Type

        13.3.3. By Technology

        13.3.4. By Chiller Type

        13.3.5. By Application

    13.4. Key Takeaways

14. South Asia and Pacific Market Analysis 2018 to 2022 and Forecast 2023 to 2033, By Country

    14.1. Historical Market Size Value (US$ Million) & Volume (Units) Trend Analysis By Market Taxonomy, 2018 to 2022

    14.2. Market Size Value (US$ Million) & Volume (Units) Forecast By Market Taxonomy, 2023 to 2033

        14.2.1. By Country

            14.2.1.1. India

            14.2.1.2. Bangladesh

            14.2.1.3. Australia

            14.2.1.4. New Zealand

            14.2.1.5. Rest of South Asia and Pacific

        14.2.2. By System Type

        14.2.3. By Technology

        14.2.4. By Chiller Type

        14.2.5. By Application

    14.3. Market Attractiveness Analysis

        14.3.1. By Country

        14.3.2. By System Type

        14.3.3. By Technology

        14.3.4. By Chiller Type

        14.3.5. By Application

    14.4. Key Takeaways

15. East Asia Market Analysis 2018 to 2022 and Forecast 2023 to 2033, By Country

    15.1. Historical Market Size Value (US$ Million) & Volume (Units) Trend Analysis By Market Taxonomy, 2018 to 2022

    15.2. Market Size Value (US$ Million) & Volume (Units) Forecast By Market Taxonomy, 2023 to 2033

        15.2.1. By Country

            15.2.1.1. China

            15.2.1.2. Japan

            15.2.1.3. South Korea

        15.2.2. By System Type

        15.2.3. By Technology

        15.2.4. By Chiller Type

        15.2.5. By Application

    15.3. Market Attractiveness Analysis

        15.3.1. By Country

        15.3.2. By System Type

        15.3.3. By Technology

        15.3.4. By Chiller Type

        15.3.5. By Application

    15.4. Key Takeaways

16. Middle East and Africa Market Analysis 2018 to 2022 and Forecast 2023 to 2033, By Country

    16.1. Historical Market Size Value (US$ Million) & Volume (Units) Trend Analysis By Market Taxonomy, 2018 to 2022

    16.2. Market Size Value (US$ Million) & Volume (Units) Forecast By Market Taxonomy, 2023 to 2033

        16.2.1. By Country

            16.2.1.1. GCC Countries

            16.2.1.2. South Africa

            16.2.1.3. Israel

            16.2.1.4. Rest of MEA

        16.2.2. By System Type

        16.2.3. By Technology

        16.2.4. By Chiller Type

        16.2.5. By Application

    16.3. Market Attractiveness Analysis

        16.3.1. By Country

        16.3.2. By System Type

        16.3.3. By Technology

        16.3.4. By Chiller Type

        16.3.5. By Application

    16.4. Key Takeaways

17. Key Countries Market Analysis

    17.1. U.S.

        17.1.1. Pricing Analysis

        17.1.2. Market Share Analysis, 2022

            17.1.2.1. By System Type

            17.1.2.2. By Technology

            17.1.2.3. By Chiller Type

            17.1.2.4. By Application

    17.2. Canada

        17.2.1. Pricing Analysis

        17.2.2. Market Share Analysis, 2022

            17.2.2.1. By System Type

            17.2.2.2. By Technology

            17.2.2.3. By Chiller Type

            17.2.2.4. By Application

    17.3. Brazil

        17.3.1. Pricing Analysis

        17.3.2. Market Share Analysis, 2022

            17.3.2.1. By System Type

            17.3.2.2. By Technology

            17.3.2.3. By Chiller Type

            17.3.2.4. By Application

    17.4. Mexico

        17.4.1. Pricing Analysis

        17.4.2. Market Share Analysis, 2022

            17.4.2.1. By System Type

            17.4.2.2. By Technology

            17.4.2.3. By Chiller Type

            17.4.2.4. By Application

    17.5. Germany

        17.5.1. Pricing Analysis

        17.5.2. Market Share Analysis, 2022

            17.5.2.1. By System Type

            17.5.2.2. By Technology

            17.5.2.3. By Chiller Type

            17.5.2.4. By Application

    17.6. U.K.

        17.6.1. Pricing Analysis

        17.6.2. Market Share Analysis, 2022

            17.6.2.1. By System Type

            17.6.2.2. By Technology

            17.6.2.3. By Chiller Type

            17.6.2.4. By Application

    17.7. France

        17.7.1. Pricing Analysis

        17.7.2. Market Share Analysis, 2022

            17.7.2.1. By System Type

            17.7.2.2. By Technology

            17.7.2.3. By Chiller Type

            17.7.2.4. By Application

    17.8. Spain

        17.8.1. Pricing Analysis

        17.8.2. Market Share Analysis, 2022

            17.8.2.1. By System Type

            17.8.2.2. By Technology

            17.8.2.3. By Chiller Type

            17.8.2.4. By Application

    17.9. Italy

        17.9.1. Pricing Analysis

        17.9.2. Market Share Analysis, 2022

            17.9.2.1. By System Type

            17.9.2.2. By Technology

            17.9.2.3. By Chiller Type

            17.9.2.4. By Application

    17.10. Poland

        17.10.1. Pricing Analysis

        17.10.2. Market Share Analysis, 2022

            17.10.2.1. By System Type

            17.10.2.2. By Technology

            17.10.2.3. By Chiller Type

            17.10.2.4. By Application

    17.11. Russia

        17.11.1. Pricing Analysis

        17.11.2. Market Share Analysis, 2022

            17.11.2.1. By System Type

            17.11.2.2. By Technology

            17.11.2.3. By Chiller Type

            17.11.2.4. By Application

    17.12. Czech Republic

        17.12.1. Pricing Analysis

        17.12.2. Market Share Analysis, 2022

            17.12.2.1. By System Type

            17.12.2.2. By Technology

            17.12.2.3. By Chiller Type

            17.12.2.4. By Application

    17.13. Romania

        17.13.1. Pricing Analysis

        17.13.2. Market Share Analysis, 2022

            17.13.2.1. By System Type

            17.13.2.2. By Technology

            17.13.2.3. By Chiller Type

            17.13.2.4. By Application

    17.14. India

        17.14.1. Pricing Analysis

        17.14.2. Market Share Analysis, 2022

            17.14.2.1. By System Type

            17.14.2.2. By Technology

            17.14.2.3. By Chiller Type

            17.14.2.4. By Application

    17.15. Bangladesh

        17.15.1. Pricing Analysis

        17.15.2. Market Share Analysis, 2022

            17.15.2.1. By System Type

            17.15.2.2. By Technology

            17.15.2.3. By Chiller Type

            17.15.2.4. By Application

    17.16. Australia

        17.16.1. Pricing Analysis

        17.16.2. Market Share Analysis, 2022

            17.16.2.1. By System Type

            17.16.2.2. By Technology

            17.16.2.3. By Chiller Type

            17.16.2.4. By Application

    17.17. New Zealand

        17.17.1. Pricing Analysis

        17.17.2. Market Share Analysis, 2022

            17.17.2.1. By System Type

            17.17.2.2. By Technology

            17.17.2.3. By Chiller Type

            17.17.2.4. By Application

    17.18. China

        17.18.1. Pricing Analysis

        17.18.2. Market Share Analysis, 2022

            17.18.2.1. By System Type

            17.18.2.2. By Technology

            17.18.2.3. By Chiller Type

            17.18.2.4. By Application

    17.19. Japan

        17.19.1. Pricing Analysis

        17.19.2. Market Share Analysis, 2022

            17.19.2.1. By System Type

            17.19.2.2. By Technology

            17.19.2.3. By Chiller Type

            17.19.2.4. By Application

    17.20. South Korea

        17.20.1. Pricing Analysis

        17.20.2. Market Share Analysis, 2022

            17.20.2.1. By System Type

            17.20.2.2. By Technology

            17.20.2.3. By Chiller Type

            17.20.2.4. By Application

    17.21. GCC Countries

        17.21.1. Pricing Analysis

        17.21.2. Market Share Analysis, 2022

            17.21.2.1. By System Type

            17.21.2.2. By Technology

            17.21.2.3. By Chiller Type

            17.21.2.4. By Application

    17.22. South Africa

        17.22.1. Pricing Analysis

        17.22.2. Market Share Analysis, 2022

            17.22.2.1. By System Type

            17.22.2.2. By Technology

            17.22.2.3. By Chiller Type

            17.22.2.4. By Application

    17.23. Israel

        17.23.1. Pricing Analysis

        17.23.2. Market Share Analysis, 2022

            17.23.2.1. By System Type

            17.23.2.2. By Technology

            17.23.2.3. By Chiller Type

            17.23.2.4. By Application

18. Market Structure Analysis

    18.1. Competition Dashboard

    18.2. Competition Benchmarking

    18.3. Market Share Analysis of Top Players

        18.3.1. By Regional

        18.3.2. By System Type

        18.3.3. By Technology

        18.3.4. By Chiller Type

        18.3.5. By Application

19. Competition Analysis

    19.1. Competition Deep Dive

        19.1.1. GETEC heat & power AG

            19.1.1.1. Overview

            19.1.1.2. Product Portfolio

            19.1.1.3. Profitability by Market Segments

            19.1.1.4. Sales Footprint

            19.1.1.5. Strategy Overview

                19.1.1.5.1. Marketing Strategy

                19.1.1.5.2. Product Strategy

                19.1.1.5.3. Channel Strategy

        19.1.2. Peter Brotherhood Ltd.

            19.1.2.1. Overview

            19.1.2.2. Product Portfolio

            19.1.2.3. Profitability by Market Segments

            19.1.2.4. Sales Footprint

            19.1.2.5. Strategy Overview

                19.1.2.5.1. Marketing Strategy

                19.1.2.5.2. Product Strategy

                19.1.2.5.3. Channel Strategy

        19.1.3. Clarke Energy

            19.1.3.1. Overview

            19.1.3.2. Product Portfolio

            19.1.3.3. Profitability by Market Segments

            19.1.3.4. Sales Footprint

            19.1.3.5. Strategy Overview

                19.1.3.5.1. Marketing Strategy

                19.1.3.5.2. Product Strategy

                19.1.3.5.3. Channel Strategy

        19.1.4. Siemens

            19.1.4.1. Overview

            19.1.4.2. Product Portfolio

            19.1.4.3. Profitability by Market Segments

            19.1.4.4. Sales Footprint

            19.1.4.5. Strategy Overview

                19.1.4.5.1. Marketing Strategy

                19.1.4.5.2. Product Strategy

                19.1.4.5.3. Channel Strategy

        19.1.5. ABB

            19.1.5.1. Overview

            19.1.5.2. Product Portfolio

            19.1.5.3. Profitability by Market Segments

            19.1.5.4. Sales Footprint

            19.1.5.5. Strategy Overview

                19.1.5.5.1. Marketing Strategy

                19.1.5.5.2. Product Strategy

                19.1.5.5.3. Channel Strategy

        19.1.6. AGO AG Energie + Anlagen

            19.1.6.1. Overview

            19.1.6.2. Product Portfolio

            19.1.6.3. Profitability by Market Segments

            19.1.6.4. Sales Footprint

            19.1.6.5. Strategy Overview

                19.1.6.5.1. Marketing Strategy

                19.1.6.5.2. Product Strategy

                19.1.6.5.3. Channel Strategy

        19.1.7. MAN Diesel & Turbo SE

            19.1.7.1. Overview

            19.1.7.2. Product Portfolio

            19.1.7.3. Profitability by Market Segments

            19.1.7.4. Sales Footprint

            19.1.7.5. Strategy Overview

                19.1.7.5.1. Marketing Strategy

                19.1.7.5.2. Product Strategy

                19.1.7.5.3. Channel Strategy

        19.1.8. M-Trigen

            19.1.8.1. Overview

            19.1.8.2. Product Portfolio

            19.1.8.3. Profitability by Market Segments

            19.1.8.4. Sales Footprint

            19.1.8.5. Strategy Overview

                19.1.8.5.1. Marketing Strategy

                19.1.8.5.2. Product Strategy

                19.1.8.5.3. Channel Strategy

        19.1.9. O’Hair Shutter Ltd

            19.1.9.1. Overview

            19.1.9.2. Product Portfolio

            19.1.9.3. Profitability by Market Segments

            19.1.9.4. Sales Footprint

            19.1.9.5. Strategy Overview

                19.1.9.5.1. Marketing Strategy

                19.1.9.5.2. Product Strategy

                19.1.9.5.3. Channel Strategy

        19.1.10. Grastim Energia

            19.1.10.1. Overview

            19.1.10.2. Product Portfolio

            19.1.10.3. Profitability by Market Segments

            19.1.10.4. Sales Footprint

            19.1.10.5. Strategy Overview

                19.1.10.5.1. Marketing Strategy

                19.1.10.5.2. Product Strategy

                19.1.10.5.3. Channel Strategy

        19.1.11. Biomass Power

            19.1.11.1. Overview

            19.1.11.2. Product Portfolio

            19.1.11.3. Profitability by Market Segments

            19.1.11.4. Sales Footprint

            19.1.11.5. Strategy Overview

                19.1.11.5.1. Marketing Strategy

                19.1.11.5.2. Product Strategy

                19.1.11.5.3. Channel Strategy

        19.1.12. International Coil Ltd.

            19.1.12.1. Overview

            19.1.12.2. Product Portfolio

            19.1.12.3. Profitability by Market Segments

            19.1.12.4. Sales Footprint

            19.1.12.5. Strategy Overview

                19.1.12.5.1. Marketing Strategy

                19.1.12.5.2. Product Strategy

                19.1.12.5.3. Channel Strategy

20. Assumptions & Acronyms Used

21. Research Methodology
Recommendations

Industrial Automation

District Cooling Market

February 2022

REP-GB-14274

January 2023

318 pages

Industrial Automation

Ductless Heating & Cooling Systems Market

February 2022

REP-GB-14280

October 2022

309 pages

Explore Industrial Automation Insights

View Reports
Future Market Insights

Combined Cooling Heat and Power Plant Market