Reports

- Global Locations -

Headquarters

Future Market Insights, Inc.

Christiana Corporate, 200
Continental Drive, Suite 401,
Newark, Delaware - 19713,
United States

T: +1-347-918-3531

Americas

Future Market Insights, Inc.

616 Corporate Way, Suite 2-9018,
Valley Cottage, NY 10989, United States

MEA

Future Market Insights

1602-6 Jumeirah Bay X2 Tower, Plot No: JLT-PH2-X2A,
Jumeirah Lakes Towers, Dubai,
United Arab Emirates

Europe

Future Market Insights

3rd Floor, 207 Regent Street,
W1B 3HH London
United Kingdom

T: + 44 (0) 20 8123 9659

Asia Pacific

Future Market Insights

IndiaLand Global Tech Park, Unit UG-1, Behind Grand HighStreet, Phase 1, Hinjawadi, MH, Pune – 411057, India

Critical Power and Cooling Market Outlook from 2024 to 2034

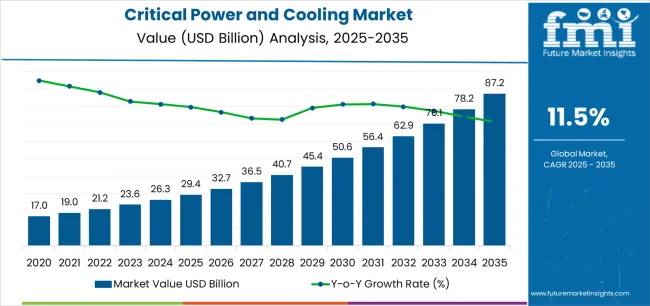
The critical power and cooling market is estimated to be valued at US$ 26.2 billion in 2024. The critical power and cooling is predicted to rise at a CAGR of 12.1% from 2024 to 2034. The global critical power and cooling market is anticipated to reach US$ 82 billion by 2034.

The critical power and cooling market is witnessing robust growth globally as organizations across various industries prioritize the resilience and efficiency of their infrastructure. This market encompasses a range of solutions designed to ensure uninterrupted power supply and optimal temperature control for critical operations, particularly in data centers and industrial settings.

Globally, diverse countries and industries are in the midst of digital transformations. This transition towards digitalization is propelling the need for dependable and adaptable critical power and cooling solutions.

With the proliferation of digital services, cloud computing, and big data analytics has spurred an exponential increase in the number and scale of data centers. As organizations increasingly rely on these data-centric technologies, the demand for robust critical power and cooling solutions has surged.

Attributes Key Insights
Estimated Market Size in 2024 US$ 26.2 billion
Projected Market Value in 2034 US$ 82 billion
Value-based CAGR from 2024 to 2034 12.1%

Don't pay for what you don't need

Customize your report by selecting specific countries or regions and save 30%!

2019 to 2023 Historical Analysis vs. 2024 to 2034 Market Forecast Projections

From 2019 to 2023, the critical power and cooling market experienced a CAGR of 15.2%. The global shift toward digitalization is a driving force behind the demand for reliable and scalable critical power and cooling solutions. This transformation is evident across various countries and industries, necessitating infrastructure that can adapt to evolving technological needs.

The growth of the Internet of Things (IoT) and the expansion of 5G networks further contribute to the demand for facilities that can handle the processing and storage requirements of interconnected technologies.

The organizations opting for critical power and cooling systems that prioritize energy efficiency not only aligns with sustainability objectives but also delivers significant and enduring cost savings over the long term. Projections indicate that the global critical power and cooling market is expected to experience a CAGR of 12.1% from 2024 to 2034.

Historical CAGR from 2019 to 2023 15.2%
Forecast CAGR from 2024 to 2034 12.1%

Critical Power and Cooling Market Growth Driver

  • The proliferation of digital services, cloud computing, and big data analytics has led to a significant increase in the number and size of data centers.
  • As these data centers expand, the demand for robust critical power and cooling solutions grows to ensure uninterrupted operations and prevent data loss.
  • Investments in servers, storage systems, and networking equipment, driving the need for efficient power and cooling solutions.
  • The increasing reliance on digital processes and data-driven decision-making has elevated the cost of downtime for businesses.
  • With a growing awareness of environmental sustainability and a desire to reduce operating costs, organizations are increasingly prioritizing energy-efficient solutions.
  • Ongoing advancements in critical power and cooling technologies, including more efficient UPS systems, precision cooling solutions, and intelligent management systems, are driving market growth.
Nikhil Kaitwade
Nikhil Kaitwade

Principal Consultant

Talk to Analyst

Find your sweet spots for generating winning opportunities in this market.

Critical Power and Cooling Market Key Challenges

  • The increasing demand for energy-efficient solutions and the growing emphasis on environmental sustainability pose challenges for the critical power and cooling market.
  • The high initial costs can be a barrier for some organizations, especially smaller businesses or those operating on tight budgets.
  • Ensuring robust cybersecurity measures to protect against unauthorized access and potential disruptions is a significant challenge.
  • Compliance with regional and international standards adds another layer of challenge for companies operating in the critical power and cooling market.

Comparative View of Adjacent Markets

Future Market Insights has compared three markets, namely combined cooling heat and power plant market and the modular uninterrupted power supplies (UPS) market

The modular uninterrupted power supplies (ups) market is driven by the increasing demand for scalable and adaptable power solutions. The combined cooling, heat, and power plant market experiences growth propelled by its ability to deliver significant benefits, including substantial reductions in greenhouse gas emissions, cost savings in fuel and energy, and decreased electric usage.

Critical Power and Cooling Market:

Attributes Critical Power and Cooling Market
CAGR from 2024 to 2034 12.1%
Key Trends
  • Increasing demand for edge computing solutions
Growth Factor

Combined Cooling Heat and Power Plant Market:

Attributes Combined Cooling Heat and Power Plant Market
CAGR from 2023 to 2033 5.8%
Key Trends
  • The rising focus on sustainability and energy efficiency creates a prime opportunity for the combined cooling heat and power plant market to meet the demand for integrated solutions and maximize energy conservation.
Opportunities
  • The shift towards decentralized power generation signifies a move towards more localized and self-sustaining energy solutions, contributing to enhanced efficiency and resilience within the overall energy infrastructure.

Modular Uninterrupted Power Supplies (UPS) Market:

Attributes Modular Uninterrupted Power Supplies (UPS) Market
CAGR from 2022 to 2032 10.3%
Key Trends
  • Escalating demand for scalable and flexible power solutions, driven by the evolving needs of data centers, cloud computing, and colocation facilities.
Growth Factor
  • Increasing demand for scalable and reliable power systems, alongside the rising need for hyper-scale data centers, widespread cloud utilization, and large colocation facilities.Top of Form

Get the data you need at a Fraction of the cost

Personalize your report by choosing insights you need
and save 40%!

Country-wise Analysis

The provided table highlights the top five countries in terms of revenue, with South Korea and the United Kingdom leading the list. The growing dependence on digital services, cloud computing, and data-intensive applications is driving the demand for resilient critical power and cooling infrastructure in the United Kingdom.

As a prominent participant in the global technology and manufacturing arena, South Korea necessitates resilient critical power and cooling infrastructure to facilitate seamless international connectivity and data exchange.

Countries Forecast CAGRs from 2024 to 2034
The United States 12.4%
The United Kingdom 13.5%
China 13.1%
Japan 10.9%
South Korea 14.6%

Data Centre Expansion Drive Market Growth in United States

The critical power and cooling market in the United States is expected to grow with a CAGR of 12.4% from 2024 to 2034. The United States is home to a significant number of data centers, driven by the growth of cloud services, big data analytics, and digital transformation initiatives across various industries.

As businesses and organizations expand their digital infrastructure, the need for reliable critical power and cooling solutions in data centers increases in the country.

Businesses in the United States continue to invest in upgrading and expanding their IT infrastructure to support evolving technologies, such as edge computing, artificial intelligence, and the Internet of Things (IoT). This ongoing investment fuels the demand for robust power and cooling systems.

Renewable Energy Integration Boost Market Growth in United Kingdom

The critical power and cooling market in the United Kingdom is expected to grow with a CAGR of 13.5% from 2024 to 2034. The United Kingdom has a thriving data center industry, serving diverse sectors such as finance, telecommunications, and healthcare.

The increasing demand for data storage, cloud services, and digital transformation fuels the need for reliable critical power and cooling infrastructure in United Kingdom.

The integration of renewable energy into the power grid and data center operations requires advanced critical power solutions to maintain reliability and stability. The United Kingdom has stringent regulations regarding energy efficiency, carbon emissions, and environmental sustainability. Compliance with these regulations encourages the adoption of energy-efficient critical power and cooling technologies.

Rapid Industrial Growth Drives Market in China

The critical power and cooling market in the United States is expected to grow with a CAGR of 13.1% from 2024 to 2034. China has witnessed significant growth in data center construction, driven by the increasing adoption of cloud services, big data analytics, and digital transformation initiatives. The demand for reliable critical power and cooling solutions is closely tied to the expansion of data center infrastructure.

China's continuous industrialization and economic development contribute to increased demand for critical power and cooling solutions in various sectors, including manufacturing, healthcare, and finance. Robust infrastructure is crucial for supporting these industries' expanding IT requirements.

Government support for technological innovation, infrastructure development, and the digital economy further fuels the demand for critical power and cooling solutions. National initiatives and policies may incentivize businesses to invest in advanced infrastructure for energy efficiency and sustainability.
Advanced Technology Adoption to Drive Market Demand in Japan

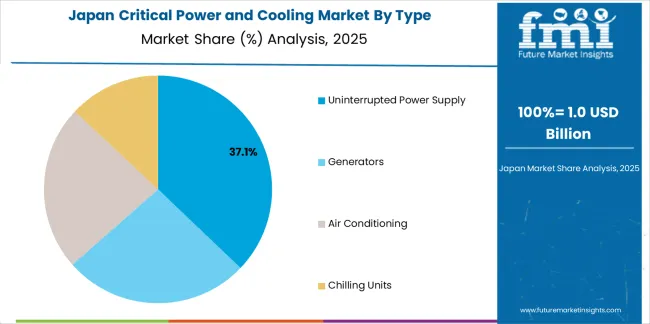
The critical power and cooling market in the Japan is expected to grow with a CAGR of 10.9% from 2024 to 2034. Japan has a strong emphasis on energy efficiency and sustainability. The need to reduce energy consumption and minimize environmental impact drives the adoption of energy-efficient critical power and cooling solutions.

Japan is susceptible to seismic and meteorological events, including earthquakes and typhoons. Ensuring the resilience of critical infrastructure, including power and cooling systems, is a priority to maintain continuous operations and minimize the impact of disruptions. Japan is known for embracing advanced technologies. The adoption of technologies like artificial intelligence, high-performance computing, and 5G necessitates robust critical power and cooling solutions to support these applications.
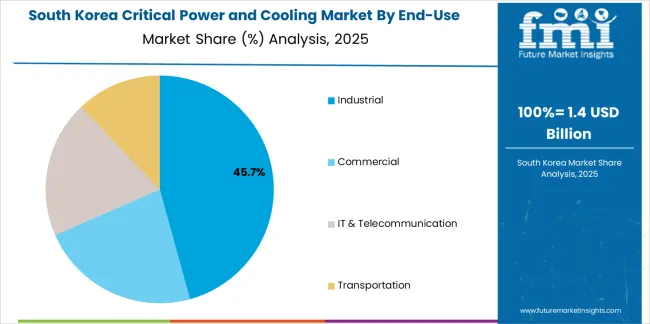
Increasing Number of Data Centre in South Korea Drives Market Growth

The critical power and cooling market in the South Korea is expected to grow with a CAGR of 14.6% from 2024 to 2034. The growth of the digital economy and increased reliance on data-driven processes have led to a rising number of data centers in South Korea.

The demand for reliable power and cooling solutions is closely tied to the expansion of data center facilities. The adoption of energy-efficient critical power and cooling solutions aligns with the country's goals to reduce energy consumption and minimize the environmental impact of infrastructure.

As a major player in the global technology and manufacturing landscape, South Korea requires robust critical power and cooling infrastructure to support international connectivity and data exchange.

Category-wise Insights

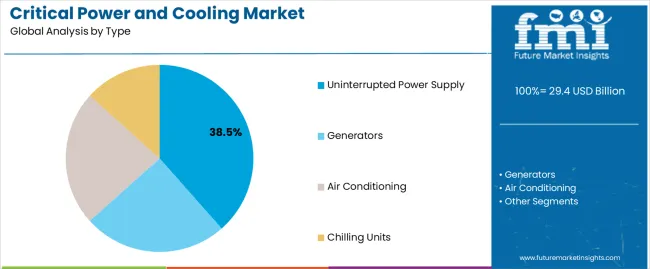
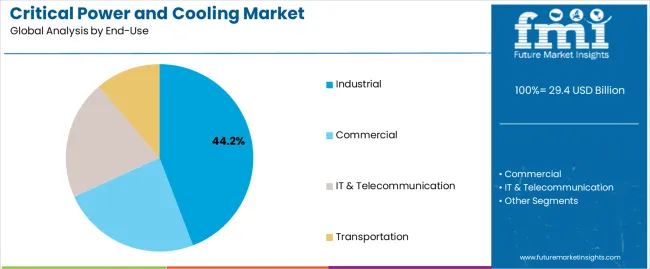
The below section shows the leading segment. Uninterrupted power supply segment to grow at a CAGR of 11.8% from 2024 to 2034. Based on end-use, the industrial segment is anticipated to hold a dominant share through 2034. It is set to exhibit a CAGR of 11.5% from 2024 to 2034.

Category CAGR from 2024 to 2034
Uninterrupted Power Supply 11.8%
Industrial 11.5%

Uninterrupted Power Supply Segment to Remain Prominent Throughout the Forecast Period

Based on type, the uninterrupted power supply segment is anticipated to thrive at a CAGR of 11.8% from 2024 to 2034. Uninterrupted power is essential for maintaining continuous operations, safeguarding data, and ensuring business continuity. Even brief power outages can lead to data loss, downtime, and financial losses.

Data centers house sensitive electronic equipment and servers that require a stable and uninterrupted power supply for optimal performance. UPS systems act as a safeguard during power outages or fluctuations, providing a seamless transition to backup power sources and preventing downtime.

Industrial Segment to Remain Prominent In the Market

Based on end-use, the industrial segment is anticipated to grow at a CAGR of 11.5% from 2024 to 2034. Many industrial processes are highly sensitive to interruptions in power supply. Industries, particularly those in sectors such as pharmaceuticals, chemicals, and food production, often operate in regulatory environments with strict requirements for safety and environmental control. Compliance with these regulations necessitates the implementation of reliable critical power and cooling solutions.

Industrial facilities often house complex and sensitive machinery, including manufacturing equipment, robotics, and control systems. These systems require a stable power supply to operate efficiently and accurately. Critical power solutions protect these equipment from power quality issues and outages.

Industrial processes often require precise temperature control and environmental conditions. Critical cooling solutions play a crucial role in maintaining optimal working conditions for equipment, preventing overheating, and ensuring consistent product quality.
Competitive Landscape

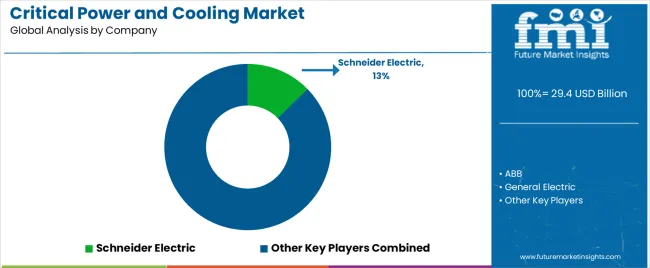
The key players in the market are focusing on development of advanced features, such as intelligent monitoring and management systems, to enhance overall system performance. The market players are forming partnerships with other technology providers to create comprehensive solutions that integrate critical power and cooling with other data center infrastructure components.

  • Schneider Electric - A global leader in energy management and automation solutions. Offers a comprehensive range of critical power and cooling solutions, including uninterruptible power supply (UPS) systems, cooling systems, and management software.
  • ABB - A multinational technology company providing solutions in electrification, robotics, automation, and power. Offers critical power solutions, including UPS systems, power distribution, and automation for various industries.

Report Scope

Attributes Details
Estimated Market Size in 2024 US$ 26.2 billion
Projected Market Valuation in 2034 US$ 82 billion
Value-based CAGR 2024 to 2034 12.1%
Forecast Period 2024 to 2034
Historical Data Available for 2019 to 2023
Market Analysis Value in US$ billion
Key Regions Covered
  • North America
  • Latin America
  • Western Europe
  • Eastern Europe
  • South Asia and Pacific
  • East Asia
  • Middle East and Africa
Key Market Segments Covered
  • Type
  • End-Use
  • Region
Key Countries Profiled
  • The United States
  • Canada
  • Brazil
  • Mexico
  • Germany
  • The United Kingdom
  • France
  • Spain
  • Italy
  • Russia
  • Poland
  • Czech Republic
  • Romania
  • India
  • Bangladesh
  • Australia
  • New Zealand
  • China
  • Japan
  • South Korea
  • GCC countries
  • South Africa
  • Israel
Key Companies Profiled
  • Schneider Electric
  • ABB
  • General Electric
  • Eaton Corporation
  • Delta Electronics
  • Socomec Group
  • Falcon Electric Inc.
  • Daikin Industries
  • Stulz Group
  • Vertiv
  • Piller Group GmBH
  • Nortek Air Solutions
  • SPX Corporation
  • Rittal GmBH & Co.
  • nVent
  • Sudlows

Critical Power and Cooling Market - Key Segments

By Type:

  • Uninterrupted power supply
  • Generators
  • Air conditioning
  • Chilling units

By End-Use:

  • Industrial
  • Commercial
  • IT & Telecommunication
  • Transportation

By Region:

  • North America
  • Latin America
  • Western Europe
  • Eastern Europe
  • South Asia and Pacific
  • East Asia
  • Middle East and Africa

Frequently Asked Questions

What is the expected worth of the critical power and cooling market in 2024?

As of 2024, the market for critical power and cooling is expected to be valued at US$ 26.2 billion.

What is the anticipated market value for critical power and cooling in 2034?

By 2034, the market value of critical power and cooling is expected to reach US$ 82 billion.

What is the projected forecast CAGR for critical power and cooling market from 2024 to 2034?

From 2024 to 2034, the critical power and cooling market is expected to flourish at a CAGR of 12.1%

Based on the type, which segment dominates the critical power and cooling market?

The uninterrupted power supply segment is expected to grow at a CAGR of 11.8% from 2024 to 2034.

Which country is likely to be at the pinnacle of the market?

South Korea is likely the top-performing market, with a CAGR of 14.6%.

Table of Content

1. Executive Summary

    1.1. Global Market Outlook

    1.2. Demand-side Trends

    1.3. Supply-side Trends

    1.4. Technology Roadmap Analysis

    1.5. Analysis and Recommendations

2. Market Overview

    2.1. Market Coverage / Taxonomy

    2.2. Market Definition / Scope / Limitations

3. Market Background

    3.1. Market Dynamics

        3.1.1. Drivers

        3.1.2. Restraints

        3.1.3. Opportunity

        3.1.4. Trends

    3.2. Scenario Forecast

        3.2.1. Demand in Optimistic Scenario

        3.2.2. Demand in Likely Scenario

        3.2.3. Demand in Conservative Scenario

    3.3. Opportunity Map Analysis

    3.4. Investment Feasibility Matrix

    3.5. PESTLE and Porter’s Analysis

    3.6. Regulatory Landscape

        3.6.1. By Key Regions

        3.6.2. By Key Countries

    3.7. Regional Parent Market Outlook

4. Global Market Analysis 2019 to 2023 and Forecast, 2024 to 2034

    4.1. Historical Market Size Value (US$ Million) Analysis, 2019 to 2023

    4.2. Current and Future Market Size Value (US$ Million) Projections, 2024 to 2034

        4.2.1. Y-o-Y Growth Trend Analysis

        4.2.2. Absolute $ Opportunity Analysis

5. Global Market Analysis 2019 to 2023 and Forecast 2024 to 2034, By Type

    5.1. Introduction / Key Findings

    5.2. Historical Market Size Value (US$ Million) Analysis By Type, 2019 to 2023

    5.3. Current and Future Market Size Value (US$ Million) Analysis and Forecast By Type, 2024 to 2034

        5.3.1. Uninterrupted power supply

        5.3.2. Generators

        5.3.3. Air conditioning

        5.3.4. Chilling units

    5.4. Y-o-Y Growth Trend Analysis By Type, 2019 to 2023

    5.5. Absolute $ Opportunity Analysis By Type, 2024 to 2034

6. Global Market Analysis 2019 to 2023 and Forecast 2024 to 2034, By End-Use

    6.1. Introduction / Key Findings

    6.2. Historical Market Size Value (US$ Million) Analysis By End-Use, 2019 to 2023

    6.3. Current and Future Market Size Value (US$ Million) Analysis and Forecast By End-Use, 2024 to 2034

        6.3.1. Industrial

        6.3.2. Commercial

        6.3.3. IT & Telecommunication

        6.3.4. Transportation

    6.4. Y-o-Y Growth Trend Analysis By End-Use, 2019 to 2023

    6.5. Absolute $ Opportunity Analysis By End-Use, 2024 to 2034

7. Global Market Analysis 2019 to 2023 and Forecast 2024 to 2034, By Region

    7.1. Introduction

    7.2. Historical Market Size Value (US$ Million) Analysis By Region, 2019 to 2023

    7.3. Current Market Size Value (US$ Million) Analysis and Forecast By Region, 2024 to 2034

        7.3.1. North America

        7.3.2. Latin America

        7.3.3. Western Europe

        7.3.4. Eastern Europe

        7.3.5. South Asia and Pacific

        7.3.6. East Asia

        7.3.7. Middle East and Africa

    7.4. Market Attractiveness Analysis By Region

8. North America Market Analysis 2019 to 2023 and Forecast 2024 to 2034, By Country

    8.1. Historical Market Size Value (US$ Million) Trend Analysis By Market Taxonomy, 2019 to 2023

    8.2. Market Size Value (US$ Million) Forecast By Market Taxonomy, 2024 to 2034

        8.2.1. By Country

            8.2.1.1. USA

            8.2.1.2. Canada

        8.2.2. By Type

        8.2.3. By End-Use

    8.3. Market Attractiveness Analysis

        8.3.1. By Country

        8.3.2. By Type

        8.3.3. By End-Use

    8.4. Key Takeaways

9. Latin America Market Analysis 2019 to 2023 and Forecast 2024 to 2034, By Country

    9.1. Historical Market Size Value (US$ Million) Trend Analysis By Market Taxonomy, 2019 to 2023

    9.2. Market Size Value (US$ Million) Forecast By Market Taxonomy, 2024 to 2034

        9.2.1. By Country

            9.2.1.1. Brazil

            9.2.1.2. Mexico

            9.2.1.3. Rest of Latin America

        9.2.2. By Type

        9.2.3. By End-Use

    9.3. Market Attractiveness Analysis

        9.3.1. By Country

        9.3.2. By Type

        9.3.3. By End-Use

    9.4. Key Takeaways

10. Western Europe Market Analysis 2019 to 2023 and Forecast 2024 to 2034, By Country

    10.1. Historical Market Size Value (US$ Million) Trend Analysis By Market Taxonomy, 2019 to 2023

    10.2. Market Size Value (US$ Million) Forecast By Market Taxonomy, 2024 to 2034

        10.2.1. By Country

            10.2.1.1. Germany

            10.2.1.2. UK

            10.2.1.3. France

            10.2.1.4. Spain

            10.2.1.5. Italy

            10.2.1.6. Rest of Western Europe

        10.2.2. By Type

        10.2.3. By End-Use

    10.3. Market Attractiveness Analysis

        10.3.1. By Country

        10.3.2. By Type

        10.3.3. By End-Use

    10.4. Key Takeaways

11. Eastern Europe Market Analysis 2019 to 2023 and Forecast 2024 to 2034, By Country

    11.1. Historical Market Size Value (US$ Million) Trend Analysis By Market Taxonomy, 2019 to 2023

    11.2. Market Size Value (US$ Million) Forecast By Market Taxonomy, 2024 to 2034

        11.2.1. By Country

            11.2.1.1. Poland

            11.2.1.2. Russia

            11.2.1.3. Czech Republic

            11.2.1.4. Romania

            11.2.1.5. Rest of Eastern Europe

        11.2.2. By Type

        11.2.3. By End-Use

    11.3. Market Attractiveness Analysis

        11.3.1. By Country

        11.3.2. By Type

        11.3.3. By End-Use

    11.4. Key Takeaways

12. South Asia and Pacific Market Analysis 2019 to 2023 and Forecast 2024 to 2034, By Country

    12.1. Historical Market Size Value (US$ Million) Trend Analysis By Market Taxonomy, 2019 to 2023

    12.2. Market Size Value (US$ Million) Forecast By Market Taxonomy, 2024 to 2034

        12.2.1. By Country

            12.2.1.1. India

            12.2.1.2. Bangladesh

            12.2.1.3. Australia

            12.2.1.4. New Zealand

            12.2.1.5. Rest of South Asia and Pacific

        12.2.2. By Type

        12.2.3. By End-Use

    12.3. Market Attractiveness Analysis

        12.3.1. By Country

        12.3.2. By Type

        12.3.3. By End-Use

    12.4. Key Takeaways

13. East Asia Market Analysis 2019 to 2023 and Forecast 2024 to 2034, By Country

    13.1. Historical Market Size Value (US$ Million) Trend Analysis By Market Taxonomy, 2019 to 2023

    13.2. Market Size Value (US$ Million) Forecast By Market Taxonomy, 2024 to 2034

        13.2.1. By Country

            13.2.1.1. China

            13.2.1.2. Japan

            13.2.1.3. South Korea

        13.2.2. By Type

        13.2.3. By End-Use

    13.3. Market Attractiveness Analysis

        13.3.1. By Country

        13.3.2. By Type

        13.3.3. By End-Use

    13.4. Key Takeaways

14. Middle East and Africa Market Analysis 2019 to 2023 and Forecast 2024 to 2034, By Country

    14.1. Historical Market Size Value (US$ Million) Trend Analysis By Market Taxonomy, 2019 to 2023

    14.2. Market Size Value (US$ Million) Forecast By Market Taxonomy, 2024 to 2034

        14.2.1. By Country

            14.2.1.1. GCC Countries

            14.2.1.2. South Africa

            14.2.1.3. Israel

            14.2.1.4. Rest of MEA

        14.2.2. By Type

        14.2.3. By End-Use

    14.3. Market Attractiveness Analysis

        14.3.1. By Country

        14.3.2. By Type

        14.3.3. By End-Use

    14.4. Key Takeaways

15. Key Countries Market Analysis

    15.1. USA

        15.1.1. Pricing Analysis

        15.1.2. Market Share Analysis, 2023

            15.1.2.1. By Type

            15.1.2.2. By End-Use

    15.2. Canada

        15.2.1. Pricing Analysis

        15.2.2. Market Share Analysis, 2023

            15.2.2.1. By Type

            15.2.2.2. By End-Use

    15.3. Brazil

        15.3.1. Pricing Analysis

        15.3.2. Market Share Analysis, 2023

            15.3.2.1. By Type

            15.3.2.2. By End-Use

    15.4. Mexico

        15.4.1. Pricing Analysis

        15.4.2. Market Share Analysis, 2023

            15.4.2.1. By Type

            15.4.2.2. By End-Use

    15.5. Germany

        15.5.1. Pricing Analysis

        15.5.2. Market Share Analysis, 2023

            15.5.2.1. By Type

            15.5.2.2. By End-Use

    15.6. UK

        15.6.1. Pricing Analysis

        15.6.2. Market Share Analysis, 2023

            15.6.2.1. By Type

            15.6.2.2. By End-Use

    15.7. France

        15.7.1. Pricing Analysis

        15.7.2. Market Share Analysis, 2023

            15.7.2.1. By Type

            15.7.2.2. By End-Use

    15.8. Spain

        15.8.1. Pricing Analysis

        15.8.2. Market Share Analysis, 2023

            15.8.2.1. By Type

            15.8.2.2. By End-Use

    15.9. Italy

        15.9.1. Pricing Analysis

        15.9.2. Market Share Analysis, 2023

            15.9.2.1. By Type

            15.9.2.2. By End-Use

    15.10. Poland

        15.10.1. Pricing Analysis

        15.10.2. Market Share Analysis, 2023

            15.10.2.1. By Type

            15.10.2.2. By End-Use

    15.11. Russia

        15.11.1. Pricing Analysis

        15.11.2. Market Share Analysis, 2023

            15.11.2.1. By Type

            15.11.2.2. By End-Use

    15.12. Czech Republic

        15.12.1. Pricing Analysis

        15.12.2. Market Share Analysis, 2023

            15.12.2.1. By Type

            15.12.2.2. By End-Use

    15.13. Romania

        15.13.1. Pricing Analysis

        15.13.2. Market Share Analysis, 2023

            15.13.2.1. By Type

            15.13.2.2. By End-Use

    15.14. India

        15.14.1. Pricing Analysis

        15.14.2. Market Share Analysis, 2023

            15.14.2.1. By Type

            15.14.2.2. By End-Use

    15.15. Bangladesh

        15.15.1. Pricing Analysis

        15.15.2. Market Share Analysis, 2023

            15.15.2.1. By Type

            15.15.2.2. By End-Use

    15.16. Australia

        15.16.1. Pricing Analysis

        15.16.2. Market Share Analysis, 2023

            15.16.2.1. By Type

            15.16.2.2. By End-Use

    15.17. New Zealand

        15.17.1. Pricing Analysis

        15.17.2. Market Share Analysis, 2023

            15.17.2.1. By Type

            15.17.2.2. By End-Use

    15.18. China

        15.18.1. Pricing Analysis

        15.18.2. Market Share Analysis, 2023

            15.18.2.1. By Type

            15.18.2.2. By End-Use

    15.19. Japan

        15.19.1. Pricing Analysis

        15.19.2. Market Share Analysis, 2023

            15.19.2.1. By Type

            15.19.2.2. By End-Use

    15.20. South Korea

        15.20.1. Pricing Analysis

        15.20.2. Market Share Analysis, 2023

            15.20.2.1. By Type

            15.20.2.2. By End-Use

    15.21. GCC Countries

        15.21.1. Pricing Analysis

        15.21.2. Market Share Analysis, 2023

            15.21.2.1. By Type

            15.21.2.2. By End-Use

    15.22. South Africa

        15.22.1. Pricing Analysis

        15.22.2. Market Share Analysis, 2023

            15.22.2.1. By Type

            15.22.2.2. By End-Use

    15.23. Israel

        15.23.1. Pricing Analysis

        15.23.2. Market Share Analysis, 2023

            15.23.2.1. By Type

            15.23.2.2. By End-Use

16. Market Structure Analysis

    16.1. Competition Dashboard

    16.2. Competition Benchmarking

    16.3. Market Share Analysis of Top Players

        16.3.1. By Regional

        16.3.2. By Type

        16.3.3. By End-Use

17. Competition Analysis

    17.1. Competition Deep Dive

        17.1.1. Schneider Electric

            17.1.1.1. Overview

            17.1.1.2. Product Portfolio

            17.1.1.3. Profitability by Market Segments

            17.1.1.4. Sales Footprint

            17.1.1.5. Strategy Overview

                17.1.1.5.1. Marketing Strategy

        17.1.2. ABB

            17.1.2.1. Overview

            17.1.2.2. Product Portfolio

            17.1.2.3. Profitability by Market Segments

            17.1.2.4. Sales Footprint

            17.1.2.5. Strategy Overview

                17.1.2.5.1. Marketing Strategy

        17.1.3. General Electric

            17.1.3.1. Overview

            17.1.3.2. Product Portfolio

            17.1.3.3. Profitability by Market Segments

            17.1.3.4. Sales Footprint

            17.1.3.5. Strategy Overview

                17.1.3.5.1. Marketing Strategy

        17.1.4. Eaton Corporation

            17.1.4.1. Overview

            17.1.4.2. Product Portfolio

            17.1.4.3. Profitability by Market Segments

            17.1.4.4. Sales Footprint

            17.1.4.5. Strategy Overview

                17.1.4.5.1. Marketing Strategy

        17.1.5. Delta Electronics

            17.1.5.1. Overview

            17.1.5.2. Product Portfolio

            17.1.5.3. Profitability by Market Segments

            17.1.5.4. Sales Footprint

            17.1.5.5. Strategy Overview

                17.1.5.5.1. Marketing Strategy

        17.1.6. Socomec Group

            17.1.6.1. Overview

            17.1.6.2. Product Portfolio

            17.1.6.3. Profitability by Market Segments

            17.1.6.4. Sales Footprint

            17.1.6.5. Strategy Overview

                17.1.6.5.1. Marketing Strategy

        17.1.7. Falcon Electric Inc.

            17.1.7.1. Overview

            17.1.7.2. Product Portfolio

            17.1.7.3. Profitability by Market Segments

            17.1.7.4. Sales Footprint

            17.1.7.5. Strategy Overview

                17.1.7.5.1. Marketing Strategy

        17.1.8. Daikin Industries

            17.1.8.1. Overview

            17.1.8.2. Product Portfolio

            17.1.8.3. Profitability by Market Segments

            17.1.8.4. Sales Footprint

            17.1.8.5. Strategy Overview

                17.1.8.5.1. Marketing Strategy

        17.1.9. Stulz Group

            17.1.9.1. Overview

            17.1.9.2. Product Portfolio

            17.1.9.3. Profitability by Market Segments

            17.1.9.4. Sales Footprint

            17.1.9.5. Strategy Overview

                17.1.9.5.1. Marketing Strategy

        17.1.10. Vertiv

            17.1.10.1. Overview

            17.1.10.2. Product Portfolio

            17.1.10.3. Profitability by Market Segments

            17.1.10.4. Sales Footprint

            17.1.10.5. Strategy Overview

                17.1.10.5.1. Marketing Strategy

        17.1.11. Piller Group GmBH

            17.1.11.1. Overview

            17.1.11.2. Product Portfolio

            17.1.11.3. Profitability by Market Segments

            17.1.11.4. Sales Footprint

            17.1.11.5. Strategy Overview

                17.1.11.5.1. Marketing Strategy

        17.1.12. Nortek Air Solutions

            17.1.12.1. Overview

            17.1.12.2. Product Portfolio

            17.1.12.3. Profitability by Market Segments

            17.1.12.4. Sales Footprint

            17.1.12.5. Strategy Overview

                17.1.12.5.1. Marketing Strategy

        17.1.13. SPX Corporation

            17.1.13.1. Overview

            17.1.13.2. Product Portfolio

            17.1.13.3. Profitability by Market Segments

            17.1.13.4. Sales Footprint

            17.1.13.5. Strategy Overview

                17.1.13.5.1. Marketing Strategy

        17.1.14. Rittal GmBH & Co.

            17.1.14.1. Overview

            17.1.14.2. Product Portfolio

            17.1.14.3. Profitability by Market Segments

            17.1.14.4. Sales Footprint

            17.1.14.5. Strategy Overview

                17.1.14.5.1. Marketing Strategy

        17.1.15. nVent

            17.1.15.1. Overview

            17.1.15.2. Product Portfolio

            17.1.15.3. Profitability by Market Segments

            17.1.15.4. Sales Footprint

            17.1.15.5. Strategy Overview

                17.1.15.5.1. Marketing Strategy

        17.1.16. Sudlows

            17.1.16.1. Overview

            17.1.16.2. Product Portfolio

            17.1.16.3. Profitability by Market Segments

            17.1.16.4. Sales Footprint

            17.1.16.5. Strategy Overview

                17.1.16.5.1. Marketing Strategy

18. Assumptions & Acronyms Used

19. Research Methodology

List of Tables

Table 1: Global Market Value (US$ Million) Forecast by Region, 2019 to 2034

Table 2: Global Market Value (US$ Million) Forecast by Type, 2019 to 2034

Table 3: Global Market Value (US$ Million) Forecast by End-Use, 2019 to 2034

Table 4: North America Market Value (US$ Million) Forecast by Country, 2019 to 2034

Table 5: North America Market Value (US$ Million) Forecast by Type, 2019 to 2034

Table 6: North America Market Value (US$ Million) Forecast by End-Use, 2019 to 2034

Table 7: Latin America Market Value (US$ Million) Forecast by Country, 2019 to 2034

Table 8: Latin America Market Value (US$ Million) Forecast by Type, 2019 to 2034

Table 9: Latin America Market Value (US$ Million) Forecast by End-Use, 2019 to 2034

Table 10: Western Europe Market Value (US$ Million) Forecast by Country, 2019 to 2034

Table 11: Western Europe Market Value (US$ Million) Forecast by Type, 2019 to 2034

Table 12: Western Europe Market Value (US$ Million) Forecast by End-Use, 2019 to 2034

Table 13: Eastern Europe Market Value (US$ Million) Forecast by Country, 2019 to 2034

Table 14: Eastern Europe Market Value (US$ Million) Forecast by Type, 2019 to 2034

Table 15: Eastern Europe Market Value (US$ Million) Forecast by End-Use, 2019 to 2034

Table 16: South Asia and Pacific Market Value (US$ Million) Forecast by Country, 2019 to 2034

Table 17: South Asia and Pacific Market Value (US$ Million) Forecast by Type, 2019 to 2034

Table 18: South Asia and Pacific Market Value (US$ Million) Forecast by End-Use, 2019 to 2034

Table 19: East Asia Market Value (US$ Million) Forecast by Country, 2019 to 2034

Table 20: East Asia Market Value (US$ Million) Forecast by Type, 2019 to 2034

Table 21: East Asia Market Value (US$ Million) Forecast by End-Use, 2019 to 2034

Table 22: Middle East and Africa Market Value (US$ Million) Forecast by Country, 2019 to 2034

Table 23: Middle East and Africa Market Value (US$ Million) Forecast by Type, 2019 to 2034

Table 24: Middle East and Africa Market Value (US$ Million) Forecast by End-Use, 2019 to 2034

List of Charts

Figure 1: Global Market Value (US$ Million) by Type, 2024 to 2034

Figure 2: Global Market Value (US$ Million) by End-Use, 2024 to 2034

Figure 3: Global Market Value (US$ Million) by Region, 2024 to 2034

Figure 4: Global Market Value (US$ Million) Analysis by Region, 2019 to 2034

Figure 5: Global Market Value Share (%) and BPS Analysis by Region, 2024 to 2034

Figure 6: Global Market Y-o-Y Growth (%) Projections by Region, 2024 to 2034

Figure 7: Global Market Value (US$ Million) Analysis by Type, 2019 to 2034

Figure 8: Global Market Value Share (%) and BPS Analysis by Type, 2024 to 2034

Figure 9: Global Market Y-o-Y Growth (%) Projections by Type, 2024 to 2034

Figure 10: Global Market Value (US$ Million) Analysis by End-Use, 2019 to 2034

Figure 11: Global Market Value Share (%) and BPS Analysis by End-Use, 2024 to 2034

Figure 12: Global Market Y-o-Y Growth (%) Projections by End-Use, 2024 to 2034

Figure 13: Global Market Attractiveness by Type, 2024 to 2034

Figure 14: Global Market Attractiveness by End-Use, 2024 to 2034

Figure 15: Global Market Attractiveness by Region, 2024 to 2034

Figure 16: North America Market Value (US$ Million) by Type, 2024 to 2034

Figure 17: North America Market Value (US$ Million) by End-Use, 2024 to 2034

Figure 18: North America Market Value (US$ Million) by Country, 2024 to 2034

Figure 19: North America Market Value (US$ Million) Analysis by Country, 2019 to 2034

Figure 20: North America Market Value Share (%) and BPS Analysis by Country, 2024 to 2034

Figure 21: North America Market Y-o-Y Growth (%) Projections by Country, 2024 to 2034

Figure 22: North America Market Value (US$ Million) Analysis by Type, 2019 to 2034

Figure 23: North America Market Value Share (%) and BPS Analysis by Type, 2024 to 2034

Figure 24: North America Market Y-o-Y Growth (%) Projections by Type, 2024 to 2034

Figure 25: North America Market Value (US$ Million) Analysis by End-Use, 2019 to 2034

Figure 26: North America Market Value Share (%) and BPS Analysis by End-Use, 2024 to 2034

Figure 27: North America Market Y-o-Y Growth (%) Projections by End-Use, 2024 to 2034

Figure 28: North America Market Attractiveness by Type, 2024 to 2034

Figure 29: North America Market Attractiveness by End-Use, 2024 to 2034

Figure 30: North America Market Attractiveness by Country, 2024 to 2034

Figure 31: Latin America Market Value (US$ Million) by Type, 2024 to 2034

Figure 32: Latin America Market Value (US$ Million) by End-Use, 2024 to 2034

Figure 33: Latin America Market Value (US$ Million) by Country, 2024 to 2034

Figure 34: Latin America Market Value (US$ Million) Analysis by Country, 2019 to 2034

Figure 35: Latin America Market Value Share (%) and BPS Analysis by Country, 2024 to 2034

Figure 36: Latin America Market Y-o-Y Growth (%) Projections by Country, 2024 to 2034

Figure 37: Latin America Market Value (US$ Million) Analysis by Type, 2019 to 2034

Figure 38: Latin America Market Value Share (%) and BPS Analysis by Type, 2024 to 2034

Figure 39: Latin America Market Y-o-Y Growth (%) Projections by Type, 2024 to 2034

Figure 40: Latin America Market Value (US$ Million) Analysis by End-Use, 2019 to 2034

Figure 41: Latin America Market Value Share (%) and BPS Analysis by End-Use, 2024 to 2034

Figure 42: Latin America Market Y-o-Y Growth (%) Projections by End-Use, 2024 to 2034

Figure 43: Latin America Market Attractiveness by Type, 2024 to 2034

Figure 44: Latin America Market Attractiveness by End-Use, 2024 to 2034

Figure 45: Latin America Market Attractiveness by Country, 2024 to 2034

Figure 46: Western Europe Market Value (US$ Million) by Type, 2024 to 2034

Figure 47: Western Europe Market Value (US$ Million) by End-Use, 2024 to 2034

Figure 48: Western Europe Market Value (US$ Million) by Country, 2024 to 2034

Figure 49: Western Europe Market Value (US$ Million) Analysis by Country, 2019 to 2034

Figure 50: Western Europe Market Value Share (%) and BPS Analysis by Country, 2024 to 2034

Figure 51: Western Europe Market Y-o-Y Growth (%) Projections by Country, 2024 to 2034

Figure 52: Western Europe Market Value (US$ Million) Analysis by Type, 2019 to 2034

Figure 53: Western Europe Market Value Share (%) and BPS Analysis by Type, 2024 to 2034

Figure 54: Western Europe Market Y-o-Y Growth (%) Projections by Type, 2024 to 2034

Figure 55: Western Europe Market Value (US$ Million) Analysis by End-Use, 2019 to 2034

Figure 56: Western Europe Market Value Share (%) and BPS Analysis by End-Use, 2024 to 2034

Figure 57: Western Europe Market Y-o-Y Growth (%) Projections by End-Use, 2024 to 2034

Figure 58: Western Europe Market Attractiveness by Type, 2024 to 2034

Figure 59: Western Europe Market Attractiveness by End-Use, 2024 to 2034

Figure 60: Western Europe Market Attractiveness by Country, 2024 to 2034

Figure 61: Eastern Europe Market Value (US$ Million) by Type, 2024 to 2034

Figure 62: Eastern Europe Market Value (US$ Million) by End-Use, 2024 to 2034

Figure 63: Eastern Europe Market Value (US$ Million) by Country, 2024 to 2034

Figure 64: Eastern Europe Market Value (US$ Million) Analysis by Country, 2019 to 2034

Figure 65: Eastern Europe Market Value Share (%) and BPS Analysis by Country, 2024 to 2034

Figure 66: Eastern Europe Market Y-o-Y Growth (%) Projections by Country, 2024 to 2034

Figure 67: Eastern Europe Market Value (US$ Million) Analysis by Type, 2019 to 2034

Figure 68: Eastern Europe Market Value Share (%) and BPS Analysis by Type, 2024 to 2034

Figure 69: Eastern Europe Market Y-o-Y Growth (%) Projections by Type, 2024 to 2034

Figure 70: Eastern Europe Market Value (US$ Million) Analysis by End-Use, 2019 to 2034

Figure 71: Eastern Europe Market Value Share (%) and BPS Analysis by End-Use, 2024 to 2034

Figure 72: Eastern Europe Market Y-o-Y Growth (%) Projections by End-Use, 2024 to 2034

Figure 73: Eastern Europe Market Attractiveness by Type, 2024 to 2034

Figure 74: Eastern Europe Market Attractiveness by End-Use, 2024 to 2034

Figure 75: Eastern Europe Market Attractiveness by Country, 2024 to 2034

Figure 76: South Asia and Pacific Market Value (US$ Million) by Type, 2024 to 2034

Figure 77: South Asia and Pacific Market Value (US$ Million) by End-Use, 2024 to 2034

Figure 78: South Asia and Pacific Market Value (US$ Million) by Country, 2024 to 2034

Figure 79: South Asia and Pacific Market Value (US$ Million) Analysis by Country, 2019 to 2034

Figure 80: South Asia and Pacific Market Value Share (%) and BPS Analysis by Country, 2024 to 2034

Figure 81: South Asia and Pacific Market Y-o-Y Growth (%) Projections by Country, 2024 to 2034

Figure 82: South Asia and Pacific Market Value (US$ Million) Analysis by Type, 2019 to 2034

Figure 83: South Asia and Pacific Market Value Share (%) and BPS Analysis by Type, 2024 to 2034

Figure 84: South Asia and Pacific Market Y-o-Y Growth (%) Projections by Type, 2024 to 2034

Figure 85: South Asia and Pacific Market Value (US$ Million) Analysis by End-Use, 2019 to 2034

Figure 86: South Asia and Pacific Market Value Share (%) and BPS Analysis by End-Use, 2024 to 2034

Figure 87: South Asia and Pacific Market Y-o-Y Growth (%) Projections by End-Use, 2024 to 2034

Figure 88: South Asia and Pacific Market Attractiveness by Type, 2024 to 2034

Figure 89: South Asia and Pacific Market Attractiveness by End-Use, 2024 to 2034

Figure 90: South Asia and Pacific Market Attractiveness by Country, 2024 to 2034

Figure 91: East Asia Market Value (US$ Million) by Type, 2024 to 2034

Figure 92: East Asia Market Value (US$ Million) by End-Use, 2024 to 2034

Figure 93: East Asia Market Value (US$ Million) by Country, 2024 to 2034

Figure 94: East Asia Market Value (US$ Million) Analysis by Country, 2019 to 2034

Figure 95: East Asia Market Value Share (%) and BPS Analysis by Country, 2024 to 2034

Figure 96: East Asia Market Y-o-Y Growth (%) Projections by Country, 2024 to 2034

Figure 97: East Asia Market Value (US$ Million) Analysis by Type, 2019 to 2034

Figure 98: East Asia Market Value Share (%) and BPS Analysis by Type, 2024 to 2034

Figure 99: East Asia Market Y-o-Y Growth (%) Projections by Type, 2024 to 2034

Figure 100: East Asia Market Value (US$ Million) Analysis by End-Use, 2019 to 2034

Figure 101: East Asia Market Value Share (%) and BPS Analysis by End-Use, 2024 to 2034

Figure 102: East Asia Market Y-o-Y Growth (%) Projections by End-Use, 2024 to 2034

Figure 103: East Asia Market Attractiveness by Type, 2024 to 2034

Figure 104: East Asia Market Attractiveness by End-Use, 2024 to 2034

Figure 105: East Asia Market Attractiveness by Country, 2024 to 2034

Figure 106: Middle East and Africa Market Value (US$ Million) by Type, 2024 to 2034

Figure 107: Middle East and Africa Market Value (US$ Million) by End-Use, 2024 to 2034

Figure 108: Middle East and Africa Market Value (US$ Million) by Country, 2024 to 2034

Figure 109: Middle East and Africa Market Value (US$ Million) Analysis by Country, 2019 to 2034

Figure 110: Middle East and Africa Market Value Share (%) and BPS Analysis by Country, 2024 to 2034

Figure 111: Middle East and Africa Market Y-o-Y Growth (%) Projections by Country, 2024 to 2034

Figure 112: Middle East and Africa Market Value (US$ Million) Analysis by Type, 2019 to 2034

Figure 113: Middle East and Africa Market Value Share (%) and BPS Analysis by Type, 2024 to 2034

Figure 114: Middle East and Africa Market Y-o-Y Growth (%) Projections by Type, 2024 to 2034

Figure 115: Middle East and Africa Market Value (US$ Million) Analysis by End-Use, 2019 to 2034

Figure 116: Middle East and Africa Market Value Share (%) and BPS Analysis by End-Use, 2024 to 2034

Figure 117: Middle East and Africa Market Y-o-Y Growth (%) Projections by End-Use, 2024 to 2034

Figure 118: Middle East and Africa Market Attractiveness by Type, 2024 to 2034

Figure 119: Middle East and Africa Market Attractiveness by End-Use, 2024 to 2034

Figure 120: Middle East and Africa Market Attractiveness by Country, 2024 to 2034

Recommendations

Industrial Automation

Combined Cooling Heat and Power Plant Market

Published : June 2023

Industrial Automation

Power Quality Equipment Market

Published : December 2022

Oil and Gas

Modular Uninterrupted Power Supplies (UPS) Market

Published : March 2022

Explore Industrial Automation Insights

View Reports

Critical Power and Cooling Market