The virtual power plant (VPP) market demonstrates a dynamic growth trajectory, expanding from an estimated USD 5.6 billion in 2025 to USD 39.5 billion by 2035, with a robust CAGR of 21.6%. This significant growth is driven by the increasing deployment of diverse technologies that collectively contribute to the overall market expansion. Key technological contributors include distributed energy resources (DER) management systems, energy storage solutions, advanced communication and control platforms, and grid integration software.
Each technology plays a critical role in enabling VPPs to aggregate, monitor, and optimize distributed generation assets such as solar photovoltaic systems, wind turbines, combined heat and power units, and battery storage systems. DER management systems constitute a foundational element, allowing for efficient coordination of generation and load balancing across multiple assets. Energy storage technologies contribute significantly by providing flexibility and ensuring grid stability, particularly during peak demand periods or renewable intermittency.
Communication and control platforms facilitate real-time data acquisition, predictive analytics, and automated dispatch, enhancing the operational efficiency of VPPs. Grid integration software enables seamless interfacing with transmission and distribution networks, optimizing energy flow and supporting ancillary services.
The progressive annual market growth from USD 5.6 billion in 2025 to USD 39.5 billion in 2035 reflects a proportional increase in technology adoption, with each segment incrementally contributing to revenue expansion. The VPP market’s growth is technology-driven, with contributions from DER management, energy storage, control systems, and grid integration collectively enabling widespread deployment and operational scalability across energy networks globally.
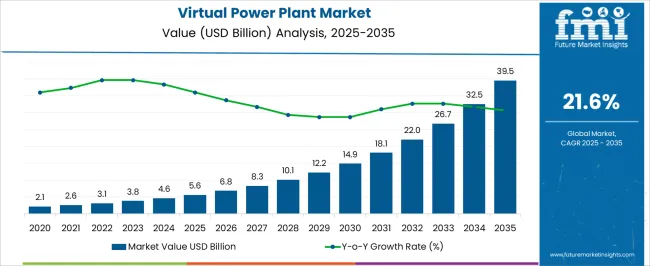
The virtual power plant market represents a specialized segment within the distributed energy and smart grid industry, emphasizing aggregation and optimization of decentralized energy resources. Within the overall energy management solutions market, it accounts for about 6.8%, driven by integration of renewable energy, storage, and demand response assets.
In the distributed energy resources (DER) segment, it holds nearly 7.4%, reflecting its role in coordinating solar, wind, and battery systems. Across the smart grid and energy automation market, the segment captures 5.2%, supporting grid reliability and peak load management.
Within the industrial and commercial energy solutions category, it represents 4.1%, highlighting adoption in campuses, factories, and microgrids. In the utility and power distribution equipment sector, it secures 3.6%, emphasizing real-time monitoring and operational optimization capabilities.
Recent developments in this market have focused on digital integration, predictive analytics, and energy optimization. Innovations include advanced software platforms for real-time energy aggregation, AI-driven forecasting, and automated demand response. Key players are collaborating with utilities, independent power producers, and renewable project developers to enhance grid stability and market participation.
Blockchain and IoT technologies are being applied for transparent transactions and secure energy exchange. Regulatory support for renewable integration and incentives for flexible energy supply are accelerating adoption globally. The cloud-based energy management solutions and modular virtual power plant systems are improving scalability and deployment speed. These advancements demonstrate how efficiency, digitalization, and renewable integration are driving growth in the virtual power plant market.
| Metric | Value |
|---|---|
| Virtual Power Plant Market Estimated Value in (2025 E) | USD 5.6 billion |
| Virtual Power Plant Market Forecast Value in (2035 F) | USD 39.5 billion |
| Forecast CAGR (2025 to 2035) | 21.6% |
The virtual power plant (VPP) market is experiencing accelerated growth, driven by the convergence of distributed energy technologies, advanced energy management systems, and evolving regulatory frameworks favoring decentralized power generation. Market expansion is being supported by the rising integration of renewable energy sources, grid digitization, and the need for flexible energy distribution to enhance grid stability.
Cost reductions in energy storage systems and the proliferation of smart grid infrastructure are enabling scalable deployment of VPP solutions across diverse regions. Policy incentives and carbon reduction targets are further stimulating adoption, particularly in markets with high renewable penetration.
In parallel, advancements in cloud-based energy management software are improving operational efficiency, enabling real-time optimization of distributed assets. The market outlook remains optimistic, with strong growth anticipated as stakeholders increasingly invest in demand response programs, peak load management, and resource aggregation strategies that enhance both operational resilience and energy cost efficiency.
The virtual power plant market is segmented by technology, end use, and geographic regions. By technology, virtual power plant market is divided into Distributed Energy Resource, Demand Response, and Mixed Asset. In terms of end use, virtual power plant market is classified into Industrial, Residential, and Commercial. Regionally, the virtual power plant industry is classified into North America, Latin America, Western Europe, Eastern Europe, Balkan & Baltic Countries, Russia & Belarus, Central Asia, East Asia, South Asia & Pacific, and the Middle East & Africa.
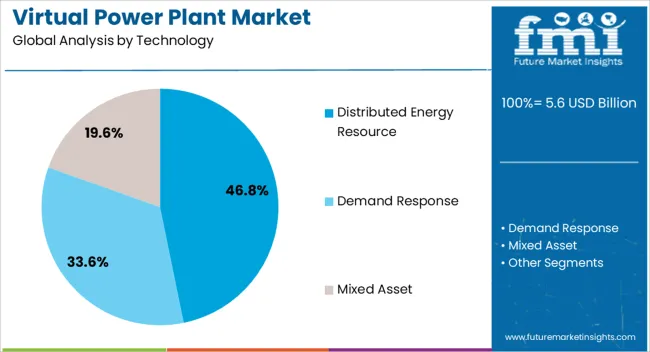
The distributed energy resource segment, holding 46.80% of the technology category, is leading the market due to its scalability, adaptability, and compatibility with various renewable energy generation and storage systems. Its adoption is being strengthened by the increasing deployment of solar PV, wind turbines, and battery storage units that can be efficiently aggregated under a VPP framework.
The segment’s performance is further supported by advancements in forecasting algorithms, predictive analytics, and AI-driven optimization, which enhance real-time energy balancing and grid support capabilities. Market dominance is being reinforced by the cost benefits of decentralized generation and the ability to minimize transmission losses.
Additionally, favorable government policies promoting prosumer participation and grid interconnection are boosting distributed energy resource integration With growing emphasis on decarbonization and energy security, this segment is expected to retain its leadership, supported by ongoing technological innovations and wider acceptance of flexible energy trading models.
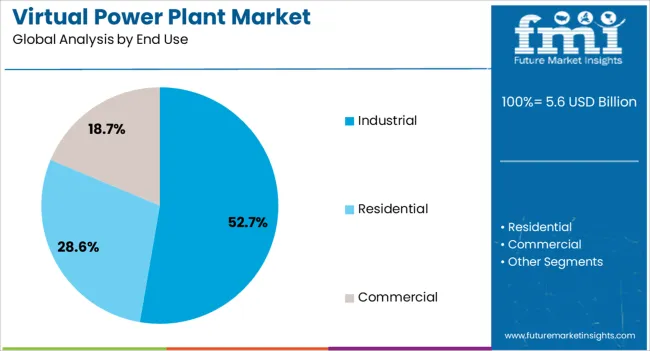
The industrial segment, accounting for 52.70% of the end-use category, dominates the market due to its substantial energy consumption patterns and the operational advantages derived from VPP participation. Industrial users benefit from peak shaving, demand-side management, and participation in ancillary service markets, which contribute to cost savings and enhanced energy reliability.
The segment’s leadership is being strengthened by increasing investments in on-site renewable generation and storage infrastructure, enabling industries to optimize surplus energy monetization through VPP platforms. Real-time monitoring and automated control systems have improved the ability of industrial facilities to respond quickly to grid signals, enhancing demand response capabilities.
Additionally, regulatory frameworks encouraging industrial decarbonization and participation in capacity markets are further promoting VPP adoption in this sector. As energy-intensive industries continue to prioritize operational efficiency and sustainability, the industrial segment is expected to maintain its leading position, supported by both economic incentives and evolving energy market structures.
The market has experienced rapid growth as decentralized energy management and smart grid technologies gain traction worldwide. VPPs integrate distributed energy resources, such as solar panels, wind turbines, battery storage, and flexible loads, into a single controllable system that can optimize energy production, consumption, and trading. Rising demand for reliable and efficient energy, coupled with government incentives for renewable integration and carbon reduction, has accelerated adoption. Technological advancements in cloud computing, real-time monitoring, and predictive analytics have enhanced system efficiency and scalability.
The growing share of renewable energy in electricity generation has been a key driver for virtual power plants. By aggregating distributed energy resources, VPPs help balance intermittent renewable generation with grid demand, enabling more stable and predictable energy supply. Residential solar installations, commercial wind turbines, and energy storage systems can be centrally coordinated, allowing operators to optimize load management and energy dispatch. Utilities and independent power producers leverage VPPs to reduce grid congestion, manage peak demand, and improve overall network reliability. The increasing focus on decarbonization and renewable energy targets further reinforces the importance of VPP solutions in modern energy systems worldwide.
Technological innovations in data analytics, IoT connectivity, artificial intelligence, and cloud-based energy management have improved the performance and scalability of virtual power plants. Advanced algorithms enable real-time monitoring, predictive maintenance, and automated demand-response management, ensuring efficient energy dispatch and grid stability. Integration with smart meters and energy storage systems allows flexible resource optimization, while cybersecurity measures protect critical infrastructure. These advancements allow VPP operators to respond to market price signals, participate in energy trading, and provide ancillary services, enhancing revenue streams. Continuous innovation in digital platforms and system interoperability has broadened the application of VPPs across residential, commercial, and industrial energy networks.
Government policies and regulatory frameworks supporting distributed energy resources and smart grids have significantly influenced the growth of the VPP market. Incentives for renewable integration, energy efficiency, and grid modernization have encouraged utilities, independent aggregators, and energy service companies to invest in virtual power plant solutions.
Regulatory mechanisms, such as demand-response programs, time-of-use pricing, and carbon reduction targets, create financial benefits for VPP operators. Furthermore, governments in Europe, North America, and the Asia-Pacific are actively promoting digital energy platforms, microgrid projects, and energy flexibility programs, which collectively enhance VPP adoption, improve grid reliability, and accelerate sustainable energy transitions.
Virtual power plants are increasingly applied in both residential and industrial settings to optimize energy utilization and reduce operational costs. Residential prosumers with solar panels, battery storage, and smart appliances can participate in aggregated energy schemes, allowing excess electricity to be fed into the grid or traded in energy markets. Industrial facilities benefit from VPPs by managing peak loads, reducing electricity bills, and ensuring uninterrupted operations. The flexibility, scalability, and modularity of VPP systems allow customized deployment across diverse energy networks. As smart cities, microgrid initiatives, and energy management programs expand globally, VPP adoption is expected to accelerate, creating new opportunities for utilities, technology providers, and end-users alike.
| Country | CAGR |
|---|---|
| China | 29.2% |
| India | 27.0% |
| Germany | 24.8% |
| France | 22.7% |
| UK | 20.5% |
| USA | 18.4% |
| Brazil | 16.2% |
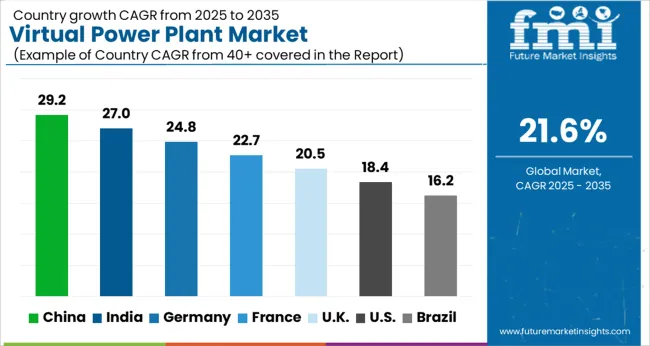
The market is expected to grow rapidly, driven by increasing adoption of distributed energy resources, smart grid integration, and energy management technologies. China leads with a forecast growth rate of 29.2%, supported by large-scale renewable integration and digital grid solutions. India follows at 27.0%, scaling through government-backed renewable energy programs and decentralized energy systems.
Germany registers 24.8%, leveraging strong technological expertise in energy management and grid optimization. The United Kingdom grows at 20.5%, innovating through smart grid trials and storage solutions. The United States reaches 18.4%, supported by federal initiatives and growing private sector investments in virtual power networks. Collectively, these countries drive global adoption, production, and innovation in the sector. This report includes insights on 40+ countries; the top markets are shown here for reference.
China is expected to grow at a CAGR of 29.2%, driven by rapid deployment of renewable energy sources and the government’s push for grid modernization. Increasing integration of distributed energy resources, including solar PV, wind, and battery storage, is enhancing grid flexibility and operational efficiency. VPPs support real-time energy balancing, peak load management, and demand response programs.
Strategic partnerships between energy technology providers and utility companies are expanding deployment across urban and industrial regions. Investment in advanced energy management software, AI-based forecasting, and IoT-enabled monitoring is enabling efficient resource optimization. Additionally, policies incentivizing low-carbon technologies are accelerating adoption across commercial, industrial, and residential sectors.
India’s VPP market is projected to grow at a CAGR of 27%, propelled by government initiatives promoting renewable energy adoption and smart grid solutions. Rapidly growing solar and wind capacity, combined with increasing industrial electricity demand, supports VPP integration for demand-side management and grid balancing. Utility companies and energy service providers are investing in IoT-based monitoring, predictive analytics, and real-time dispatch systems. Urban areas are witnessing higher adoption due to energy reliability concerns, while rural microgrids are gradually incorporating virtual power plant technology. Strategic alliances with technology vendors enable large-scale implementation. Consumer interest in sustainable energy, combined with regulatory support for decentralized energy systems, is further driving market momentum.
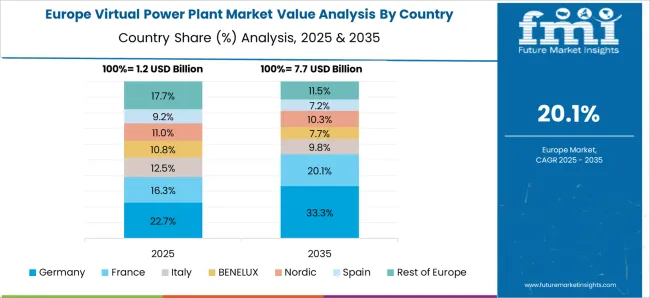
Germany is anticipated to grow at a CAGR of 24.8%, facilitated by a strong focus on renewable energy transition and grid digitization. Virtual power plants integrate distributed energy sources such as solar, wind, and biomass to optimize load management and energy efficiency. Manufacturers are investing in AI-driven predictive models, energy management systems, and cloud-based control platforms to enhance operational performance.
Strategic collaborations with utility companies and technology providers strengthen market penetration across commercial and industrial sectors. Government policies incentivizing low-carbon technologies and demand-side energy management accelerate adoption. Research in flexible energy storage integration and real-time demand response improves market efficiency and scalability.
The UK VPP market is expected to grow at a CAGR of 20.5%, driven by the need for grid flexibility and the rising penetration of renewable energy sources. Energy providers are deploying distributed generation assets such as solar, wind, and battery storage to participate in real-time energy markets. Strategic collaborations with energy technology companies enhance efficiency through AI-enabled forecasting and predictive maintenance.
Policies promoting carbon reduction, energy security, and smart grid adoption support VPP implementation. Increasing interest from commercial and industrial consumers in demand response and peak load management solutions further strengthens market demand. Continuous innovation in control software and energy optimization techniques is expected to drive sustainable growth.
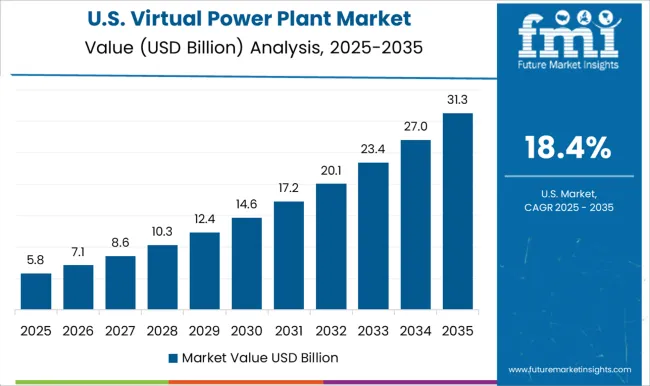
The United States VPP market is projected to grow at a CAGR of 18.4%, bolstered by the increasing adoption of renewable energy sources and energy storage solutions. Virtual power plants facilitate demand response, peak shaving, and improved grid stability for utilities and industrial clients. Investments in AI-driven control systems, cloud-based platforms, and IoT-enabled monitoring enhance energy optimization.
Strategic alliances between technology vendors, utilities, and industrial energy users enable widespread adoption. Federal and state incentives for low-carbon energy solutions, coupled with consumer interest in sustainability and energy efficiency, are creating favorable conditions. The integration of distributed solar, wind, and battery systems continues to expand market opportunities across commercial, industrial, and residential segments.
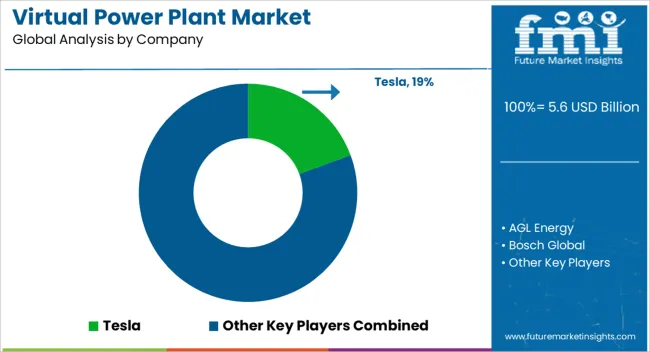
The VPP market is expanding rapidly due to the increasing integration of distributed energy resources, grid decentralization, and demand for flexible energy management solutions. Tesla is a prominent player offering advanced energy storage systems and software platforms that enable aggregation of distributed solar and battery assets to optimize grid operations.
AGL Energy and Enel X focus on leveraging renewable energy integration and smart grid technologies to deliver scalable VPP solutions for commercial and residential sectors. Bosch Global and Hitachi emphasize industrial and utility-scale deployments, combining IoT-enabled devices with AI-driven analytics for real-time energy orchestration. Enbala Power Networks and Statkraft provide platforms that aggregate distributed energy resources, demand response, and storage systems to stabilize the electricity supply while maximizing efficiency. Shell and Siemens integrate VPP capabilities with conventional and renewable energy assets to enhance grid reliability and support sustainable energy transitions. Schneider Electric delivers comprehensive energy management and automation solutions that enable VPP operations across multiple sites and regions.
| Item | Value |
|---|---|
| Quantitative Units | USD 5.6 Billion |
| Technology | Distributed Energy Resource, Demand Response, and Mixed Asset |
| End Use | Industrial, Residential, and Commercial |
| Regions Covered | North America, Europe, Asia-Pacific, Latin America, Middle East & Africa |
| Country Covered | United States, Canada, Germany, France, United Kingdom, China, Japan, India, Brazil, South Africa |
| Key Companies Profiled | Tesla, AGL Energy, Bosch Global, Enel X, Enbala Power Networks, Hitachi, Statkraft, Shell, Siemens, and Schneider Electric |
| Additional Attributes | Dollar sales by platform type and application, demand dynamics across renewable energy, grid services, and industrial sectors, regional trends in distributed energy adoption, innovation in software integration, real-time monitoring, and optimization, environmental impact of energy efficiency improvements, and emerging use cases in demand response, microgrid coordination, and decentralized energy management. |
The global virtual power plant market is estimated to be valued at USD 5.6 billion in 2025.
The market size for the virtual power plant market is projected to reach USD 39.5 billion by 2035.
The virtual power plant market is expected to grow at a 21.6% CAGR between 2025 and 2035.
The key product types in virtual power plant market are distributed energy resource, demand response and mixed asset.
In terms of end use, industrial segment to command 52.7% share in the virtual power plant market in 2025.


Full Research Suite comprises of:
Market outlook & trends analysis
Interviews & case studies
Strategic recommendations
Vendor profiles & capabilities analysis
5-year forecasts
8 regions and 60+ country-level data splits
Market segment data splits
12 months of continuous data updates
DELIVERED AS:
PDF EXCEL ONLINE
Virtual Power Plant (VPP) and V2G Orchestration Market Analysis - Size, Share, and Forecast Outlook 2025 to 2035
Virtual Pipeline Market Size and Share Forecast Outlook 2025 to 2035
Virtual Customer Premises Equipment Market Size and Share Forecast Outlook 2025 to 2035
Virtual Infrastructure Manager Market Size and Share Forecast Outlook 2025 to 2035
Virtual Companion Care Market Size and Share Forecast Outlook 2025 to 2035
Virtualized Radio Access Network Market Size and Share Forecast Outlook 2025 to 2035
Virtual Workspace Solutions Market Size and Share Forecast Outlook 2025 to 2035
Virtual Prototype Market Size and Share Forecast Outlook 2025 to 2035
Virtual Assistant Services Market Size and Share Forecast Outlook 2025 to 2035
Virtual Machines Market by Type, by Enterprise Size, by Industry & Region Forecast till 2035
Virtual Extensible LAN (VXLAN) Market Size and Share Forecast Outlook 2025 to 2035
Virtual Private Cloud Market Size and Share Forecast Outlook 2025 to 2035
Virtual PLC and Soft PLC Market Size and Share Forecast Outlook 2025 to 2035
Virtual Private Network VPN Market Size and Share Forecast Outlook 2025 to 2035
Virtualized Evolved Packet Core (vEPC) Market Size and Share Forecast Outlook 2025 to 2035
Virtual Cards Market Size and Share Forecast Outlook 2025 to 2035
Virtual Try-On Platform Market Analysis Size and Share Forecast Outlook 2025 to 2035
Virtual Private Server Market Size and Share Forecast Outlook 2025 to 2035
Virtual Client Computing Market Size and Share Forecast Outlook 2025 to 2035
Virtual Event Platforms Market Trends - Growth & Forecast 2025 to 2035

Thank you!
You will receive an email from our Business Development Manager. Please be sure to check your SPAM/JUNK folder too.
Chat With
MaRIA