Virtual Assistant Services Market Size and Share Forecast Outlook 2025 to 2035

The Global Virtual Assistant Services Market is expected to record a valuation of USD 19,506.2 million in 2025 and USD 55,406.3 million in 2035, with an increase of USD 35,900.1 million, which equals a growth of 184% over the decade. The overall expansion represents a CAGR of 11.0% and a ~2.8X increase in market size.
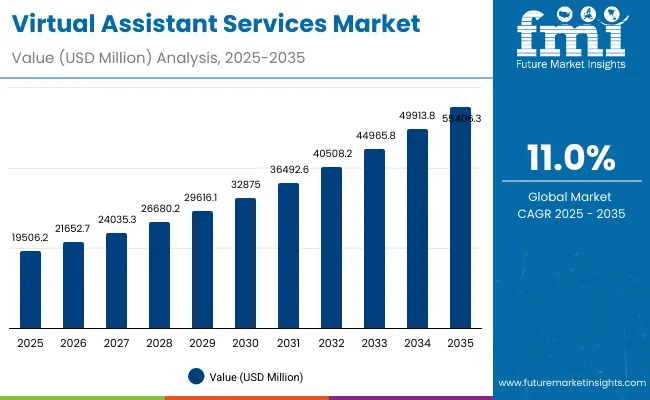
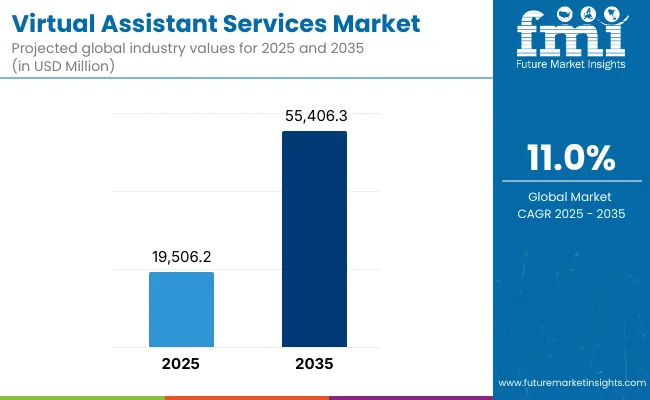
Virtual Assistant Services Market Value Analysis

Quick Stats for Global Virtual Assistant Services Market

  • Global Virtual Assistant Services Market Value (2025): USD 19,506.2 million
  • Global Virtual Assistant Services Market Forecast Value (2035): USD 55,406.3 million
  • Global Virtual Assistant Services Market Forecast CAGR: 11.0%
  • Leading Segment in Global Virtual Assistant Services Market in 2025: Dedicated monthly VA (53.5%)
  • Key Growth Regions in the Global Virtual Assistant Services Market: North America, Asia-Pacific, Europe
  • Top Key Players in Global Virtual Assistant Services Market: BELAY, Time etc, Prialto, Wishup, TaskBullet, 24/7 Virtual Assistant, Boldly, WoodBows, Virtual Staff Finder, Ossisto

Virtual Assistant Services Market

Global Virtual Assistant Services Market Key Takeaways

Metric Value
Global Virtual Assistant Services Market Estimated Value in (2025E) USD 19,506.2 million
Global Virtual Assistant Services Market Forecast Value in (2035F) USD 55,406.3 million
Forecast CAGR (2025 to 2035) 11.0%

During the first five-year period from 2025 to 2030, the market increases from USD 19,506.2 million to USD 32,875.0 million, adding USD 13,368.8 million, which accounts for 37.2% of the total decade growth. This phase records steady adoption in administrative support, customer service operations, and finance/accounting tasks, driven by the need for cost-efficient, reliable remote workforce solutions. Dedicated monthly VAs dominate this period as they cater to over 53% of businesses requiring long-term, consistent engagement.

The second half from 2030 to 2035 contributes USD 22,531.3 million, equal to 62.8% of total growth, as the market jumps from USD 32,875.0 million to USD 55,406.3 million. This acceleration is powered by widespread deployment of AI-orchestrated workflows, agency-managed VA teams, and hybrid human+automation models.

Creative/design and technical VAs together capture a larger share above 60% by the end of the decade. Platform-led analytics and cloud collaboration add recurring revenue, increasing subscription and managed-services share beyond 50% in total value.

From 2020 to 2024, the Global Virtual Assistant Services Market grew from USD 12,300 million to USD 18,100 million, driven by service-centric adoption. During this period, the competitive landscape was dominated by established VA providers controlling nearly 70% of revenue, with leaders such as BELAY, Time etc, and Boldly focusing on premium, dedicated monthly VA models for operational support across SMBs and enterprises.

Competitive differentiation relied on quality, specialization, responsiveness, and cost efficiency, while pure gig marketplaces were often positioned as auxiliary sourcing rather than primary, recurring revenue streams. Agency-managed teams saw rising attention but still contributed less than 10% of the total market value.

Demand for virtual assistant services will expand to USD 19,506.2 million in 2025, and the revenue mix will shift as platform software and managed services grow to over 40% share. Traditional service leaders face rising competition from digital-first players offering AI-driven task automation, workflow integration, and subscription-based operating models.

Major providers are pivoting to hybrid models, integrating analytics and remote workflow capabilities to retain relevance. Emerging entrants specializing in tool interoperability, AI copilots, and industry-specific VA stacks are gaining share. The competitive advantage is moving away from labor scale alone to ecosystem strength, scalability, and recurring subscription revenues.

Why the Global Virtual Assistant Services Market is growing?

Advances in remote work infrastructure and AI-assisted task management have improved productivity and speed, allowing for more efficient support across diverse applications. Dedicated monthly VA subscriptions have gained popularity due to their suitability for continuous operations and role coverage.

The rise of AI-enabled orchestration has contributed to enhanced responsiveness and real-time workflow execution. SMBs, startups, and enterprises are driving demand for VA solutions that integrate seamlessly with existing tools and processes. Expansion of process outsourcing in customer service, admin operations, and finance workflows has fueled market growth.

Innovations in freelance sourcing, managed teams, and platform enhancements are expected to open new application areas. Segment growth is expected to be led by dedicated monthly VA models, SMB client base, and administrative VAs due to their precision in execution, adaptability, and broad applicability.

Segmental Analysis

The market is segmented by type, client base, service model, and region. Types include administrative VA, customer service VA, creative/design VA, technical VA, and finance/accounting VA, highlighting the core roles driving adoption. Client base covers SMBs, startups, enterprises, and individuals to cater to different operational requirements.

Based on service model, the segmentation includes hourly freelance VA, dedicated monthly VA, and agency-managed teams. Regionally, the scope spans North America, Latin America, Western and Eastern Europe, Balkan and Baltic countries, Russia and Belarus, Central Asia, East Asia, South Asia and Pacific, and the Middle East and Africa.
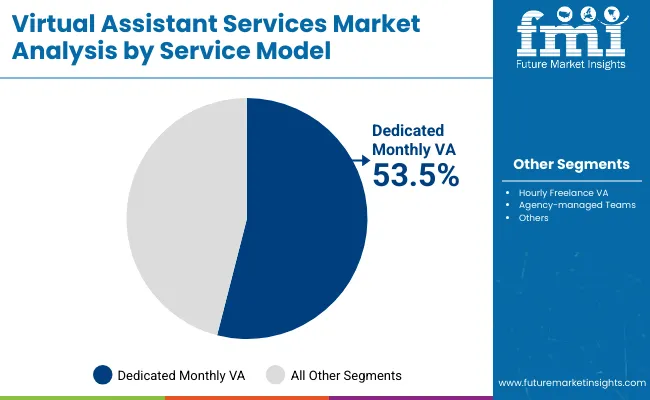
Insights into the Service Model Segment with Dedicated Monthly VAs Leading in Market Share

Virtual Assistant Services Market By Service Model

Service Model Segment Market Value Share, 2025
Dedicated Monthly VAs 53.5%
Others 46.5 %

The dedicated monthly VA segment is projected to contribute 53.5% of the Global Virtual Assistant Services Market revenue in 2025, maintaining its lead as the dominant service model. This is driven by ongoing demand for long-term, reliable support with clear SLAs and role continuity. Subscription commitments have been prioritized by users seeking consistency and high-quality outcomes across functions.

The segment’s growth is also supported by the development of integrated platforms and playbooks that enhance scalability. As AI and automation become more prevalent, providers are upgrading capabilities to support workflow orchestration and analytics. The dedicated monthly VA segment is expected to retain its position as the backbone of VA programs.
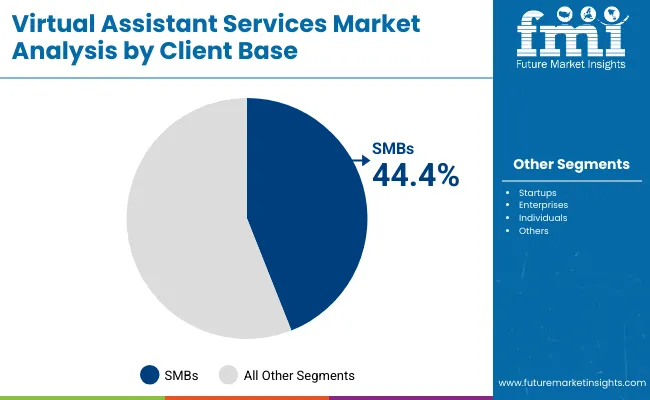
Insights into the Client Base Segment with SMBs Dominating the Demand

Virtual Assistant Services Market By Client Base

Client Base Segment Market Value Share, 2025
SMBs 44.4%
Others 55.6 %

The SMB segment is forecasted to hold 44.4% of the market share in 2025, led by its application in cost-optimized outsourcing and flexible headcount strategies. SMBs are favored clients for their high adoption of recurring VA subscriptions, making them a cornerstone of demand.Their adoption has been facilitated by easy onboarding, bundled tool stacks, and predictable pricing. The segment’s growth is bolstered by e-commerce expansion and digitization that increase task volumes. As organizations increasingly require operational leverage without full-time hires, SMBs are expected to continue their strong contribution.
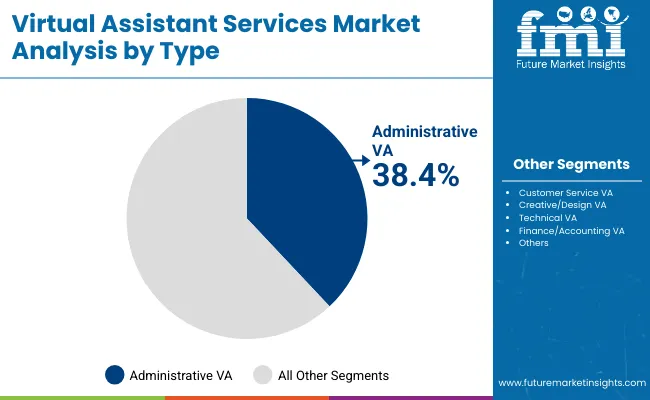
Insights into the Type Segment with Administrative VAs Leading in Market Share

Virtual Assistant Services Market By Type

Type Segment Market Value Share, 2025
Administrative VAs 38.4%
Others 61.6 %

The administrative VA segment is projected to account for 38.4% of the Global Virtual Assistant Services Market revenue in 2025, establishing it as the leading role category. Administrative VAs are preferred for calendar, inbox, documentation, and coordination tasks that form the largest share of outsourcing demand.

Their suitability for startups, SMBs, and enterprises and affordability have made them the most widely adopted option. Developments in collaboration suites, communication platforms, and workflow integrations have improved outcomes and visibility. Given its balance of high demand and wide applicability, the administrative VA segment is expected to maintain its leading role in the Global Virtual Assistant Services Market.

What are the Drivers, Restraints, and Key Trends of the Global Virtual Assistant Services Market?

Drivers

SMB and Startup Adoption of Cost-Effective Workforce Solutions

The most significant driver of the global virtual assistant services market is the rapid adoption among small and medium-sized businesses (SMBs) and startups. These organizations operate under tighter budgets than large enterprises and often lack the resources to hire full-time employees for administrative, customer service, or finance functions.

Virtual assistants (VAs) provide a scalable, cost-efficient solution that helps bridge this resource gap. In 2025, SMBs are estimated to account for 44.4% of total market revenue, representing a critical backbone of the industry. With the growth of e-commerce platforms, digital entrepreneurship, and remote-first companies, outsourcing repetitive yet essential tasks to VAs has become an operational necessity. Startups, in particular, benefit from the flexibility of VA services, which allow them to scale up or down without the liabilities of permanent contracts.

The rise of SaaS ecosystems and collaboration platforms has further enabled VAs to seamlessly integrate into workflows, offering instant value without infrastructure investments. Additionally, the growing demand for 24/7 customer support in highly competitive industries like retail, logistics, and digital services is driving more SMBs to outsource to virtual assistants located across time zones. As this demand continues, SMB and startup outsourcing will serve as the foundation for sustained market expansion, especially in emerging economies where entrepreneurial ecosystems are flourishing.

Shift Toward Dedicated Subscription Models

Another powerful growth driver is the increasing shift toward dedicated monthly VA services, which already represent 53.5% of the global market share in 2025. Businesses prefer this service model because it ensures continuity, accountability, and reliability compared to one-time freelance arrangements. Dedicated subscription models enable companies to align VAs with internal processes, improving efficiency and consistency in service delivery.

From the provider’s perspective, subscription-based models also generate recurring revenue streams, ensuring stability and allowing firms to scale sustainably. Enterprises, in particular, are drawn to dedicated VA services for complex functions like finance, technical support, or content creation, where training and consistency matter more than short-term cost savings.

This preference aligns with the broader trend in global business toward subscription-based ecosystems, where predictability of expenses and service quality are paramount. Moreover, the dedicated model supports long-term collaboration, enabling VAs to acquire domain-specific expertise over time, which further enhances productivity and trust.

As clients increasingly demand value-added services, providers offering structured packages, productivity tracking, and performance reporting within the subscription framework are becoming more competitive. Over the next decade, this driver will continue to accelerate market consolidation toward subscription models, making them the dominant pillar of the global VA services industry.

Restraints

Data Security and Privacy Concerns

One of the biggest restraints for the virtual assistant services market is the issue of data security and privacy compliance. By outsourcing administrative, finance, or customer-facing functions, businesses expose themselves to risks of data breaches, misuse, and compliance violations. Sensitive tasks, such as managing financial transactions, handling confidential client information, or accessing proprietary databases, create vulnerabilities when performed by third-party virtual assistants.

Regulatory complexities add another layer of concernwhile the EU enforces stringent GDPR standards, the USA, Asia-Pacific, and Middle East regions operate with fragmented or less robust frameworks, making cross-border outsourcing riskier. For enterprises in sectors like healthcare, finance, and government, even a minor breach can result in reputational damage, heavy fines, and loss of customer trust.

Smaller businesses, although less regulated, also hesitate to outsource highly sensitive functions due to fear of losing control over data. Despite the emergence of secure collaboration platforms and identity verification tools, the lack of standardized global protocols remains a challenge.

Providers that cannot guarantee secure workflows and compliance certification are likely to struggle with client acquisition, particularly in data-sensitive industries. Therefore, unless the market develops stronger frameworks for cybersecurity and privacy, this restraint will continue to limit adoption at enterprise scale.

High Market Fragmentation and Lack of Standardization

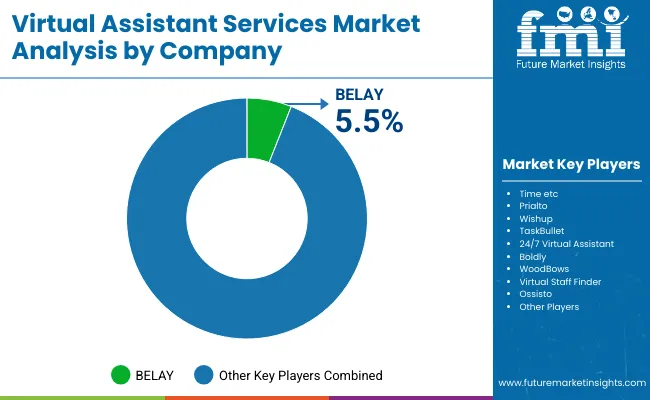
The global virtual assistant services market is highly fragmented, with even the leading player, BELAY, holding just 5.5% of global market share in 2025. This fragmentation creates difficulties for clients in evaluating quality, pricing, and reliability across thousands of small and mid-sized providers.

Unlike industries with standardized skill certifications or quality benchmarks, VA services often vary widely in training, specialization, and technological integration. For enterprises that seek scalable, multi-location outsourcing solutions, this lack of standardization becomes a major barrier. High fragmentation also suppresses pricing power, as competition drives down service rates without corresponding improvements in quality.

The absence of globally recognized professional certifications for VAs exacerbates the issue, resulting in inconsistent client experiences. While boutique agencies may thrive by catering to niche needs, the lack of standardization prevents the industry from scaling at the same pace as other outsourcing markets like IT or BPO.

This restraint also reduces investor confidence in smaller VA providers, limiting their ability to grow beyond regional strongholds. For the market to mature, consolidation and the development of common service quality benchmarks will be necessary. Until then, fragmentation will continue to cap growth potential and contribute to client hesitancy in adopting VA services for mission-critical functions.

Key Trends

AI-Enhanced VA Services and Hybrid Models

A defining trend in the market is the integration of artificial intelligence (AI) and automation into virtual assistant services. Providers are increasingly adopting AI-powered tools such as natural language processing, workflow automation, and predictive analytics to augment human VAs. These hybrid models deliver efficiency by combining the empathy and judgment of human assistants with the speed and scalability of AI. For example, AI tools can handle repetitive tasks like scheduling, data entry, or chatbot-based customer interactions, while human VAs manage complex, judgment-based functions.

This not only improves cost efficiency for clients but also enhances service quality by providing 24/7 coverage and reducing response times. Over the decade, AI-enabled VA platforms are expected to evolve into comprehensive ecosystems, integrating task management, analytics dashboards, and collaboration tools. Clients are also demanding hybrid services that can scale quickly, especially in high-growth markets like China and India, where demand for affordable yet reliable solutions is surging. This trend reflects a broader shift from manpower-centric outsourcing to technology-augmented ecosystems, where scalability, security, and efficiency form the new competitive advantage.

Rising Demand for Specialized VAs

While administrative VAs currently dominate with 38.4% market share in 2025, the future growth trajectory points toward specialized services. Businesses are increasingly outsourcing creative/design, technical, and finance/accounting tasks that require domain expertise beyond general administrative work. For instance, startups in tech hubs such as India and Japan are leveraging technical VAs for coding support, testing, and IT operations, while creative VAs are in high demand across digital marketing, content creation, and e-commerce industries.

Japan (CAGR 16.9%) and India (CAGR 23.6%) exemplify this trend, as both countries are seeing accelerated demand for domain-specific skills. Specialized VAs also command premium pricing, making this segment more lucrative for providers.

The trend is reinforced by the rise of SaaS platforms and global freelancing ecosystems, which enable clients to find highly skilled assistants for niche roles at competitive rates. This shift from generic administrative outsourcing toward specialized services demonstrates the market’s maturation and indicates a future where providers differentiate less by cost and more by expertise and value creation.
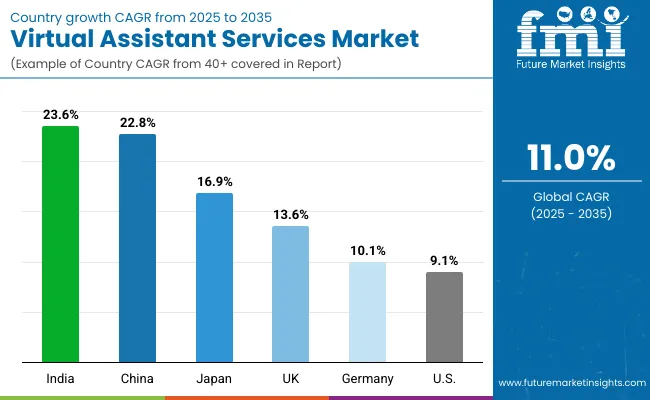
Analysis of Global Virtual Assistant Services Market By Key Countries

Virtual Assistant Services Market Country Wise Analysis

Country Estimated CAGR (2025 to 2035)
China 22.8%
USA 9.1%
India 23.6%
UK 13.6%
Germany 10.1%
Japan 16.9%

Between 2025 and 2035, the global virtual assistant services market is set to experience divergent growth rates across key countries, reflecting differences in digital adoption, outsourcing maturity, and workforce trends. India and China emerge as the fastest-growing markets with CAGRs of 23.6% and 22.8%, respectively. This surge is supported by a large base of SMBs, rapid digitalization, and strong entrepreneurial ecosystems seeking affordable operational support.

Japan also records a high CAGR of 16.9%, driven by demand for specialized creative and technical VAs as the country embraces hybrid work models and invests heavily in digital workforce integration. These fast-growth regions indicate a strong shift in market momentum toward Asia, where businesses are rapidly scaling and cost efficiencies are paramount. In contrast, mature Western markets show steady but slower expansion.

The USA, the current leader with over 24% global share in 2025, is expected to grow at a 9.1% CAGR, reflecting saturation and strong competition, though subscription-based dedicated VA models keep demand resilient. Germany (10.1%) and the UK (13.6%) illustrate Europe’s gradual adoption, with demand concentrated in SMEs and enterprises seeking efficiency in customer-facing and administrative tasks. Overall, while North America and Europe remain influential in market size, the higher CAGRs in Asia underscore a geographical shift in growth opportunities, with India, China, and Japan poised to define the next decade of expansion.
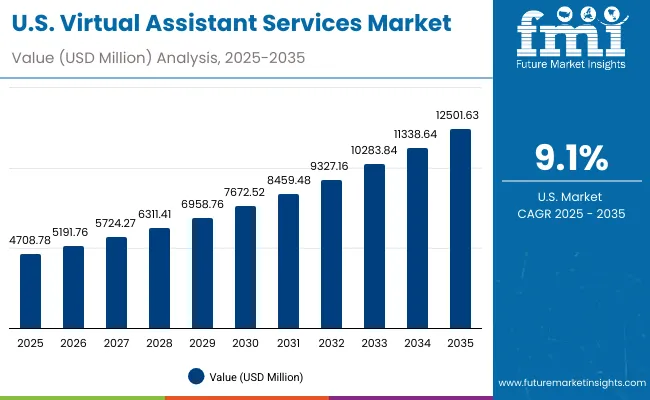
Sales Outlook for Virtual Assistant Services in the United States

Usa Virtual Assistant Services Market

Year USA Market (USD Million)
2025 4708.8
2026 5191.8
2027 5724.3
2028 6311.4
2029 6958.8
2030 7672.5
2031 8459.5
2032 9327.2
2033 10283.8
2034 11338.6
2035 12501.6

The Virtual Assistant Services Market in the United States is projected to grow at a CAGR of 9.1%, supported by the rising adoption of dedicated subscription-based VA models. Enterprises are focusing on administrative and finance/accounting assistants to streamline operations, while SMBs are expanding outsourcing for customer service and digital support roles. Increasing reliance on subscription-driven virtual staffing is shaping USA demand, particularly among professional services firms. The market is also witnessing integration of automation into VA workflows, creating opportunities for hybrid models.

  • Enterprises are expanding demand for dedicated monthly VAs for finance and technical roles.
  • SMBs are adopting customer service outsourcing for cost-efficient client engagement.
  • Hybrid VA models combining human expertise and automation are emerging as growth drivers.

Growth and Expansion Outlook for Virtual Assistant Services in the United Kingdom

The Virtual Assistant Services Market in the United Kingdom is expected to grow at a CAGR of 13.6%, supported by increasing adoption among SMEs and the professional services sector. The U.K. market is characterized by strong outsourcing demand for administrative and creative VAs, particularly in consulting, marketing, and design firms. Enterprises are outsourcing technical support roles, while individuals are increasingly using personal VAs for lifestyle management. A combination of remote-first work adoption and strong freelance culture continues to fuel market growth.

  • Consulting and design firms are outsourcing to creative and design-focused VAs.
  • Enterprises are leveraging technical VAs for IT and operations support.
  • Individuals are adopting personal VAs for scheduling and daily management tasks.

Growth and Expansion Outlook for Virtual Assistant Services in India

India is witnessing the fastest growth globally, with the market forecast to expand at a CAGR of 23.6% through 2035. Rapid digital adoption by MSMEs and startups is fueling outsourcing demand across administrative, finance, and technical roles. The rise of tier-2 city businesses has accelerated adoption, supported by lower service costs and availability of skilled English-speaking talent. Educational institutions are also contributing to supply-side growth by training talent in virtual assistance and remote work tools. India is emerging as both a demand and supply hub for virtual assistant services.

  • MSMEs are outsourcing administrative and customer support tasks to reduce costs.
  • Startups are adopting finance and technical VAs to scale operations faster.
  • India is evolving as a dual hub: global service provider and local demand driver.

Sales Outlook for Virtual Assistant Services in China

The Virtual Assistant Services Market in China is projected to grow at a CAGR of 22.8%, among the highest globally. Strong digitization programs, a rapidly expanding SMB base, and government support for entrepreneurship are driving growth. Local tech firms are creating competitive VA platforms that blend automation and human assistants, making services more accessible. Chinese enterprises are increasingly outsourcing customer service and creative roles, while SMBs are scaling with affordable monthly subscription packages. E-commerce, fintech, and logistics companies are leading adoption.
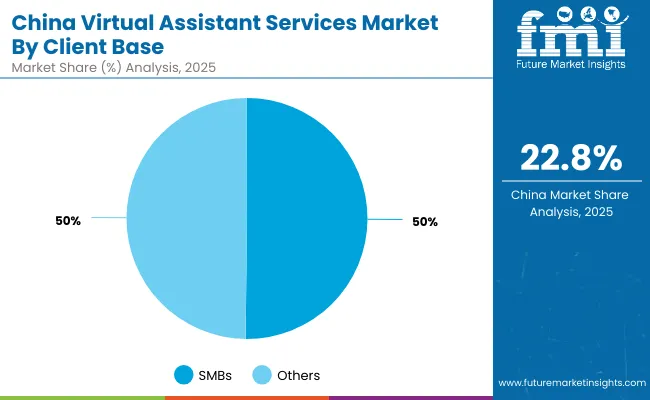
  • SMBs are driving demand, holding 50.2% market share in 2025.
  • E-commerce and fintech firms are outsourcing customer service and creative VAs.
  • Domestic platforms offering low-cost subscription packages are accelerating adoption.

Opportunity Analysis of the United States Virtual Assistant Services Market

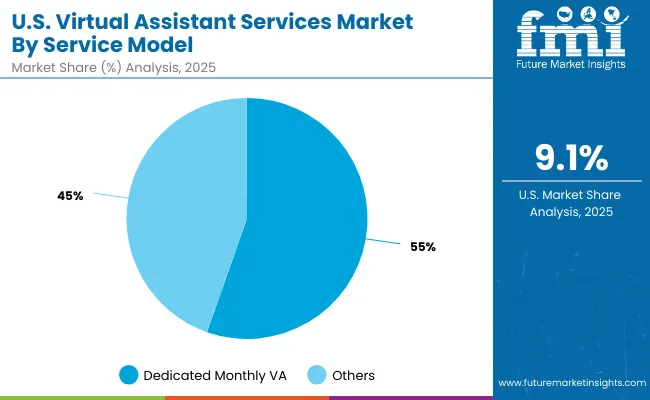
Usa Virtual Assistant Services Market By Service Type

Service Model Segment Market Value Share, 2025
Dedicated monthly VA 55.4%
Others 44.6 %

The Virtual Assistant Services Market in the United States is valued at USD 4,708.78 million in 2025, with dedicated monthly VA services leading at 55.4%, followed by freelance and agency-managed models at 44.6%. The dominance of dedicated monthly services is a direct outcome of the USA enterprise landscape, where continuity, compliance, and quality assurance are prioritized. Enterprises and SMBs increasingly adopt subscription-based VAs for finance, administrative, and customer-facing roles, ensuring structured workflows and measurable ROI.

This advantage positions dedicated monthly models as the backbone of the USA outsourcing ecosystem, particularly for sectors like professional services, finance, and healthcare, where reliability and domain-specific expertise are non-negotiable. Freelance and agency-managed options remain relevant for creative and project-based work but are secondary compared to recurring subscription services. As hybrid human-AI models expand, the USA will see continued demand for dedicated services integrated with automation and analytics tools.
  • Market size for USA in 2025 is USD 4,708.78 million
  • Global market share is approximately 24.1% in 2025
  • Dedicated monthly VAs lead at 55.4% due to demand for continuity and quality

Opportunity Analysis of the China Virtual Assistant Services Market

China Virtual Assistant Services Market By Client Base

Client Base Segment Market Value Share, 2025
SMBs 50.2%
Others 49.8 %

The Virtual Assistant Services Market in China is valued at USD 7,269 million in 2025 (12.9% of global share), with SMBs leading at 50.2%, followed by startups, enterprises, and individuals at 49.8%. The dominance of SMBs reflects China’s dynamic entrepreneurial ecosystem, where small businesses and online retailers rely heavily on outsourced customer service, creative design, and administrative support to scale efficiently.

SMBs benefit from cost-effective packages offered by domestic VA providers, and the integration of AI-powered platforms has made these services even more accessible. The combination of low-cost subscription models, government-backed digitalization initiatives, and competitive offerings from local firms positions SMB-focused services as the largest driver of growth. Enterprises are gradually adopting agency-managed VA teams, but SMBs remain the fastest-growing segment as they align with China’s booming e-commerce and startup economy.
  • Market size for China in 2025 is USD 7,269 million
  • Global market share is approximately 12.9% in 2025
  • SMBs lead at 50.2% due to reliance on affordable outsourcing for scale

Competitive Landscape of the Global Virtual Assistant Services Market

Virtual Assistant Services Market By Company

Company Global Value Share 2025
BELAY 5.5%
Others 94.5%

The Virtual Assistant Services Market is highly fragmented, with global leaders, mid-sized agencies, and niche-focused providers competing across diverse client segments. Global leaders such as BELAY, Time etc, and Boldly hold notable market share, driven by strong branding, premium positioning, and subscription-focused offerings.

Their strategies increasingly emphasize dedicated monthly models, hybrid AI-human workflows, and enterprise-level service packages for professional industries.Mid-sized players, including Prialto, Wishup, and TaskBullet, are expanding by focusing on startups and SMBs, offering affordable subscription services and specialized VAs in areas like customer support, finance, and creative tasks.

These providers combine human outsourcing with platform-driven tools to enhance accessibility and integration.Specialized and niche providers such as WoodBows, Virtual Staff Finder, and Ossisto focus on regional and industry-specific markets, offering flexibility and tailored solutions.

Their strength lies in customization, affordability, and adaptability rather than global dominance. Competitive differentiation is shifting away from manpower scale toward integrated ecosystems that combine automation, project management platforms, and analytics dashboards. Providers investing in hybrid AI-VA solutions, multi-lingual support, and industry-specific expertise are gaining long-term advantage.

Key Developments in Global Virtual Assistant Services Market

  • On March 5, 2024, BELAY launched its AI-augmented executive assistant service, combining human VAs with task automation tools to streamline scheduling, inbox management, and reporting for enterprise clients.
  • On June 21, 2024, Wishup rolled out a new pricing model starting at $9.99/hour for long-term subscription packages, disrupting the market by offering up to 160 monthly hours at a fraction of competitor rates.

Scope of the Report

Item Value
Quantitative Units USD 19,506.2 million
Type Administrative VA, Customer Service VA, Creative/Design VA, Technical VA, Finance/Accounting VA
Client Base SMBs, Startups, Enterprises, Individuals
Service Model Hourly Freelance VA, Dedicated Monthly VA, Agency-Managed Teams
Regions Covered North America, Europe, Asia-Pacific, Latin America, Middle East & Africa
Country Covered United States, Canada, Germany, France, United Kingdom, China, Japan, India, Brazil, South Africa
Key Companies Profiled BELAY, Time etc , Prialto , Wishup , TaskBullet , 24/7 Virtual Assistant, Boldly, WoodBows , Virtual Staff Finder, Ossisto
Additional Attributes Dollar sales by service model and client base, adoption trends in SMB outsourcing and enterprise cost-optimization, rising demand for administrative and customer service VAs, sector-specific growth in startups, e-commerce, and enterprises, subscription-based revenue segmentation, integration with AI-driven workflow automation, regional trends influenced by digitization initiatives, and innovations in hybrid VA models (human + automation).

Key Segments

By Type:

  • Administrative VA
  • Customer service VA
  • Creative/design VA
  • Technical VA
  • Finance/accounting VA

By Client Base:

  • SMBs
  • Startups
  • Enterprises
  • Individuals

By Service Model:

  • Hourly freelance VA
  • Dedicated monthly VA
  • Agency-managed teams

By Region:

  • North America
  • Latin America
  • Europe
  • East Asia
  • South Asia & Pacific
  • Middle East and Africa

Table of Content

  1. Executive Summary
    • Global Market Outlook
    • Demand-side Trends
    • Supply-side Trends
    • Technology Roadmap Analysis
    • Analysis and Recommendations
  2. Market Overview
    • Market Coverage / Taxonomy
    • Market Definition / Scope / Limitations
  3. Market Background
    • Market Dynamics
      • Drivers
      • Restraints
      • Opportunity
      • Trends
    • Scenario Forecast
      • Demand in Optimistic Scenario
      • Demand in Likely Scenario
      • Demand in Conservative Scenario
    • Opportunity Map Analysis
    • Product Life Cycle Analysis
    • Supply Chain Analysis
      • Supply Side Participants and their Roles
        • Producers
        • Mid-Level Participants (Traders/ Agents/ Brokers)
        • Wholesalers and Distributors
      • Value Added and Value Created at Node in the Supply Chain
      • List of Raw Material Suppliers
      • List of Existing and Potential Buyer’s
    • Investment Feasibility Matrix
    • Value Chain Analysis
      • Profit Margin Analysis
      • Wholesalers and Distributors
      • Retailers
    • PESTLE and Porter’s Analysis
    • Regulatory Landscape
      • By Key Regions
      • By Key Countries
    • Regional Parent Market Outlook
    • Production and Consumption Statistics
    • Import and Export Statistics
  4. Global Market Analysis 2020 to 2024 and Forecast, 2025 to 2035
    • Historical Market Size Value (USD Million) & Volume (Units) Analysis, 2020 to 2024
    • Current and Future Market Size Value (USD Million) & Volume (Units) Projections, 2025 to 2035
      • Y-o-Y Growth Trend Analysis
      • Absolute $ Opportunity Analysis
  5. Global Market Analysis 2020 to 2024 and Forecast 2025 to 2035, By Type
    • Introduction / Key Findings
    • Historical Market Size Value (USD Million) & Volume (Units) Analysis By Type, 2020 to 2024
    • Current and Future Market Size Value (USD Million) & Volume (Units) Analysis and Forecast By Type, 2025 to 2035
      • Administrative VA
      • Customer service VA
      • Creative/design VA
      • Technical VA
      • Finance/accounting VA
    • Y-o-Y Growth Trend Analysis By Type, 2020 to 2024
    • Absolute $ Opportunity Analysis By Type, 2025 to 2035
  6. Global Market Analysis 2020 to 2024 and Forecast 2025 to 2035, By Client Base
    • Introduction / Key Findings
    • Historical Market Size Value (USD Million) & Volume (Units) Analysis By Client Base , 2020 to 2024
    • Current and Future Market Size Value (USD Million) & Volume (Units) Analysis and Forecast By Client Base , 2025 to 2035
      • SMBs
      • Startups
      • Enterprises
      • Individuals
    • Y-o-Y Growth Trend Analysis By Client Base , 2020 to 2024
    • Absolute $ Opportunity Analysis By Client Base , 2025 to 2035
  7. Global Market Analysis 2020 to 2024 and Forecast 2025 to 2035, By Service Model
    • Introduction / Key Findings
    • Historical Market Size Value (USD Million) & Volume (Units) Analysis By Service Model, 2020 to 2024
    • Current and Future Market Size Value (USD Million) & Volume (Units) Analysis and Forecast By Service Model, 2025 to 2035
      • Hourly freelance VA
      • Dedicated monthly VA
      • Agency-managed teams
    • Y-o-Y Growth Trend Analysis By Service Model, 2020 to 2024
    • Absolute $ Opportunity Analysis By Service Model, 2025 to 2035
  8. Global Market Analysis 2020 to 2024 and Forecast 2025 to 2035, By Region
    • Introduction
    • Historical Market Size Value (USD Million) & Volume (Units) Analysis By Region, 2020 to 2024
    • Current Market Size Value (USD Million) & Volume (Units) Analysis and Forecast By Region, 2025 to 2035
      • North America
      • Latin America
      • Europe
      • East Asia
      • South Asia & Pacific
      • Middle East and Africa
    • Market Attractiveness Analysis By Region
  9. North America Market Analysis 2020 to 2024 and Forecast 2025 to 2035, By Country
    • Historical Market Size Value (USD Million) & Volume (Units) Trend Analysis By Market Taxonomy, 2020 to 2024
    • Market Size Value (USD Million) & Volume (Units) Forecast By Market Taxonomy, 2025 to 2035
      • By Country
        • USA
        • Canada
      • By Type
      • By Client Base
      • By Service Model
    • Market Attractiveness Analysis
      • By Country
      • By Type
      • By Client Base
      • By Service Model
    • Key Takeaways
  10. Latin America Market Analysis 2020 to 2024 and Forecast 2025 to 2035, By Country
    • Historical Market Size Value (USD Million) & Volume (Units) Trend Analysis By Market Taxonomy, 2020 to 2024
    • Market Size Value (USD Million) & Volume (Units) Forecast By Market Taxonomy, 2025 to 2035
      • By Country
        • Brazil
        • Mexico
        • Colombia
        • Rest of Latin America
      • By Type
      • By Client Base
      • By Service Model
    • Market Attractiveness Analysis
      • By Country
      • By Type
      • By Client Base
      • By Service Model
    • Key Takeaways
  11. Europe Market Analysis 2020 to 2024 and Forecast 2025 to 2035, By Country
    • Historical Market Size Value (USD Million) & Volume (Units) Trend Analysis By Market Taxonomy, 2020 to 2024
    • Market Size Value (USD Million) & Volume (Units) Forecast By Market Taxonomy, 2025 to 2035
      • By Country
        • Germany
        • UK
        • France
        • Italy
        • Spain
        • Belgium
        • Netherlands
        • Nordic
        • Switzerland
        • Russia
        • Poland
        • Rest of Europe
      • By Type
      • By Client Base
      • By Service Model
    • Market Attractiveness Analysis
      • By Country
      • By Type
      • By Client Base
      • By Service Model
    • Key Takeaways
  12. East Asia Market Analysis 2020 to 2024 and Forecast 2025 to 2035, By Country
    • Historical Market Size Value (USD Million) & Volume (Units) Trend Analysis By Market Taxonomy, 2020 to 2024
    • Market Size Value (USD Million) & Volume (Units) Forecast By Market Taxonomy, 2025 to 2035
      • By Country
        • China
        • Japan
        • South Korea
      • By Type
      • By Client Base
      • By Service Model
    • Market Attractiveness Analysis
      • By Country
      • By Type
      • By Client Base
      • By Service Model
    • Key Takeaways
  13. South Asia & Pacific Market Analysis 2020 to 2024 and Forecast 2025 to 2035, By Country
    • Historical Market Size Value (USD Million) & Volume (Units) Trend Analysis By Market Taxonomy, 2020 to 2024
    • Market Size Value (USD Million) & Volume (Units) Forecast By Market Taxonomy, 2025 to 2035
      • By Country
        • India
        • Thailand
        • Malaysia
        • Indonesia
        • Singapore
        • Vietnam
        • Australia
        • New Zealand
        • Rest of South Asia
      • By Type
      • By Client Base
      • By Service Model
    • Market Attractiveness Analysis
      • By Country
      • By Type
      • By Client Base
      • By Service Model
    • Key Takeaways
  14. Middle East and Africa Market Analysis 2020 to 2024 and Forecast 2025 to 2035, By Country
    • Historical Market Size Value (USD Million) & Volume (Units) Trend Analysis By Market Taxonomy, 2020 to 2024
    • Market Size Value (USD Million) & Volume (Units) Forecast By Market Taxonomy, 2025 to 2035
      • By Country
        • Turkey
        • UAE
        • Saudi Arabia
        • Israel
        • Other GCC Countries
        • North Africa
        • South Africa
      • By Type
      • By Client Base
      • By Service Model
    • Market Attractiveness Analysis
      • By Country
      • By Type
      • By Client Base
      • By Service Model
    • Key Takeaways
  15. Key Countries Market Analysis
    • USA
      • Pricing Analysis
      • Market Share Analysis, 2024
        • By Type
        • By Client Base
        • By Service Model
    • Canada
      • Pricing Analysis
      • Market Share Analysis, 2024
        • By Type
        • By Client Base
        • By Service Model
    • Brazil
      • Pricing Analysis
      • Market Share Analysis, 2024
        • By Type
        • By Client Base
        • By Service Model
    • Mexico
      • Pricing Analysis
      • Market Share Analysis, 2024
        • By Type
        • By Client Base
        • By Service Model
    • Colombia
      • Pricing Analysis
      • Market Share Analysis, 2024
        • By Type
        • By Client Base
        • By Service Model
    • Germany
      • Pricing Analysis
      • Market Share Analysis, 2024
        • By Type
        • By Client Base
        • By Service Model
    • UK
      • Pricing Analysis
      • Market Share Analysis, 2024
        • By Type
        • By Client Base
        • By Service Model
    • France
      • Pricing Analysis
      • Market Share Analysis, 2024
        • By Type
        • By Client Base
        • By Service Model
    • Italy
      • Pricing Analysis
      • Market Share Analysis, 2024
        • By Type
        • By Client Base
        • By Service Model
    • Spain
      • Pricing Analysis
      • Market Share Analysis, 2024
        • By Type
        • By Client Base
        • By Service Model
    • Belgium
      • Pricing Analysis
      • Market Share Analysis, 2024
        • By Type
        • By Client Base
        • By Service Model
    • Netherlands
      • Pricing Analysis
      • Market Share Analysis, 2024
        • By Type
        • By Client Base
        • By Service Model
    • Nordic
      • Pricing Analysis
      • Market Share Analysis, 2024
        • By Type
        • By Client Base
        • By Service Model
    • Switzerland
      • Pricing Analysis
      • Market Share Analysis, 2024
        • By Type
        • By Client Base
        • By Service Model
    • Russia
      • Pricing Analysis
      • Market Share Analysis, 2024
        • By Type
        • By Client Base
        • By Service Model
    • Poland
      • Pricing Analysis
      • Market Share Analysis, 2024
        • By Type
        • By Client Base
        • By Service Model
    • China
      • Pricing Analysis
      • Market Share Analysis, 2024
        • By Type
        • By Client Base
        • By Service Model
    • Japan
      • Pricing Analysis
      • Market Share Analysis, 2024
        • By Type
        • By Client Base
        • By Service Model
    • South Korea
      • Pricing Analysis
      • Market Share Analysis, 2024
        • By Type
        • By Client Base
        • By Service Model
    • India
      • Pricing Analysis
      • Market Share Analysis, 2024
        • By Type
        • By Client Base
        • By Service Model
    • Thailand
      • Pricing Analysis
      • Market Share Analysis, 2024
        • By Type
        • By Client Base
        • By Service Model
    • Indonesia
      • Pricing Analysis
      • Market Share Analysis, 2024
        • By Type
        • By Client Base
        • By Service Model
    • Australia
      • Pricing Analysis
      • Market Share Analysis, 2024
        • By Type
        • By Client Base
        • By Service Model
    • New Zealand
      • Pricing Analysis
      • Market Share Analysis, 2024
        • By Type
        • By Client Base
        • By Service Model
    • Turkey
      • Pricing Analysis
      • Market Share Analysis, 2024
        • By Type
        • By Client Base
        • By Service Model
    • UAE
      • Pricing Analysis
      • Market Share Analysis, 2024
        • By Type
        • By Client Base
        • By Service Model
    • Saudi Arabia
      • Pricing Analysis
      • Market Share Analysis, 2024
        • By Type
        • By Client Base
        • By Service Model
    • Israel
      • Pricing Analysis
      • Market Share Analysis, 2024
        • By Type
        • By Client Base
        • By Service Model
    • North Africa
      • Pricing Analysis
      • Market Share Analysis, 2024
        • By Type
        • By Client Base
        • By Service Model
    • South Africa
      • Pricing Analysis
      • Market Share Analysis, 2024
        • By Type
        • By Client Base
        • By Service Model
  16. Market Structure Analysis
    • Competition Dashboard
    • Competition Benchmarking
    • Market Share Analysis of Top Players
      • By Regional
      • By Type
      • By Client Base
      • By Service Model
  17. Competition Analysis
    • Competition Deep Dive
      • BELAY
        • Overview
        • Product Portfolio
        • Profitability by Market Segments (Product/Age /Sales Channel/Region)
        • Sales Footprint
        • Strategy Overview
          • Marketing Strategy
          • Product Strategy
          • Channel Strategy
      • Time etc
        • Overview
        • Product Portfolio
        • Profitability by Market Segments (Product/Age /Sales Channel/Region)
        • Sales Footprint
        • Strategy Overview
          • Marketing Strategy
          • Product Strategy
          • Channel Strategy
      • Prialto
        • Overview
        • Product Portfolio
        • Profitability by Market Segments (Product/Age /Sales Channel/Region)
        • Sales Footprint
        • Strategy Overview
          • Marketing Strategy
          • Product Strategy
          • Channel Strategy
      • Wishup
        • Overview
        • Product Portfolio
        • Profitability by Market Segments (Product/Age /Sales Channel/Region)
        • Sales Footprint
        • Strategy Overview
          • Marketing Strategy
          • Product Strategy
          • Channel Strategy
      • TaskBullet
        • Overview
        • Product Portfolio
        • Profitability by Market Segments (Product/Age /Sales Channel/Region)
        • Sales Footprint
        • Strategy Overview
          • Marketing Strategy
          • Product Strategy
          • Channel Strategy
      • 24/7 Virtual Assistant
        • Overview
        • Product Portfolio
        • Profitability by Market Segments (Product/Age /Sales Channel/Region)
        • Sales Footprint
        • Strategy Overview
          • Marketing Strategy
          • Product Strategy
          • Channel Strategy
      • Boldly
        • Overview
        • Product Portfolio
        • Profitability by Market Segments (Product/Age /Sales Channel/Region)
        • Sales Footprint
        • Strategy Overview
          • Marketing Strategy
          • Product Strategy
          • Channel Strategy
      • WoodBows
        • Overview
        • Product Portfolio
        • Profitability by Market Segments (Product/Age /Sales Channel/Region)
        • Sales Footprint
        • Strategy Overview
          • Marketing Strategy
          • Product Strategy
          • Channel Strategy
      • Virtual Staff Finder
        • Overview
        • Product Portfolio
        • Profitability by Market Segments (Product/Age /Sales Channel/Region)
        • Sales Footprint
        • Strategy Overview
          • Marketing Strategy
          • Product Strategy
          • Channel Strategy
      • Ossisto
        • Overview
        • Product Portfolio
        • Profitability by Market Segments (Product/Age /Sales Channel/Region)
        • Sales Footprint
        • Strategy Overview
          • Marketing Strategy
          • Product Strategy
          • Channel Strategy
  18. Assumptions & Acronyms Used
  19. Research Methodology

List of Tables

  • Table 1: Global Market Value (USD Million) Forecast by Region, 2020-2035
  • Table 2: Global Market Volume (Units) Forecast by Region, 2020-2035
  • Table 3: Global Market Value (USD Million) Forecast by Type, 2020-2035
  • Table 4: Global Market Volume (Units) Forecast by Type, 2020-2035
  • Table 5: Global Market Value (USD Million) Forecast by Client Base , 2020-2035
  • Table 6: Global Market Volume (Units) Forecast by Client Base , 2020-2035
  • Table 7: Global Market Value (USD Million) Forecast by Service Model, 2020-2035
  • Table 8: Global Market Volume (Units) Forecast by Service Model, 2020-2035
  • Table 9: North America Market Value (USD Million) Forecast by Country, 2020-2035
  • Table 10: North America Market Volume (Units) Forecast by Country, 2020-2035
  • Table 11: North America Market Value (USD Million) Forecast by Type, 2020-2035
  • Table 12: North America Market Volume (Units) Forecast by Type, 2020-2035
  • Table 13: North America Market Value (USD Million) Forecast by Client Base , 2020-2035
  • Table 14: North America Market Volume (Units) Forecast by Client Base , 2020-2035
  • Table 15: North America Market Value (USD Million) Forecast by Service Model, 2020-2035
  • Table 16: North America Market Volume (Units) Forecast by Service Model, 2020-2035
  • Table 17: Latin America Market Value (USD Million) Forecast by Country, 2020-2035
  • Table 18: Latin America Market Volume (Units) Forecast by Country, 2020-2035
  • Table 19: Latin America Market Value (USD Million) Forecast by Type, 2020-2035
  • Table 20: Latin America Market Volume (Units) Forecast by Type, 2020-2035
  • Table 21: Latin America Market Value (USD Million) Forecast by Client Base , 2020-2035
  • Table 22: Latin America Market Volume (Units) Forecast by Client Base , 2020-2035
  • Table 23: Latin America Market Value (USD Million) Forecast by Service Model, 2020-2035
  • Table 24: Latin America Market Volume (Units) Forecast by Service Model, 2020-2035
  • Table 25: Europe Market Value (USD Million) Forecast by Country, 2020-2035
  • Table 26: Europe Market Volume (Units) Forecast by Country, 2020-2035
  • Table 27: Europe Market Value (USD Million) Forecast by Type, 2020-2035
  • Table 28: Europe Market Volume (Units) Forecast by Type, 2020-2035
  • Table 29: Europe Market Value (USD Million) Forecast by Client Base , 2020-2035
  • Table 30: Europe Market Volume (Units) Forecast by Client Base , 2020-2035
  • Table 31: Europe Market Value (USD Million) Forecast by Service Model, 2020-2035
  • Table 32: Europe Market Volume (Units) Forecast by Service Model, 2020-2035
  • Table 33: East Asia Market Value (USD Million) Forecast by Country, 2020-2035
  • Table 34: East Asia Market Volume (Units) Forecast by Country, 2020-2035
  • Table 35: East Asia Market Value (USD Million) Forecast by Type, 2020-2035
  • Table 36: East Asia Market Volume (Units) Forecast by Type, 2020-2035
  • Table 37: East Asia Market Value (USD Million) Forecast by Client Base , 2020-2035
  • Table 38: East Asia Market Volume (Units) Forecast by Client Base , 2020-2035
  • Table 39: East Asia Market Value (USD Million) Forecast by Service Model, 2020-2035
  • Table 40: East Asia Market Volume (Units) Forecast by Service Model, 2020-2035
  • Table 41: South Asia & Pacific Market Value (USD Million) Forecast by Country, 2020-2035
  • Table 42: South Asia & Pacific Market Volume (Units) Forecast by Country, 2020-2035
  • Table 43: South Asia & Pacific Market Value (USD Million) Forecast by Type, 2020-2035
  • Table 44: South Asia & Pacific Market Volume (Units) Forecast by Type, 2020-2035
  • Table 45: South Asia & Pacific Market Value (USD Million) Forecast by Client Base , 2020-2035
  • Table 46: South Asia & Pacific Market Volume (Units) Forecast by Client Base , 2020-2035
  • Table 47: South Asia & Pacific Market Value (USD Million) Forecast by Service Model, 2020-2035
  • Table 48: South Asia & Pacific Market Volume (Units) Forecast by Service Model, 2020-2035
  • Table 49: Middle East and Africa Market Value (USD Million) Forecast by Country, 2020-2035
  • Table 50: Middle East and Africa Market Volume (Units) Forecast by Country, 2020-2035
  • Table 51: Middle East and Africa Market Value (USD Million) Forecast by Type, 2020-2035
  • Table 52: Middle East and Africa Market Volume (Units) Forecast by Type, 2020-2035
  • Table 53: Middle East and Africa Market Value (USD Million) Forecast by Client Base , 2020-2035
  • Table 54: Middle East and Africa Market Volume (Units) Forecast by Client Base , 2020-2035
  • Table 55: Middle East and Africa Market Value (USD Million) Forecast by Service Model, 2020-2035
  • Table 56: Middle East and Africa Market Volume (Units) Forecast by Service Model, 2020-2035

List of Figures

  • Figure 1: Global Market Value (USD Million) by Type, 2025-2035
  • Figure 2: Global Market Value (USD Million) by Client Base , 2025-2035
  • Figure 3: Global Market Value (USD Million) by Service Model, 2025-2035
  • Figure 4: Global Market Value (USD Million) by Region, 2025-2035
  • Figure 5: Global Market Value (USD Million) Analysis by Region, 2020-2035
  • Figure 6: Global Market Volume (Units) Analysis by Region, 2020-2035
  • Figure 7: Global Market Value Share (%) and BPS Analysis by Region, 2025-2035
  • Figure 8: Global Market Y-o-Y Growth (%) Projections by Region, 2025-2035
  • Figure 9: Global Market Value (USD Million) Analysis by Type, 2020-2035
  • Figure 10: Global Market Volume (Units) Analysis by Type, 2020-2035
  • Figure 11: Global Market Value Share (%) and BPS Analysis by Type, 2025-2035
  • Figure 12: Global Market Y-o-Y Growth (%) Projections by Type, 2025-2035
  • Figure 13: Global Market Value (USD Million) Analysis by Client Base , 2020-2035
  • Figure 14: Global Market Volume (Units) Analysis by Client Base , 2020-2035
  • Figure 15: Global Market Value Share (%) and BPS Analysis by Client Base , 2025-2035
  • Figure 16: Global Market Y-o-Y Growth (%) Projections by Client Base , 2025-2035
  • Figure 17: Global Market Value (USD Million) Analysis by Service Model, 2020-2035
  • Figure 18: Global Market Volume (Units) Analysis by Service Model, 2020-2035
  • Figure 19: Global Market Value Share (%) and BPS Analysis by Service Model, 2025-2035
  • Figure 20: Global Market Y-o-Y Growth (%) Projections by Service Model, 2025-2035
  • Figure 21: Global Market Attractiveness by Type, 2025-2035
  • Figure 22: Global Market Attractiveness by Client Base , 2025-2035
  • Figure 23: Global Market Attractiveness by Service Model, 2025-2035
  • Figure 24: Global Market Attractiveness by Region, 2025-2035
  • Figure 25: North America Market Value (USD Million) by Type, 2025-2035
  • Figure 26: North America Market Value (USD Million) by Client Base , 2025-2035
  • Figure 27: North America Market Value (USD Million) by Service Model, 2025-2035
  • Figure 28: North America Market Value (USD Million) by Country, 2025-2035
  • Figure 29: North America Market Value (USD Million) Analysis by Country, 2020-2035
  • Figure 30: North America Market Volume (Units) Analysis by Country, 2020-2035
  • Figure 31: North America Market Value Share (%) and BPS Analysis by Country, 2025-2035
  • Figure 32: North America Market Y-o-Y Growth (%) Projections by Country, 2025-2035
  • Figure 33: North America Market Value (USD Million) Analysis by Type, 2020-2035
  • Figure 34: North America Market Volume (Units) Analysis by Type, 2020-2035
  • Figure 35: North America Market Value Share (%) and BPS Analysis by Type, 2025-2035
  • Figure 36: North America Market Y-o-Y Growth (%) Projections by Type, 2025-2035
  • Figure 37: North America Market Value (USD Million) Analysis by Client Base , 2020-2035
  • Figure 38: North America Market Volume (Units) Analysis by Client Base , 2020-2035
  • Figure 39: North America Market Value Share (%) and BPS Analysis by Client Base , 2025-2035
  • Figure 40: North America Market Y-o-Y Growth (%) Projections by Client Base , 2025-2035
  • Figure 41: North America Market Value (USD Million) Analysis by Service Model, 2020-2035
  • Figure 42: North America Market Volume (Units) Analysis by Service Model, 2020-2035
  • Figure 43: North America Market Value Share (%) and BPS Analysis by Service Model, 2025-2035
  • Figure 44: North America Market Y-o-Y Growth (%) Projections by Service Model, 2025-2035
  • Figure 45: North America Market Attractiveness by Type, 2025-2035
  • Figure 46: North America Market Attractiveness by Client Base , 2025-2035
  • Figure 47: North America Market Attractiveness by Service Model, 2025-2035
  • Figure 48: North America Market Attractiveness by Country, 2025-2035
  • Figure 49: Latin America Market Value (USD Million) by Type, 2025-2035
  • Figure 50: Latin America Market Value (USD Million) by Client Base , 2025-2035
  • Figure 51: Latin America Market Value (USD Million) by Service Model, 2025-2035
  • Figure 52: Latin America Market Value (USD Million) by Country, 2025-2035
  • Figure 53: Latin America Market Value (USD Million) Analysis by Country, 2020-2035
  • Figure 54: Latin America Market Volume (Units) Analysis by Country, 2020-2035
  • Figure 55: Latin America Market Value Share (%) and BPS Analysis by Country, 2025-2035
  • Figure 56: Latin America Market Y-o-Y Growth (%) Projections by Country, 2025-2035
  • Figure 57: Latin America Market Value (USD Million) Analysis by Type, 2020-2035
  • Figure 58: Latin America Market Volume (Units) Analysis by Type, 2020-2035
  • Figure 59: Latin America Market Value Share (%) and BPS Analysis by Type, 2025-2035
  • Figure 60: Latin America Market Y-o-Y Growth (%) Projections by Type, 2025-2035
  • Figure 61: Latin America Market Value (USD Million) Analysis by Client Base , 2020-2035
  • Figure 62: Latin America Market Volume (Units) Analysis by Client Base , 2020-2035
  • Figure 63: Latin America Market Value Share (%) and BPS Analysis by Client Base , 2025-2035
  • Figure 64: Latin America Market Y-o-Y Growth (%) Projections by Client Base , 2025-2035
  • Figure 65: Latin America Market Value (USD Million) Analysis by Service Model, 2020-2035
  • Figure 66: Latin America Market Volume (Units) Analysis by Service Model, 2020-2035
  • Figure 67: Latin America Market Value Share (%) and BPS Analysis by Service Model, 2025-2035
  • Figure 68: Latin America Market Y-o-Y Growth (%) Projections by Service Model, 2025-2035
  • Figure 69: Latin America Market Attractiveness by Type, 2025-2035
  • Figure 70: Latin America Market Attractiveness by Client Base , 2025-2035
  • Figure 71: Latin America Market Attractiveness by Service Model, 2025-2035
  • Figure 72: Latin America Market Attractiveness by Country, 2025-2035
  • Figure 73: Europe Market Value (USD Million) by Type, 2025-2035
  • Figure 74: Europe Market Value (USD Million) by Client Base , 2025-2035
  • Figure 75: Europe Market Value (USD Million) by Service Model, 2025-2035
  • Figure 76: Europe Market Value (USD Million) by Country, 2025-2035
  • Figure 77: Europe Market Value (USD Million) Analysis by Country, 2020-2035
  • Figure 78: Europe Market Volume (Units) Analysis by Country, 2020-2035
  • Figure 79: Europe Market Value Share (%) and BPS Analysis by Country, 2025-2035
  • Figure 80: Europe Market Y-o-Y Growth (%) Projections by Country, 2025-2035
  • Figure 81: Europe Market Value (USD Million) Analysis by Type, 2020-2035
  • Figure 82: Europe Market Volume (Units) Analysis by Type, 2020-2035
  • Figure 83: Europe Market Value Share (%) and BPS Analysis by Type, 2025-2035
  • Figure 84: Europe Market Y-o-Y Growth (%) Projections by Type, 2025-2035
  • Figure 85: Europe Market Value (USD Million) Analysis by Client Base , 2020-2035
  • Figure 86: Europe Market Volume (Units) Analysis by Client Base , 2020-2035
  • Figure 87: Europe Market Value Share (%) and BPS Analysis by Client Base , 2025-2035
  • Figure 88: Europe Market Y-o-Y Growth (%) Projections by Client Base , 2025-2035
  • Figure 89: Europe Market Value (USD Million) Analysis by Service Model, 2020-2035
  • Figure 90: Europe Market Volume (Units) Analysis by Service Model, 2020-2035
  • Figure 91: Europe Market Value Share (%) and BPS Analysis by Service Model, 2025-2035
  • Figure 92: Europe Market Y-o-Y Growth (%) Projections by Service Model, 2025-2035
  • Figure 93: Europe Market Attractiveness by Type, 2025-2035
  • Figure 94: Europe Market Attractiveness by Client Base , 2025-2035
  • Figure 95: Europe Market Attractiveness by Service Model, 2025-2035
  • Figure 96: Europe Market Attractiveness by Country, 2025-2035
  • Figure 97: East Asia Market Value (USD Million) by Type, 2025-2035
  • Figure 98: East Asia Market Value (USD Million) by Client Base , 2025-2035
  • Figure 99: East Asia Market Value (USD Million) by Service Model, 2025-2035
  • Figure 100: East Asia Market Value (USD Million) by Country, 2025-2035
  • Figure 101: East Asia Market Value (USD Million) Analysis by Country, 2020-2035
  • Figure 102: East Asia Market Volume (Units) Analysis by Country, 2020-2035
  • Figure 103: East Asia Market Value Share (%) and BPS Analysis by Country, 2025-2035
  • Figure 104: East Asia Market Y-o-Y Growth (%) Projections by Country, 2025-2035
  • Figure 105: East Asia Market Value (USD Million) Analysis by Type, 2020-2035
  • Figure 106: East Asia Market Volume (Units) Analysis by Type, 2020-2035
  • Figure 107: East Asia Market Value Share (%) and BPS Analysis by Type, 2025-2035
  • Figure 108: East Asia Market Y-o-Y Growth (%) Projections by Type, 2025-2035
  • Figure 109: East Asia Market Value (USD Million) Analysis by Client Base , 2020-2035
  • Figure 110: East Asia Market Volume (Units) Analysis by Client Base , 2020-2035
  • Figure 111: East Asia Market Value Share (%) and BPS Analysis by Client Base , 2025-2035
  • Figure 112: East Asia Market Y-o-Y Growth (%) Projections by Client Base , 2025-2035
  • Figure 113: East Asia Market Value (USD Million) Analysis by Service Model, 2020-2035
  • Figure 114: East Asia Market Volume (Units) Analysis by Service Model, 2020-2035
  • Figure 115: East Asia Market Value Share (%) and BPS Analysis by Service Model, 2025-2035
  • Figure 116: East Asia Market Y-o-Y Growth (%) Projections by Service Model, 2025-2035
  • Figure 117: East Asia Market Attractiveness by Type, 2025-2035
  • Figure 118: East Asia Market Attractiveness by Client Base , 2025-2035
  • Figure 119: East Asia Market Attractiveness by Service Model, 2025-2035
  • Figure 120: East Asia Market Attractiveness by Country, 2025-2035
  • Figure 121: South Asia & Pacific Market Value (USD Million) by Type, 2025-2035
  • Figure 122: South Asia & Pacific Market Value (USD Million) by Client Base , 2025-2035
  • Figure 123: South Asia & Pacific Market Value (USD Million) by Service Model, 2025-2035
  • Figure 124: South Asia & Pacific Market Value (USD Million) by Country, 2025-2035
  • Figure 125: South Asia & Pacific Market Value (USD Million) Analysis by Country, 2020-2035
  • Figure 126: South Asia & Pacific Market Volume (Units) Analysis by Country, 2020-2035
  • Figure 127: South Asia & Pacific Market Value Share (%) and BPS Analysis by Country, 2025-2035
  • Figure 128: South Asia & Pacific Market Y-o-Y Growth (%) Projections by Country, 2025-2035
  • Figure 129: South Asia & Pacific Market Value (USD Million) Analysis by Type, 2020-2035
  • Figure 130: South Asia & Pacific Market Volume (Units) Analysis by Type, 2020-2035
  • Figure 131: South Asia & Pacific Market Value Share (%) and BPS Analysis by Type, 2025-2035
  • Figure 132: South Asia & Pacific Market Y-o-Y Growth (%) Projections by Type, 2025-2035
  • Figure 133: South Asia & Pacific Market Value (USD Million) Analysis by Client Base , 2020-2035
  • Figure 134: South Asia & Pacific Market Volume (Units) Analysis by Client Base , 2020-2035
  • Figure 135: South Asia & Pacific Market Value Share (%) and BPS Analysis by Client Base , 2025-2035
  • Figure 136: South Asia & Pacific Market Y-o-Y Growth (%) Projections by Client Base , 2025-2035
  • Figure 137: South Asia & Pacific Market Value (USD Million) Analysis by Service Model, 2020-2035
  • Figure 138: South Asia & Pacific Market Volume (Units) Analysis by Service Model, 2020-2035
  • Figure 139: South Asia & Pacific Market Value Share (%) and BPS Analysis by Service Model, 2025-2035
  • Figure 140: South Asia & Pacific Market Y-o-Y Growth (%) Projections by Service Model, 2025-2035
  • Figure 141: South Asia & Pacific Market Attractiveness by Type, 2025-2035
  • Figure 142: South Asia & Pacific Market Attractiveness by Client Base , 2025-2035
  • Figure 143: South Asia & Pacific Market Attractiveness by Service Model, 2025-2035
  • Figure 144: South Asia & Pacific Market Attractiveness by Country, 2025-2035
  • Figure 145: Middle East and Africa Market Value (USD Million) by Type, 2025-2035
  • Figure 146: Middle East and Africa Market Value (USD Million) by Client Base , 2025-2035
  • Figure 147: Middle East and Africa Market Value (USD Million) by Service Model, 2025-2035
  • Figure 148: Middle East and Africa Market Value (USD Million) by Country, 2025-2035
  • Figure 149: Middle East and Africa Market Value (USD Million) Analysis by Country, 2020-2035
  • Figure 150: Middle East and Africa Market Volume (Units) Analysis by Country, 2020-2035
  • Figure 151: Middle East and Africa Market Value Share (%) and BPS Analysis by Country, 2025-2035
  • Figure 152: Middle East and Africa Market Y-o-Y Growth (%) Projections by Country, 2025-2035
  • Figure 153: Middle East and Africa Market Value (USD Million) Analysis by Type, 2020-2035
  • Figure 154: Middle East and Africa Market Volume (Units) Analysis by Type, 2020-2035
  • Figure 155: Middle East and Africa Market Value Share (%) and BPS Analysis by Type, 2025-2035
  • Figure 156: Middle East and Africa Market Y-o-Y Growth (%) Projections by Type, 2025-2035
  • Figure 157: Middle East and Africa Market Value (USD Million) Analysis by Client Base , 2020-2035
  • Figure 158: Middle East and Africa Market Volume (Units) Analysis by Client Base , 2020-2035
  • Figure 159: Middle East and Africa Market Value Share (%) and BPS Analysis by Client Base , 2025-2035
  • Figure 160: Middle East and Africa Market Y-o-Y Growth (%) Projections by Client Base , 2025-2035
  • Figure 161: Middle East and Africa Market Value (USD Million) Analysis by Service Model, 2020-2035
  • Figure 162: Middle East and Africa Market Volume (Units) Analysis by Service Model, 2020-2035
  • Figure 163: Middle East and Africa Market Value Share (%) and BPS Analysis by Service Model, 2025-2035
  • Figure 164: Middle East and Africa Market Y-o-Y Growth (%) Projections by Service Model, 2025-2035
  • Figure 165: Middle East and Africa Market Attractiveness by Type, 2025-2035
  • Figure 166: Middle East and Africa Market Attractiveness by Client Base , 2025-2035
  • Figure 167: Middle East and Africa Market Attractiveness by Service Model, 2025-2035
  • Figure 168: Middle East and Africa Market Attractiveness by Country, 2025-2035

Frequently Asked Questions

How big is the Global Virtual Assistant Services Market in 2025?

The Global Virtual Assistant Services Market is estimated to be valued at USD 19,506.2 million in 2025.

What will be the size of the Global Virtual Assistant Services Market in 2035?

The market size for the Global Virtual Assistant Services Market is projected to reach USD 55,406.3 million by 2035.

How much will be the Global Virtual Assistant Services Market growth between 2025 and 2035?

The Global Virtual Assistant Services Market is expected to grow at a 11.0% CAGR between 2025 and 2035.

What are the key product types in the Global Virtual Assistant Services Market?

The key product types in the Global Virtual Assistant Services Market are Administrative VA, Customer Service VA, Creative/Design VA, Technical VA, and Finance/Accounting VA.

Which service model will contribute significant share in the Global Virtual Assistant Services Market in 2025?

In terms of service model, the Dedicated Monthly VA segment is expected to command 53.5% share in the Global Virtual Assistant Services Market in 2025.

Explore Similar Insights

Future Market Insights

Virtual Assistant Services Market

Chat With

MaRIA

Hi There, I am MaRIA, Your Market Research Intelligence Assistant. How may I help you?