Virtualized Radio Access Network Market Analysis - Size, Share, and Forecast Outlook 2025 to 2035

The global virtualized radio access network (vRAN) market is expected to expand from USD 19.9 billion in 2025 to USD 117.9 billion by 2035, reflecting a 20% CAGR and generating an absolute dollar opportunity of USD 98.0 billion. Market growth is driven by increasing deployment of 5G networks, demand for flexible and scalable network architectures, and adoption of software-defined networking solutions that enable reduced operational costs and improved performance. Network operators are investing in virtualized infrastructure to handle growing data traffic, improve service quality, and support emerging applications such as IoT, autonomous systems, and cloud-based services.

Quick Stats for Virtualized Radio Access Network Market
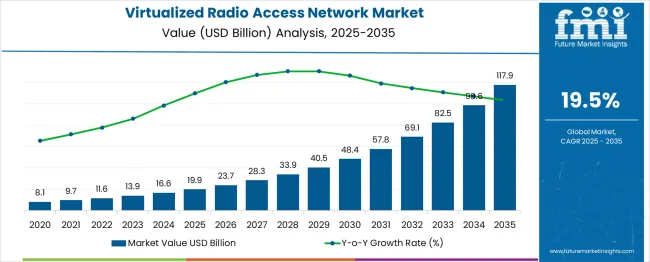
  • Virtualized Radio Access Network Market Value (2025): USD 19.9 billion
  • Virtualized Radio Access Network Market Forecast Value (2035): USD 117.9 billion
  • Virtualized Radio Access Network Market Forecast CAGR: 20%
  • Leading Component in Virtualized Radio Access Network Market: Hardware (45.0%)
  • Key Growth Regions in Virtualized Radio Access Network Market: Asia Pacific, North America, and Europe
  • Top Key Players in Virtualized Radio Access Network Market: Samsung Electronics, Mavenir, Intel Corporation, NEC Corporation, Parallel Wireless, Nokia Corporation, Capgemini, Ericsson, VMware, Cisco Systems Inc

Virtualized Radio Access Network Market Market Value Analysis

The long-term value accumulation curve illustrates how revenue builds over the forecast period. From 2025 to 2028, the curve rises steadily as early adoption occurs in North America, Europe, and East Asia, supported by 5G rollouts and pilot deployments of virtualized networks. Between 2029 and 2032, the curve steepens as large-scale adoption accelerates in emerging markets, driven by increased network modernization projects and private enterprise deployments. From 2033 to 2035, value accumulation continues at a high pace, reflecting expansion into mature markets, upgrades of initial deployments, and integration with advanced AI-driven network management. The cumulative trajectory demonstrates compounding growth, with early investments setting the foundation for exponential revenue gains in later years, prioritizing the strategic importance of vRAN in global telecom infrastructure.

Virtualized Radio Access Network Market Key Takeaways

Metric Value
Estimated Value in (2025E) USD 19.9 billion
Forecast Value in (2035F) USD 117.9 billion
Forecast CAGR (2025 to 2035) 20%

Recent developments in the virtualized radio access network market focus on 5G deployment, automation, and open architecture adoption. Operators are integrating AI and machine learning for network optimization, predictive maintenance, and energy efficiency. Open RAN standards and multi-vendor interoperability are accelerating deployment flexibility and reducing dependency on proprietary equipment.

Edge computing integration is enhancing low-latency services and real-time analytics. Telecom infrastructure expansion, increasing mobile data traffic, and rising adoption of private and enterprise networks are driving growth. These trends are fostering innovation, improving operational efficiency, and enabling scalable, flexible, and cost-effective vRAN solutions globally.

The virtualized radio access network (vRAN) market is driven by five primary parent markets with specific shares. Telecommunications operators lead with 40%, deploying vRAN to reduce infrastructure costs and increase network flexibility. Cloud computing and data centers contribute 25%, providing scalable virtualization platforms and centralized network management. Enterprise and industrial applications account for 15%, leveraging vRAN for private networks and IoT connectivity. Government and defense represent 10%, using virtualized networks for secure and resilient communications. Equipment vendors hold 10%, supplying software, hardware, and integration services to support vRAN deployments. 

Why is the Virtualized Radio Access Network Market Growing?

Market expansion is being supported by the accelerating deployment of 5G networks and the corresponding demand for flexible and scalable radio access network architectures that can support diverse use cases and service requirements. Modern telecommunications operators are increasingly focused on achieving network agility and operational efficiency while reducing the total cost of ownership through software-defined and cloud-native network solutions. Virtualized RAN's proven ability to enable rapid service deployment, network optimization, and multi-vendor interoperability makes it essential infrastructure for next-generation mobile networks.

The growing prioritization of Open RAN architectures and vendor ecosystem diversification is driving demand for virtualized RAN solutions that can provide greater flexibility in network design and supplier selection. Telecommunications operators' preference for solutions that combine performance optimization with operational simplicity is creating opportunities for innovative vRAN implementations. The rising influence of edge computing and IoT applications is also contributing to increased adoption of virtualized RAN technologies that can support distributed computing and low-latency service delivery.

Segmental Analysis

The market is segmented by component, deployment type, network type, end use, and region. By component, the market is divided into hardware, software, and services. Based on deployment type, the market is categorized into public, private, and hybrid. In terms of network type, the market is segmented into 5G, 2G/3G, 4G/LTE, and others. By end use, the market is classified into telecommunication operators, government & defense, and commercial. Regionally, the market is divided into North America, Europe, East Asia, South Asia & Pacific, Latin America, and the Middle East & Africa.
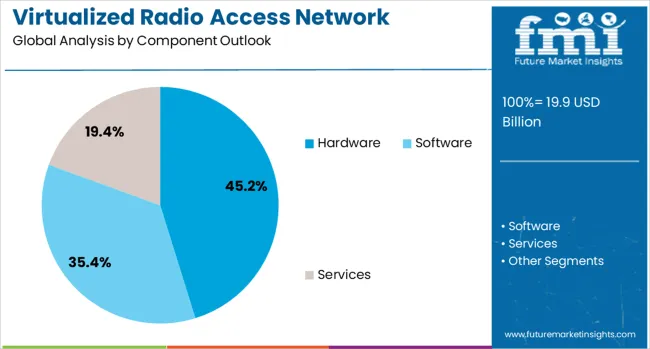
By Component, Hardware Segment Accounts for 45% Market Share

Virtualized Radio Access Network Market Analysis By Component Outlook

The hardware component segment is projected to account for 45% of the virtualized radio access network market in 2025, reaffirming its position as the dominant component category. Telecommunications operators increasingly require specialized hardware platforms, including servers, accelerators, and radio units that can support virtualized network functions and cloud-native applications. Hardware components' critical role in enabling high-performance computing and real-time processing directly addresses vRAN deployment requirements for reliable and efficient network operation.

This component category forms the foundation of virtualized RAN infrastructure, as it represents the physical platform required for running virtualized network functions and supporting diverse network services. Vendor investments in hardware optimization and specialized processing capabilities continue to strengthen market adoption. With telecommunications operators prioritizing performance and reliability in network infrastructure, hardware components align with both technical requirements and operational objectives, making them the central element of vRAN deployment strategies.

By Deployment Type, Public Segment Accounts for 52% Market Share

Virtualized Radio Access Network Market Analysis By Deployment Type Outlook 

Public deployment is projected to represent 52% of virtualized RAN demand in 2025, underscoring its critical role in mobile network operator infrastructure serving consumer and enterprise markets. Telecommunications operators prefer public vRAN deployments for their ability to serve broad coverage areas and large subscriber bases with cost-effective and scalable network solutions. Positioned as essential infrastructure for mobile network services, public vRAN deployments offer both operational efficiency benefits and service delivery advantages.

The segment is supported by ongoing mobile network expansion and increasing demand for enhanced mobile broadband services across urban and rural areas. The public vRAN deployments enable operators to achieve economies of scale while providing flexible service delivery capabilities. As mobile operators prioritize network coverage and service quality, public vRAN deployments will continue to dominate the market while supporting comprehensive mobile service delivery strategies.

By Network Type, 5G Segment Accounts for 45 % Market Share

Virtualized Radio Access Network Market Analysis By Network Type Outlook 

The 5G network type segment is forecasted to contribute 45% of the virtualized radio access network market in 2025, reflecting the primary driver of vRAN technology adoption. Telecommunications operators increasingly deploy virtualized RAN solutions to support 5G network requirements, including enhanced mobile broadband, ultra-reliable low-latency communications, and massive machine-type communications. This aligns with 5G deployment strategies that focus on network flexibility and software-defined architectures for diverse service delivery.

The segment benefits from continuous 5G network rollouts and growing enterprise adoption of 5G services requiring customized network configurations. With established 5G use cases and expanding application requirements, 5G serves as the primary catalyst for virtualized RAN adoption, making it a critical component of next-generation mobile network infrastructure and service innovation.
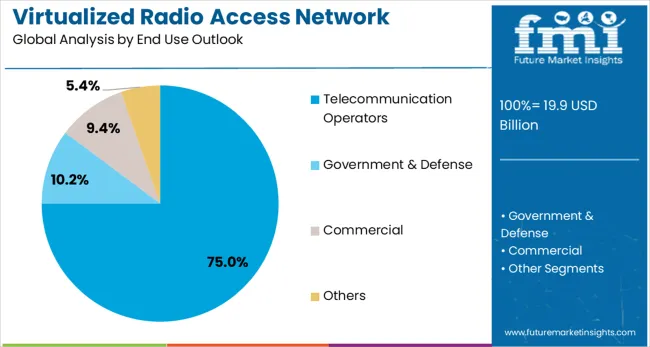
By End Use, the Telecommunication Operators Segment Accounts for 75% Market Share

Virtualized Radio Access Network Market Analysis By End Use Outlook

The telecommunication operators ' end-use segment is forecasted to contribute 75% of the virtualized radio access network market in 2025, reflecting the primary role of mobile network operators in driving vRAN adoption. Telecommunications operators increasingly invest in virtualized RAN solutions to modernize network infrastructure while achieving operational efficiency and service differentiation. This aligns with operator transformation strategies that focus on software-defined networking and cloud-native architectures.

The segment benefits from ongoing network modernization initiatives and growing competitive pressure requiring enhanced service capabilities and operational agility. With established network infrastructure and service delivery requirements, telecommunication operators serve as the primary market for virtualized RAN solutions, making them the critical foundation for market growth and technology advancement.

What are the Drivers, Restraints, and Key Trends of the Virtualized Radio Access Network Market?

The virtualized radio access network market is advancing rapidly due to accelerating 5G deployments and growing demand for network flexibility and operational efficiency in telecommunications infrastructure. The market faces challenges including integration complexity, performance optimization requirements, and concerns about network reliability and security. Innovation in cloud-native architectures and AI-driven network management continues to influence product development and market expansion patterns.

Expansion of Open RAN and Multi-Vendor Ecosystems

The growing adoption of Open RAN architectures is enabling telecommunications operators to deploy multi-vendor vRAN solutions that provide greater flexibility in network design and supplier selection. Open RAN standards facilitate interoperability between different vendor components while reducing vendor lock-in and promoting innovation and competition. Operators are increasingly recognizing the strategic advantages of open and disaggregated network architectures for achieving operational flexibility.

Integration of Edge Computing and AI-Driven Network Optimization

Modern vRAN solutions are incorporating edge computing capabilities and artificial intelligence for real-time network optimization and autonomous network management. These technologies improve network performance while enabling new service delivery models, including ultra-low latency applications and distributed computing services. Advanced AI integration also enables predictive network management and automated optimization for enhanced operational efficiency.
Analysis of the Virtualized Radio Access Network Market by Key Country

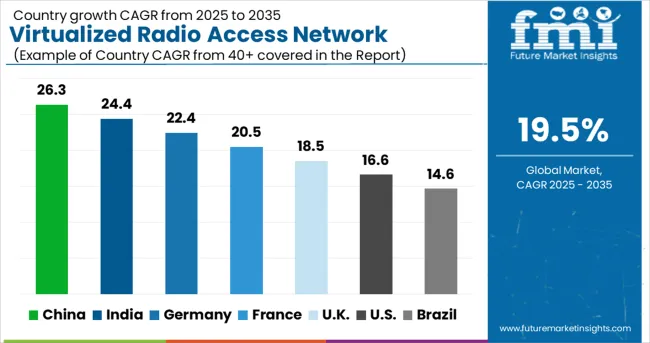
Virtualized Radio Access Network Market Cagr Analysis By Country

Country CAGR (2025-2035)
China 26.3%
India 24.4%
Germany 22.4%
France 20.5%
UK 18.5%
U.S. 16.6%
Brazil 14.6%

The global virtualized radio access network (vRAN) market is projected to grow at a robust CAGR of 19.5% from 2025 to 2035, reflecting increasing adoption of 5G networks, network virtualization, and cloud-native telecom infrastructure. China, leading BRICS nations, is growing at 26.3%, driven by aggressive 5G rollout, government-backed digital infrastructure programs, and high mobile data consumption. India follows at 24.4%, supported by expanding telecom networks, rising mobile broadband penetration, and ASEAN-linked regional collaborations in telecom technology. Germany, at 22.4%, exemplifies OECD-driven growth, leveraging advanced telecom R&D, early adoption of network virtualization, and strong regulatory frameworks. France grows at 20.5%, aided by investments in 5G infrastructure and cloud-native network trials. The United Kingdom, at 18.5%, shows steady expansion from private and public sector network modernization. The United States, at 16.6%, reflects mature market adoption with focus on efficiency and scalability. Brazil, at 14.6%, demonstrates emerging BRICS-driven demand in urban connectivity and mobile networks.

This report includes insights on 40+ countries; the top markets are shown here for reference.

Market Growth for Virtualized Radio Access Network in China

China is leading the virtualized radio access network (vRAN) market with a CAGR of 26.3%, supported by rapid 5G rollout and government initiatives to upgrade network infrastructure. Telecom operators are deploying cloud-native architectures, software-defined networks, and open RAN solutions to improve network efficiency and reduce operational costs. Domestic vendors are collaborating with global equipment providers to develop scalable, high-performance vRAN solutions, enhancing connectivity in urban and semi-urban areas. Analysts anticipate strong demand from major telecom operators investing in next-generation radio access networks to support high-speed mobile services, IoT integration, and enterprise connectivity. Edge computing deployment in metro areas is accelerating adoption, while R&D centers are focusing on AI-driven network optimization. The expansion of fiber backhaul infrastructure further complements the vRAN ecosystem, enabling low-latency performance and seamless deployment across multiple regions.

  • 5G base station virtualizations increased by 28% in 2025
  • Telecom operators adopted cloud-native vRAN solutions in 22 metro areas
  • AI-based network optimization tools grew 25% year on year

Demand Forecast for Virtualized Radio Access Network in India

India is advancing at a CAGR of 24.4%, driven by expanding mobile broadband penetration and growing telecom investments. Major operators are upgrading traditional RAN infrastructure with virtualized solutions to improve scalability, energy efficiency, and service reliability. Partnerships with international vRAN technology providers facilitate deployment of multi-vendor networks and cost-effective cloud-native operations. Analysts note that increasing smartphone adoption and data traffic are supporting robust growth, while private networks in industrial and enterprise sectors are adopting vRAN for secure, high-performance connectivity. Tier 1 and tier 2 cities show the highest adoption rates, with ongoing trials in rural regions to expand coverage. Investment in spectrum allocation and fiber backhaul further accelerates market demand, enabling high-speed mobile connectivity, low-latency applications, and smart city implementations.

  • Over 15 telecom operators initiated vRAN deployment in 2025
  • Enterprise private networks adopting vRAN increased 18%
  • Fiber backhaul integration supported 20% growth in network efficiency

Virtualized Radio Access Network Market Outlook in Germany

Germany is growing at a CAGR of 22.4%, supported by advanced network infrastructure and early adoption of cloud-native RAN technologies. Telecom operators are deploying vRAN to improve scalability, network resilience, and integration of 5G services. Collaborations between local vendors and international technology providers are facilitating multi-vendor networks and accelerating innovation. Analysts highlight that industrial IoT adoption, smart factory connectivity, and urban high-speed mobile services are driving demand. Edge computing integration and AI-driven network management further enhance efficiency and reduce operational complexity. Germany’s regulatory framework for telecommunications supports accelerated deployment, enabling operators to experiment with flexible architectures and virtualized solutions in urban and suburban regions.

  • 5G virtualized base station deployment increased 20% in 2025
  • AI-driven network management adoption grew 17%
  • Industrial IoT connectivity using vRAN expanded 18%

Future Outlook for Virtualized Radio Access Network in France

France is advancing at a CAGR of 20.5%, driven by telecom modernization initiatives and cloud-native RAN adoption. Major operators are integrating virtualized solutions to improve network flexibility, reduce costs, and enhance service quality. Analysts note that increasing mobile data demand, urban smart city projects, and enterprise private network adoption are creating growth opportunities. Collaborative research with international technology providers accelerates innovation in AI-based network optimization and energy-efficient vRAN deployment. Telecom infrastructure expansion in metropolitan areas supports seamless high-speed coverage, while regulatory support encourages open RAN and multi-vendor implementations.

  • Telecom operators implemented cloud-native vRAN in 18 metro areas in 2025
  • Energy-efficient virtualized base station adoption increased 16%
  • Smart city network projects grew 14%

Virtualized Radio Access Network Market Growth in the United Kingdom

The UK is growing at a CAGR of 18.5%, supported by 5G network expansion and virtualized RAN deployment in major urban centers. Operators are focusing on software-defined and cloud-native architectures to enhance coverage, reduce operating costs, and support IoT and enterprise networks. Analysts anticipate continued adoption driven by demand for low-latency services and flexible network operations. Edge computing, AI-driven traffic management, and multi-vendor collaboration accelerate the implementation of virtualized RAN solutions. Trials in semi-urban regions and private enterprise networks are expanding the market, while government incentives encourage technological innovation and integration.
  • Cloud-native vRAN solutions deployed in over 12 cities in 2025
  • AI-assisted traffic management adoption grew 15%
  • Enterprise private networks using virtualized RAN increased 12%

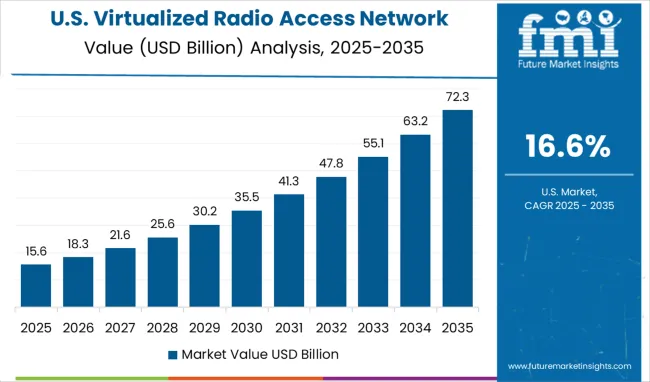
Virtualized Radio Access Network Market Expansion in the United States

Virtualized Radio Access Network Market Country Value Analysis

The US is advancing at a CAGR of 16.6%, driven by widespread 5G adoption, increasing data consumption, and deployment of virtualized RAN architectures. Telecom operators focus on scalable, cloud-native solutions to reduce operational expenses, enhance coverage, and support enterprise connectivity. Analysts project that the US market will grow due to multi-vendor network adoption, edge computing deployment, and AI-based network automation. High-density urban regions are early adopters, while rural and suburban areas gradually integrate vRAN solutions. Collaboration between domestic technology providers and international vendors accelerates innovation and adoption of next-generation mobile network solutions.
  • 5G base stations virtualized increased 18% in 2025
  • Edge computing integration for vRAN expanded 16%
  • AI-enabled network optimization adoption grew 14%

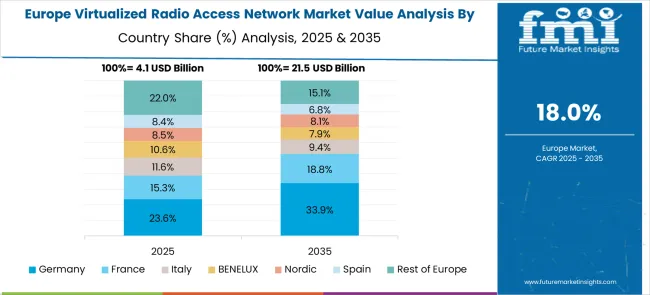
Europe Market Split by Country

Virtualized Radio Access Network Market Europe Country Market Share Analysis, 2025 & 2035

The virtualized radio access network market in Europe demonstrates advanced development across major economies, with Germany showing a strong presence through its telecommunications industry leadership and importance on 5G network modernization, supported by operators leveraging advanced engineering to implement sophisticated vRAN solutions that focus performance, reliability, and integration with existing network infrastructure. France represents a significant market driven by its telecommunications sector innovation and refined understanding of software-defined networking requirements, with companies focusing on advanced vRAN solutions that combine French telecommunications expertise with cutting-edge virtualization technologies for enhanced network flexibility and service delivery capabilities.

The UK exhibits considerable growth through its focus on telecommunications innovation and 5G deployment leadership, with strong adoption of virtualized RAN solutions among mobile network operators and technology companies. Germany and France show expanding interest in Open RAN implementations, particularly in multi-vendor deployments and cloud-native network architectures. BENELUX countries contribute through their focus on telecommunications innovation and advanced network technologies. At the same time, Eastern Europe and Nordic regions display growing potential driven by increasing 5G investments and expanding adoption of software-defined networking solutions.
Competitive Landscape of the Virtualized Radio Access Network Market

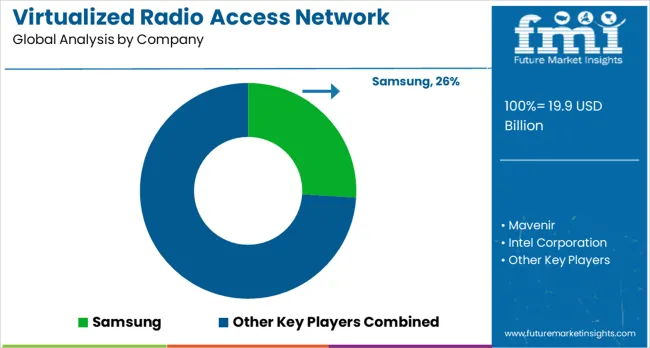
Virtualized Radio Access Network Market Analysis By Company

The virtualized radio access network (vRAN) market is driven by telecommunications companies, network equipment providers, and IT solutions firms aiming to optimize mobile network performance and flexibility. Samsung Electronics leads with advanced 5G-ready vRAN solutions designed to enhance network efficiency and support high-capacity mobile traffic. Mavenir specializes in cloud-native vRAN software, enabling operators to reduce deployment costs and improve scalability, while Intel Corporation provides critical processing hardware and accelerators essential for high-performance virtualized network functions. NEC Corporation contributes integrated solutions that combine radio, cloud, and orchestration technologies to facilitate seamless network modernization.

Network flexibility and automation are further advanced by companies such as Parallel Wireless, offering open, software-driven vRAN solutions that simplify deployment across urban and rural areas. Nokia Corporation and Ericsson focus on end-to-end mobile network infrastructure, integrating vRAN into broader 4G and 5G ecosystem services, while Capgemini provides consulting and implementation support to help operators navigate complex network transformations. VMware enhances network virtualization capabilities with cloud-based management and orchestration tools, supporting dynamic scaling and centralized control of radio access networks. Cisco Systems, Inc. strengthens the market with solutions that unify hardware, software, and cloud infrastructure, allowing operators to improve reliability and reduce operational overhead.

Key Players in the Virtualized Radio Access Network Market

  • Samsung Electronics
  • Mavenir
  • Intel Corporation
  • NEC Corporation
  • Parallel Wireless
  • Nokia Corporation
  • Capgemini
  • Ericsson
  • VMware
  • Cisco Systems, Inc.

Scope of the Report

Items Values
Quantitative Units (2025) USD 19.9 Billion
Component Hardware, Software, Services
Deployment Type Public, Private, Hybrid
Network Type 5G, 2G/3G, 4G/LTE, Others
End Use Telecommunication Operators, Government & Defense, Commercial
Regions Covered North America, Europe, East Asia, South Asia & Pacific, Latin America, Middle East & Africa
Countries Covered United States, Canada, United Kingdom, Germany, France, China, Japan, South Korea, India, Brazil, Australia and 40+ countries
Key Companies Profiled Samsung Electronics, Mavenir, Intel Corporation, NEC Corporation, Parallel Wireless, Nokia Corporation, Capgemini, Ericsson, VMware, Cisco Systems Inc
Additional Attributes Dollar sales by component type and network type category, regional demand trends, competitive landscape, buyer preferences for public versus private deployments, integration with cloud platforms, innovations in Open RAN architecture, AI-driven optimization, and edge computing advancement

Virtualized Radio Access Network Market by Segments

Component:

  • Hardware
  • Software
  • Services

Deployment Type:

  • Public
  • Private
  • Hybrid

Network Type:

  • 5G
  • 2G/3G
  • 4G/LTE
  • Others

End Use:

  • Telecommunication Operators
  • Government & Defense
  • Commercial

Region:

North America

  • United States
  • Canada
  • Mexico

Europe

  • Germany
  • United Kingdom
  • France
  • Italy
  • Spain
  • Nordic
  • BENELUX
  • Rest of Europe

East Asia

  • China
  • Japan
  • South Korea

South Asia & Pacific

  • India
  • ASEAN
  • Australia & New Zealand
  • Rest of South Asia & Pacific

Latin America

  • Brazil
  • Chile
  • Rest of Latin America

Middle East & Africa

  • Kingdom of Saudi Arabia
  • Other GCC Countries
  • Turkiye
  • South Africa
  • Other African Union
  • Rest of Middle East & Africa

Table of Content

  1. Executive Summary
    • Global Market Outlook
    • Demand-side Trends
    • Supply-side Trends
    • Technology Roadmap Analysis
    • Analysis and Recommendations
  2. Market Overview
    • Market Coverage / Taxonomy
    • Market Definition / Scope / Limitations
  3. Market Background
    • Market Dynamics
      • Drivers
      • Restraints
      • Opportunity
      • Trends
    • Scenario Forecast
      • Demand in Optimistic Scenario
      • Demand in Likely Scenario
      • Demand in Conservative Scenario
    • Opportunity Map Analysis
    • Product Life Cycle Analysis
    • Supply Chain Analysis
    • Investment Feasibility Matrix
    • Value Chain Analysis
    • PESTLE and Porter’s Analysis
    • Regulatory Landscape
    • Regional Parent Market Outlook
    • Production and Consumption Statistics
    • Import and Export Statistics
  4. Global Virtualized Radio Access Network Market Analysis 2020-2024 and Forecast, 2025-2035
    • Historical Market Size Value (USD Mn) Analysis, 2020-2024
    • Current and Future Market Size Value (USD Mn) Projections, 2025-2035
      • Y-o-Y Growth Trend Analysis
      • Absolute $ Opportunity Analysis
  5. Global Virtualized Radio Access Network Market Pricing Analysis 2020-2024 and Forecast 2025-2035
  6. Global Virtualized Radio Access Network Market Analysis 2020-2024 and Forecast 2025-2035, By Component Outlook
    • Introduction / Key Findings
    • Historical Market Size Value (USD Mn) Analysis By Component Outlook , 2020-2024
    • Current and Future Market Size Value (USD Mn) Analysis and Forecast By Component Outlook , 2025-2035
      • Hardware
      • Software
      • Services
    • Y-o-Y Growth Trend Analysis By Component Outlook , 2020-2024
    • Absolute $ Opportunity Analysis By Component Outlook , 2025-2035
  7. Global Virtualized Radio Access Network Market Analysis 2020-2024 and Forecast 2025-2035, By Deployment Type Outlook
    • Introduction / Key Findings
    • Historical Market Size Value (USD Mn) Analysis By Deployment Type Outlook, 2020-2024
    • Current and Future Market Size Value (USD Mn) Analysis and Forecast By Deployment Type Outlook, 2025-2035
      • Public
      • Private
      • Hybrid
    • Y-o-Y Growth Trend Analysis By Deployment Type Outlook, 2020-2024
    • Absolute $ Opportunity Analysis By Deployment Type Outlook, 2025-2035
  8. Global Virtualized Radio Access Network Market Analysis 2020-2024 and Forecast 2025-2035, By Network Type Outlook
    • Introduction / Key Findings
    • Historical Market Size Value (USD Mn) Analysis By Network Type Outlook, 2020-2024
    • Current and Future Market Size Value (USD Mn) Analysis and Forecast By Network Type Outlook, 2025-2035
      • 5G
      • 2G/3G
      • 4G/LTE
    • Y-o-Y Growth Trend Analysis By Network Type Outlook, 2020-2024
    • Absolute $ Opportunity Analysis By Network Type Outlook, 2025-2035
  9. Global Virtualized Radio Access Network Market Analysis 2020-2024 and Forecast 2025-2035, By End Use Outlook
    • Introduction / Key Findings
    • Historical Market Size Value (USD Mn) Analysis By End Use Outlook, 2020-2024
    • Current and Future Market Size Value (USD Mn) Analysis and Forecast By End Use Outlook, 2025-2035
      • Telecommunication Operators
      • Government & Defense
      • Commercial
      • Others
    • Y-o-Y Growth Trend Analysis By End Use Outlook, 2020-2024
    • Absolute $ Opportunity Analysis By End Use Outlook, 2025-2035
  10. Global Virtualized Radio Access Network Market Analysis 2020-2024 and Forecast 2025-2035, By Region
    • Introduction
    • Historical Market Size Value (USD Mn) Analysis By Region, 2020-2024
    • Current Market Size Value (USD Mn) Analysis and Forecast By Region, 2025-2035
      • North America
      • Latin America
      • Western Europe
      • Eastern Europe
      • East Asia
      • South Asia and Pacific
      • Middle East & Africa
    • Market Attractiveness Analysis By Region
  11. North America Virtualized Radio Access Network Market Analysis 2020-2024 and Forecast 2025-2035, By Country
    • Historical Market Size Value (USD Mn) Trend Analysis By Market Taxonomy, 2020-2024
    • Market Size Value (USD Mn) Forecast By Market Taxonomy, 2025-2035
      • By Country
        • U.S.
        • Canada
        • Mexico
      • By Component Outlook
      • By Deployment Type Outlook
      • By Network Type Outlook
      • By End Use Outlook
    • Market Attractiveness Analysis
      • By Country
      • By Component Outlook
      • By Deployment Type Outlook
      • By Network Type Outlook
      • By End Use Outlook
    • Key Takeaways
  12. Latin America Virtualized Radio Access Network Market Analysis 2020-2024 and Forecast 2025-2035, By Country
    • Historical Market Size Value (USD Mn) Trend Analysis By Market Taxonomy, 2020-2024
    • Market Size Value (USD Mn) Forecast By Market Taxonomy, 2025-2035
      • By Country
        • Brazil
        • Chile
        • Rest of Latin America
      • By Component Outlook
      • By Deployment Type Outlook
      • By Network Type Outlook
      • By End Use Outlook
    • Market Attractiveness Analysis
      • By Country
      • By Component Outlook
      • By Deployment Type Outlook
      • By Network Type Outlook
      • By End Use Outlook
    • Key Takeaways
  13. Western Europe Virtualized Radio Access Network Market Analysis 2020-2024 and Forecast 2025-2035, By Country
    • Historical Market Size Value (USD Mn) Trend Analysis By Market Taxonomy, 2020-2024
    • Market Size Value (USD Mn) Forecast By Market Taxonomy, 2025-2035
      • By Country
        • Germany
        • U.K.
        • Italy
        • Spain
        • France
        • Nordic
        • BENELUX
        • Rest of Western Europe
      • By Component Outlook
      • By Deployment Type Outlook
      • By Network Type Outlook
      • By End Use Outlook
    • Market Attractiveness Analysis
      • By Country
      • By Component Outlook
      • By Deployment Type Outlook
      • By Network Type Outlook
      • By End Use Outlook
    • Key Takeaways
  14. Eastern Europe Virtualized Radio Access Network Market Analysis 2020-2024 and Forecast 2025-2035, By Country
    • Historical Market Size Value (USD Mn) Trend Analysis By Market Taxonomy, 2020-2024
    • Market Size Value (USD Mn) Forecast By Market Taxonomy, 2025-2035
      • By Country
        • Russia
        • Poland
        • Hungary
        • Balkan & Baltic
        • Rest of Eastern Europe
      • By Component Outlook
      • By Deployment Type Outlook
      • By Network Type Outlook
      • By End Use Outlook
    • Market Attractiveness Analysis
      • By Country
      • By Component Outlook
      • By Deployment Type Outlook
      • By Network Type Outlook
      • By End Use Outlook
    • Key Takeaways
  15. East Asia Virtualized Radio Access Network Market Analysis 2020-2024 and Forecast 2025-2035, By Country
    • Historical Market Size Value (USD Mn) Trend Analysis By Market Taxonomy, 2020-2024
    • Market Size Value (USD Mn) Forecast By Market Taxonomy, 2025-2035
      • By Country
        • China
        • Japan
        • South Korea
      • By Component Outlook
      • By Deployment Type Outlook
      • By Network Type Outlook
      • By End Use Outlook
    • Market Attractiveness Analysis
      • By Country
      • By Component Outlook
      • By Deployment Type Outlook
      • By Network Type Outlook
      • By End Use Outlook
    • Key Takeaways
  16. South Asia and Pacific Virtualized Radio Access Network Market Analysis 2020-2024 and Forecast 2025-2035, By Country
    • Historical Market Size Value (USD Mn) Trend Analysis By Market Taxonomy, 2020-2024
    • Market Size Value (USD Mn) Forecast By Market Taxonomy, 2025-2035
      • By Country
        • India
        • ASEAN
        • Australia & New Zealand
        • Rest of South Asia and Pacific
      • By Component Outlook
      • By Deployment Type Outlook
      • By Network Type Outlook
      • By End Use Outlook
    • Market Attractiveness Analysis
      • By Country
      • By Component Outlook
      • By Deployment Type Outlook
      • By Network Type Outlook
      • By End Use Outlook
    • Key Takeaways
  17. Middle East & Africa Virtualized Radio Access Network Market Analysis 2020-2024 and Forecast 2025-2035, By Country
    • Historical Market Size Value (USD Mn) Trend Analysis By Market Taxonomy, 2020-2024
    • Market Size Value (USD Mn) Forecast By Market Taxonomy, 2025-2035
      • By Country
        • Kingdom of Saudi Arabia
        • Other GCC Countries
        • Turkiye
        • South Africa
        • Other African Union
        • Rest of Middle East & Africa
      • By Component Outlook
      • By Deployment Type Outlook
      • By Network Type Outlook
      • By End Use Outlook
    • Market Attractiveness Analysis
      • By Country
      • By Component Outlook
      • By Deployment Type Outlook
      • By Network Type Outlook
      • By End Use Outlook
    • Key Takeaways
  18. Key Countries Virtualized Radio Access Network Market Analysis
    • U.S.
      • Pricing Analysis
      • Market Share Analysis, 2024
        • By Component Outlook
        • By Deployment Type Outlook
        • By Network Type Outlook
        • By End Use Outlook
    • Canada
      • Pricing Analysis
      • Market Share Analysis, 2024
        • By Component Outlook
        • By Deployment Type Outlook
        • By Network Type Outlook
        • By End Use Outlook
    • Mexico
      • Pricing Analysis
      • Market Share Analysis, 2024
        • By Component Outlook
        • By Deployment Type Outlook
        • By Network Type Outlook
        • By End Use Outlook
    • Brazil
      • Pricing Analysis
      • Market Share Analysis, 2024
        • By Component Outlook
        • By Deployment Type Outlook
        • By Network Type Outlook
        • By End Use Outlook
    • Chile
      • Pricing Analysis
      • Market Share Analysis, 2024
        • By Component Outlook
        • By Deployment Type Outlook
        • By Network Type Outlook
        • By End Use Outlook
    • Germany
      • Pricing Analysis
      • Market Share Analysis, 2024
        • By Component Outlook
        • By Deployment Type Outlook
        • By Network Type Outlook
        • By End Use Outlook
    • U.K.
      • Pricing Analysis
      • Market Share Analysis, 2024
        • By Component Outlook
        • By Deployment Type Outlook
        • By Network Type Outlook
        • By End Use Outlook
    • Italy
      • Pricing Analysis
      • Market Share Analysis, 2024
        • By Component Outlook
        • By Deployment Type Outlook
        • By Network Type Outlook
        • By End Use Outlook
    • Spain
      • Pricing Analysis
      • Market Share Analysis, 2024
        • By Component Outlook
        • By Deployment Type Outlook
        • By Network Type Outlook
        • By End Use Outlook
    • France
      • Pricing Analysis
      • Market Share Analysis, 2024
        • By Component Outlook
        • By Deployment Type Outlook
        • By Network Type Outlook
        • By End Use Outlook
    • India
      • Pricing Analysis
      • Market Share Analysis, 2024
        • By Component Outlook
        • By Deployment Type Outlook
        • By Network Type Outlook
        • By End Use Outlook
    • ASEAN
      • Pricing Analysis
      • Market Share Analysis, 2024
        • By Component Outlook
        • By Deployment Type Outlook
        • By Network Type Outlook
        • By End Use Outlook
    • Australia & New Zealand
      • Pricing Analysis
      • Market Share Analysis, 2024
        • By Component Outlook
        • By Deployment Type Outlook
        • By Network Type Outlook
        • By End Use Outlook
    • China
      • Pricing Analysis
      • Market Share Analysis, 2024
        • By Component Outlook
        • By Deployment Type Outlook
        • By Network Type Outlook
        • By End Use Outlook
    • Japan
      • Pricing Analysis
      • Market Share Analysis, 2024
        • By Component Outlook
        • By Deployment Type Outlook
        • By Network Type Outlook
        • By End Use Outlook
    • South Korea
      • Pricing Analysis
      • Market Share Analysis, 2024
        • By Component Outlook
        • By Deployment Type Outlook
        • By Network Type Outlook
        • By End Use Outlook
    • Russia
      • Pricing Analysis
      • Market Share Analysis, 2024
        • By Component Outlook
        • By Deployment Type Outlook
        • By Network Type Outlook
        • By End Use Outlook
    • Poland
      • Pricing Analysis
      • Market Share Analysis, 2024
        • By Component Outlook
        • By Deployment Type Outlook
        • By Network Type Outlook
        • By End Use Outlook
    • Hungary
      • Pricing Analysis
      • Market Share Analysis, 2024
        • By Component Outlook
        • By Deployment Type Outlook
        • By Network Type Outlook
        • By End Use Outlook
    • Kingdom of Saudi Arabia
      • Pricing Analysis
      • Market Share Analysis, 2024
        • By Component Outlook
        • By Deployment Type Outlook
        • By Network Type Outlook
        • By End Use Outlook
    • Turkiye
      • Pricing Analysis
      • Market Share Analysis, 2024
        • By Component Outlook
        • By Deployment Type Outlook
        • By Network Type Outlook
        • By End Use Outlook
    • South Africa
      • Pricing Analysis
      • Market Share Analysis, 2024
        • By Component Outlook
        • By Deployment Type Outlook
        • By Network Type Outlook
        • By End Use Outlook
  19. Market Structure Analysis
    • Competition Dashboard
    • Competition Benchmarking
    • Market Share Analysis of Top Players
      • By Regional
      • By Component Outlook
      • By Deployment Type Outlook
      • By Network Type Outlook
      • By End Use Outlook
  20. Competition Analysis
    • Competition Deep Dive
      • Samsung
        • Overview
        • Product Portfolio
        • Profitability by Market Segments (Product/Age /Sales Channel/Region)
        • Sales Footprint
        • Strategy Overview
          • Marketing Strategy
          • Product Strategy
          • Channel Strategy
      • Mavenir
      • Intel Corporation
      • NEC Corporation
      • Parallel Wireless
      • Nokia Corporation
      • Capgemini
      • Ericsson
      • VMware
      • Cisco Systems, Inc.
      • i-SENS, Inc.
      • F. Hoffmann-La Roche Ltd.
  21. Assumptions & Acronyms Used
  22. Research Methodology

List of Tables

  • Table 1: Global Virtualized Radio Access Network Market Value (USD Mn) Forecast by Region, 2020-2035
  • Table 2: Global Virtualized Radio Access Network Market Value (USD Mn) Forecast by Component Outlook , 2020-2035
  • Table 3: Global Virtualized Radio Access Network Market Value (USD Mn) Forecast by Deployment Type Outlook, 2020-2035
  • Table 4: Global Virtualized Radio Access Network Market Value (USD Mn) Forecast by Network Type Outlook, 2020-2035
  • Table 5: Global Virtualized Radio Access Network Market Value (USD Mn) Forecast by End Use Outlook, 2020-2035
  • Table 6: North America Virtualized Radio Access Network Market Value (USD Mn) Forecast by Country, 2020-2035
  • Table 7: North America Virtualized Radio Access Network Market Value (USD Mn) Forecast by Component Outlook , 2020-2035
  • Table 8: North America Virtualized Radio Access Network Market Value (USD Mn) Forecast by Deployment Type Outlook, 2020-2035
  • Table 9: North America Virtualized Radio Access Network Market Value (USD Mn) Forecast by Network Type Outlook, 2020-2035
  • Table 10: North America Virtualized Radio Access Network Market Value (USD Mn) Forecast by End Use Outlook, 2020-2035
  • Table 11: Latin America Virtualized Radio Access Network Market Value (USD Mn) Forecast by Country, 2020-2035
  • Table 12: Latin America Virtualized Radio Access Network Market Value (USD Mn) Forecast by Component Outlook , 2020-2035
  • Table 13: Latin America Virtualized Radio Access Network Market Value (USD Mn) Forecast by Deployment Type Outlook, 2020-2035
  • Table 14: Latin America Virtualized Radio Access Network Market Value (USD Mn) Forecast by Network Type Outlook, 2020-2035
  • Table 15: Latin America Virtualized Radio Access Network Market Value (USD Mn) Forecast by End Use Outlook, 2020-2035
  • Table 16: Western Europe Virtualized Radio Access Network Market Value (USD Mn) Forecast by Country, 2020-2035
  • Table 17: Western Europe Virtualized Radio Access Network Market Value (USD Mn) Forecast by Component Outlook , 2020-2035
  • Table 18: Western Europe Virtualized Radio Access Network Market Value (USD Mn) Forecast by Deployment Type Outlook, 2020-2035
  • Table 19: Western Europe Virtualized Radio Access Network Market Value (USD Mn) Forecast by Network Type Outlook, 2020-2035
  • Table 20: Western Europe Virtualized Radio Access Network Market Value (USD Mn) Forecast by End Use Outlook, 2020-2035
  • Table 21: Eastern Europe Virtualized Radio Access Network Market Value (USD Mn) Forecast by Country, 2020-2035
  • Table 22: Eastern Europe Virtualized Radio Access Network Market Value (USD Mn) Forecast by Component Outlook , 2020-2035
  • Table 23: Eastern Europe Virtualized Radio Access Network Market Value (USD Mn) Forecast by Deployment Type Outlook, 2020-2035
  • Table 24: Eastern Europe Virtualized Radio Access Network Market Value (USD Mn) Forecast by Network Type Outlook, 2020-2035
  • Table 25: Eastern Europe Virtualized Radio Access Network Market Value (USD Mn) Forecast by End Use Outlook, 2020-2035
  • Table 26: East Asia Virtualized Radio Access Network Market Value (USD Mn) Forecast by Country, 2020-2035
  • Table 27: East Asia Virtualized Radio Access Network Market Value (USD Mn) Forecast by Component Outlook , 2020-2035
  • Table 28: East Asia Virtualized Radio Access Network Market Value (USD Mn) Forecast by Deployment Type Outlook, 2020-2035
  • Table 29: East Asia Virtualized Radio Access Network Market Value (USD Mn) Forecast by Network Type Outlook, 2020-2035
  • Table 30: East Asia Virtualized Radio Access Network Market Value (USD Mn) Forecast by End Use Outlook, 2020-2035
  • Table 31: South Asia and Pacific Virtualized Radio Access Network Market Value (USD Mn) Forecast by Country, 2020-2035
  • Table 32: South Asia and Pacific Virtualized Radio Access Network Market Value (USD Mn) Forecast by Component Outlook , 2020-2035
  • Table 33: South Asia and Pacific Virtualized Radio Access Network Market Value (USD Mn) Forecast by Deployment Type Outlook, 2020-2035
  • Table 34: South Asia and Pacific Virtualized Radio Access Network Market Value (USD Mn) Forecast by Network Type Outlook, 2020-2035
  • Table 35: South Asia and Pacific Virtualized Radio Access Network Market Value (USD Mn) Forecast by End Use Outlook, 2020-2035
  • Table 36: Middle East & Africa Virtualized Radio Access Network Market Value (USD Mn) Forecast by Country, 2020-2035
  • Table 37: Middle East & Africa Virtualized Radio Access Network Market Value (USD Mn) Forecast by Component Outlook , 2020-2035
  • Table 38: Middle East & Africa Virtualized Radio Access Network Market Value (USD Mn) Forecast by Deployment Type Outlook, 2020-2035
  • Table 39: Middle East & Africa Virtualized Radio Access Network Market Value (USD Mn) Forecast by Network Type Outlook, 2020-2035
  • Table 40: Middle East & Africa Virtualized Radio Access Network Market Value (USD Mn) Forecast by End Use Outlook, 2020-2035

List of Figures

  • Figure 1: Global Virtualized Radio Access Network Market Pricing Analysis
  • Figure 2: Global Virtualized Radio Access Network Market Value (USD Mn) Forecast 2020–2035
  • Figure 3: Global Virtualized Radio Access Network Market Value Share and BPS Analysis by Component Outlook , 2025 and 2035
  • Figure 4: Global Virtualized Radio Access Network Market Y-o-Y Growth Comparison by Component Outlook , 2025–2035
  • Figure 5: Global Virtualized Radio Access Network Market Attractiveness Analysis by Component Outlook
  • Figure 6: Global Virtualized Radio Access Network Market Value Share and BPS Analysis by Deployment Type Outlook, 2025 and 2035
  • Figure 7: Global Virtualized Radio Access Network Market Y-o-Y Growth Comparison by Deployment Type Outlook, 2025–2035
  • Figure 8: Global Virtualized Radio Access Network Market Attractiveness Analysis by Deployment Type Outlook
  • Figure 9: Global Virtualized Radio Access Network Market Value Share and BPS Analysis by Network Type Outlook, 2025 and 2035
  • Figure 10: Global Virtualized Radio Access Network Market Y-o-Y Growth Comparison by Network Type Outlook, 2025–2035
  • Figure 11: Global Virtualized Radio Access Network Market Attractiveness Analysis by Network Type Outlook
  • Figure 12: Global Virtualized Radio Access Network Market Value Share and BPS Analysis by End Use Outlook, 2025 and 2035
  • Figure 13: Global Virtualized Radio Access Network Market Y-o-Y Growth Comparison by End Use Outlook, 2025–2035
  • Figure 14: Global Virtualized Radio Access Network Market Attractiveness Analysis by End Use Outlook
  • Figure 15: Global Virtualized Radio Access Network Market Value (USD Mn) Share and BPS Analysis by Region, 2025 and 2035
  • Figure 16: Global Virtualized Radio Access Network Market Y-o-Y Growth Comparison by Region, 2025–2035
  • Figure 17: Global Virtualized Radio Access Network Market Attractiveness Analysis by Region
  • Figure 18: North America Virtualized Radio Access Network Market Incremental Dollar Opportunity, 2025–2035
  • Figure 19: Latin America Virtualized Radio Access Network Market Incremental Dollar Opportunity, 2025–2035
  • Figure 20: Western Europe Virtualized Radio Access Network Market Incremental Dollar Opportunity, 2025–2035
  • Figure 21: Eastern Europe Virtualized Radio Access Network Market Incremental Dollar Opportunity, 2025–2035
  • Figure 22: East Asia Virtualized Radio Access Network Market Incremental Dollar Opportunity, 2025–2035
  • Figure 23: South Asia and Pacific Virtualized Radio Access Network Market Incremental Dollar Opportunity, 2025–2035
  • Figure 24: Middle East & Africa Virtualized Radio Access Network Market Incremental Dollar Opportunity, 2025–2035
  • Figure 25: North America Virtualized Radio Access Network Market Value Share and BPS Analysis by Country, 2025 and 2035
  • Figure 26: North America Virtualized Radio Access Network Market Value Share and BPS Analysis by Component Outlook , 2025 and 2035
  • Figure 27: North America Virtualized Radio Access Network Market Y-o-Y Growth Comparison by Component Outlook , 2025–2035
  • Figure 28: North America Virtualized Radio Access Network Market Attractiveness Analysis by Component Outlook
  • Figure 29: North America Virtualized Radio Access Network Market Value Share and BPS Analysis by Deployment Type Outlook, 2025 and 2035
  • Figure 30: North America Virtualized Radio Access Network Market Y-o-Y Growth Comparison by Deployment Type Outlook, 2025–2035
  • Figure 31: North America Virtualized Radio Access Network Market Attractiveness Analysis by Deployment Type Outlook
  • Figure 32: North America Virtualized Radio Access Network Market Value Share and BPS Analysis by Network Type Outlook, 2025 and 2035
  • Figure 33: North America Virtualized Radio Access Network Market Y-o-Y Growth Comparison by Network Type Outlook, 2025–2035
  • Figure 34: North America Virtualized Radio Access Network Market Attractiveness Analysis by Network Type Outlook
  • Figure 35: North America Virtualized Radio Access Network Market Value Share and BPS Analysis by End Use Outlook, 2025 and 2035
  • Figure 36: North America Virtualized Radio Access Network Market Y-o-Y Growth Comparison by End Use Outlook, 2025–2035
  • Figure 37: North America Virtualized Radio Access Network Market Attractiveness Analysis by End Use Outlook
  • Figure 38: Latin America Virtualized Radio Access Network Market Value Share and BPS Analysis by Country, 2025 and 2035
  • Figure 39: Latin America Virtualized Radio Access Network Market Value Share and BPS Analysis by Component Outlook , 2025 and 2035
  • Figure 40: Latin America Virtualized Radio Access Network Market Y-o-Y Growth Comparison by Component Outlook , 2025–2035
  • Figure 41: Latin America Virtualized Radio Access Network Market Attractiveness Analysis by Component Outlook
  • Figure 42: Latin America Virtualized Radio Access Network Market Value Share and BPS Analysis by Deployment Type Outlook, 2025 and 2035
  • Figure 43: Latin America Virtualized Radio Access Network Market Y-o-Y Growth Comparison by Deployment Type Outlook, 2025–2035
  • Figure 44: Latin America Virtualized Radio Access Network Market Attractiveness Analysis by Deployment Type Outlook
  • Figure 45: Latin America Virtualized Radio Access Network Market Value Share and BPS Analysis by Network Type Outlook, 2025 and 2035
  • Figure 46: Latin America Virtualized Radio Access Network Market Y-o-Y Growth Comparison by Network Type Outlook, 2025–2035
  • Figure 47: Latin America Virtualized Radio Access Network Market Attractiveness Analysis by Network Type Outlook
  • Figure 48: Latin America Virtualized Radio Access Network Market Value Share and BPS Analysis by End Use Outlook, 2025 and 2035
  • Figure 49: Latin America Virtualized Radio Access Network Market Y-o-Y Growth Comparison by End Use Outlook, 2025–2035
  • Figure 50: Latin America Virtualized Radio Access Network Market Attractiveness Analysis by End Use Outlook
  • Figure 51: Western Europe Virtualized Radio Access Network Market Value Share and BPS Analysis by Country, 2025 and 2035
  • Figure 52: Western Europe Virtualized Radio Access Network Market Value Share and BPS Analysis by Component Outlook , 2025 and 2035
  • Figure 53: Western Europe Virtualized Radio Access Network Market Y-o-Y Growth Comparison by Component Outlook , 2025–2035
  • Figure 54: Western Europe Virtualized Radio Access Network Market Attractiveness Analysis by Component Outlook
  • Figure 55: Western Europe Virtualized Radio Access Network Market Value Share and BPS Analysis by Deployment Type Outlook, 2025 and 2035
  • Figure 56: Western Europe Virtualized Radio Access Network Market Y-o-Y Growth Comparison by Deployment Type Outlook, 2025–2035
  • Figure 57: Western Europe Virtualized Radio Access Network Market Attractiveness Analysis by Deployment Type Outlook
  • Figure 58: Western Europe Virtualized Radio Access Network Market Value Share and BPS Analysis by Network Type Outlook, 2025 and 2035
  • Figure 59: Western Europe Virtualized Radio Access Network Market Y-o-Y Growth Comparison by Network Type Outlook, 2025–2035
  • Figure 60: Western Europe Virtualized Radio Access Network Market Attractiveness Analysis by Network Type Outlook
  • Figure 61: Western Europe Virtualized Radio Access Network Market Value Share and BPS Analysis by End Use Outlook, 2025 and 2035
  • Figure 62: Western Europe Virtualized Radio Access Network Market Y-o-Y Growth Comparison by End Use Outlook, 2025–2035
  • Figure 63: Western Europe Virtualized Radio Access Network Market Attractiveness Analysis by End Use Outlook
  • Figure 64: Eastern Europe Virtualized Radio Access Network Market Value Share and BPS Analysis by Country, 2025 and 2035
  • Figure 65: Eastern Europe Virtualized Radio Access Network Market Value Share and BPS Analysis by Component Outlook , 2025 and 2035
  • Figure 66: Eastern Europe Virtualized Radio Access Network Market Y-o-Y Growth Comparison by Component Outlook , 2025–2035
  • Figure 67: Eastern Europe Virtualized Radio Access Network Market Attractiveness Analysis by Component Outlook
  • Figure 68: Eastern Europe Virtualized Radio Access Network Market Value Share and BPS Analysis by Deployment Type Outlook, 2025 and 2035
  • Figure 69: Eastern Europe Virtualized Radio Access Network Market Y-o-Y Growth Comparison by Deployment Type Outlook, 2025–2035
  • Figure 70: Eastern Europe Virtualized Radio Access Network Market Attractiveness Analysis by Deployment Type Outlook
  • Figure 71: Eastern Europe Virtualized Radio Access Network Market Value Share and BPS Analysis by Network Type Outlook, 2025 and 2035
  • Figure 72: Eastern Europe Virtualized Radio Access Network Market Y-o-Y Growth Comparison by Network Type Outlook, 2025–2035
  • Figure 73: Eastern Europe Virtualized Radio Access Network Market Attractiveness Analysis by Network Type Outlook
  • Figure 74: Eastern Europe Virtualized Radio Access Network Market Value Share and BPS Analysis by End Use Outlook, 2025 and 2035
  • Figure 75: Eastern Europe Virtualized Radio Access Network Market Y-o-Y Growth Comparison by End Use Outlook, 2025–2035
  • Figure 76: Eastern Europe Virtualized Radio Access Network Market Attractiveness Analysis by End Use Outlook
  • Figure 77: East Asia Virtualized Radio Access Network Market Value Share and BPS Analysis by Country, 2025 and 2035
  • Figure 78: East Asia Virtualized Radio Access Network Market Value Share and BPS Analysis by Component Outlook , 2025 and 2035
  • Figure 79: East Asia Virtualized Radio Access Network Market Y-o-Y Growth Comparison by Component Outlook , 2025–2035
  • Figure 80: East Asia Virtualized Radio Access Network Market Attractiveness Analysis by Component Outlook
  • Figure 81: East Asia Virtualized Radio Access Network Market Value Share and BPS Analysis by Deployment Type Outlook, 2025 and 2035
  • Figure 82: East Asia Virtualized Radio Access Network Market Y-o-Y Growth Comparison by Deployment Type Outlook, 2025–2035
  • Figure 83: East Asia Virtualized Radio Access Network Market Attractiveness Analysis by Deployment Type Outlook
  • Figure 84: East Asia Virtualized Radio Access Network Market Value Share and BPS Analysis by Network Type Outlook, 2025 and 2035
  • Figure 85: East Asia Virtualized Radio Access Network Market Y-o-Y Growth Comparison by Network Type Outlook, 2025–2035
  • Figure 86: East Asia Virtualized Radio Access Network Market Attractiveness Analysis by Network Type Outlook
  • Figure 87: East Asia Virtualized Radio Access Network Market Value Share and BPS Analysis by End Use Outlook, 2025 and 2035
  • Figure 88: East Asia Virtualized Radio Access Network Market Y-o-Y Growth Comparison by End Use Outlook, 2025–2035
  • Figure 89: East Asia Virtualized Radio Access Network Market Attractiveness Analysis by End Use Outlook
  • Figure 90: South Asia and Pacific Virtualized Radio Access Network Market Value Share and BPS Analysis by Country, 2025 and 2035
  • Figure 91: South Asia and Pacific Virtualized Radio Access Network Market Value Share and BPS Analysis by Component Outlook , 2025 and 2035
  • Figure 92: South Asia and Pacific Virtualized Radio Access Network Market Y-o-Y Growth Comparison by Component Outlook , 2025–2035
  • Figure 93: South Asia and Pacific Virtualized Radio Access Network Market Attractiveness Analysis by Component Outlook
  • Figure 94: South Asia and Pacific Virtualized Radio Access Network Market Value Share and BPS Analysis by Deployment Type Outlook, 2025 and 2035
  • Figure 95: South Asia and Pacific Virtualized Radio Access Network Market Y-o-Y Growth Comparison by Deployment Type Outlook, 2025–2035
  • Figure 96: South Asia and Pacific Virtualized Radio Access Network Market Attractiveness Analysis by Deployment Type Outlook
  • Figure 97: South Asia and Pacific Virtualized Radio Access Network Market Value Share and BPS Analysis by Network Type Outlook, 2025 and 2035
  • Figure 98: South Asia and Pacific Virtualized Radio Access Network Market Y-o-Y Growth Comparison by Network Type Outlook, 2025–2035
  • Figure 99: South Asia and Pacific Virtualized Radio Access Network Market Attractiveness Analysis by Network Type Outlook
  • Figure 100: South Asia and Pacific Virtualized Radio Access Network Market Value Share and BPS Analysis by End Use Outlook, 2025 and 2035
  • Figure 101: South Asia and Pacific Virtualized Radio Access Network Market Y-o-Y Growth Comparison by End Use Outlook, 2025–2035
  • Figure 102: South Asia and Pacific Virtualized Radio Access Network Market Attractiveness Analysis by End Use Outlook
  • Figure 103: Middle East & Africa Virtualized Radio Access Network Market Value Share and BPS Analysis by Country, 2025 and 2035
  • Figure 104: Middle East & Africa Virtualized Radio Access Network Market Value Share and BPS Analysis by Component Outlook , 2025 and 2035
  • Figure 105: Middle East & Africa Virtualized Radio Access Network Market Y-o-Y Growth Comparison by Component Outlook , 2025–2035
  • Figure 106: Middle East & Africa Virtualized Radio Access Network Market Attractiveness Analysis by Component Outlook
  • Figure 107: Middle East & Africa Virtualized Radio Access Network Market Value Share and BPS Analysis by Deployment Type Outlook, 2025 and 2035
  • Figure 108: Middle East & Africa Virtualized Radio Access Network Market Y-o-Y Growth Comparison by Deployment Type Outlook, 2025–2035
  • Figure 109: Middle East & Africa Virtualized Radio Access Network Market Attractiveness Analysis by Deployment Type Outlook
  • Figure 110: Middle East & Africa Virtualized Radio Access Network Market Value Share and BPS Analysis by Network Type Outlook, 2025 and 2035
  • Figure 111: Middle East & Africa Virtualized Radio Access Network Market Y-o-Y Growth Comparison by Network Type Outlook, 2025–2035
  • Figure 112: Middle East & Africa Virtualized Radio Access Network Market Attractiveness Analysis by Network Type Outlook
  • Figure 113: Middle East & Africa Virtualized Radio Access Network Market Value Share and BPS Analysis by End Use Outlook, 2025 and 2035
  • Figure 114: Middle East & Africa Virtualized Radio Access Network Market Y-o-Y Growth Comparison by End Use Outlook, 2025–2035
  • Figure 115: Middle East & Africa Virtualized Radio Access Network Market Attractiveness Analysis by End Use Outlook
  • Figure 116: Global Virtualized Radio Access Network Market – Tier Structure Analysis
  • Figure 117: Global Virtualized Radio Access Network Market – Company Share Analysis

Frequently Asked Questions

How big is the virtualized radio access network market in 2025?

The global virtualized radio access network market is estimated to be valued at USD 19.9 billion in 2025.

What will be the size of virtualized radio access network market in 2035?

The market size for the virtualized radio access network market is projected to reach USD 117.9 billion by 2035.

How much will be the virtualized radio access network market growth between 2025 and 2035?

The virtualized radio access network market is expected to grow at a 19.5% CAGR between 2025 and 2035.

What are the key product types in the virtualized radio access network market?

The key product types in virtualized radio access network market are hardware, software and services.

Which deployment type outlook  segment to contribute significant share in the virtualized radio access network market in 2025?

In terms of deployment type outlook , public segment to command 52.0% share in the virtualized radio access network market in 2025.

Explore Similar Insights

Future Market Insights

Virtualized Radio Access Network Market

Chat With

MaRIA

Hi There, I am MaRIA, Your Market Research Intelligence Assistant. How may I help you?