Radiopharmaceutical Logistics Market Size and Share Forecast Outlook 2025 to 2035

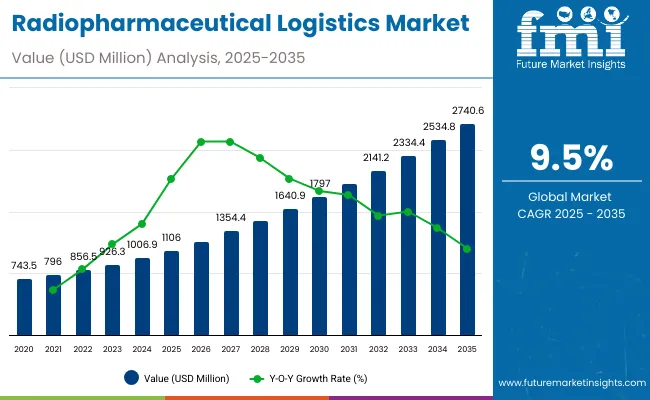
The global Radiopharmaceutical Logistics Market is projected to reach a valuation of USD 1,106.0 million by 2025 and USD 2,740.6 million by 2035. This indicates a decade-long increase of USD 1,634.9 million between 2025 and 2035. The market is expected to expand at a CAGR of 9.5%, representing a 2.48X increase over the ten-year period.
Quick Stats for Radiopharmaceutical Logistics Market

  • Industry Value (2025): USD 1,106.0 million
  • Forecast Value (2035): USD 2,740.6 million
  • Forecast CAGR: 9.5%
  • Leading Segment in 2025 (Mode of Transportation): Ground Transport (38.0% share)
  • Key Growth Region: Asia Pacific, Europe and North America
  • Top Key Players: PHSE S.r.l., Life Couriers, Orchestra Life Sciences, MNX (UPS Company), Corvidae Logistics, AirNet II LLC., Medi-Ops, Lab Carriers, Kalitta Charters, B.P.L. GmbH

Radiopharmaceutical Logistics Market

Metric Value
Industry Size (2025E) USD 1,106.0 million
Industry Value (2035F) USD 2,740.6 million
CAGR (2025 to 2035) 9.5%

During the first five-year period from 2025 to 2030, the global radiopharmaceutical logistics market is projected to expand from USD 1,106.0 million to USD 1,741.1 million, adding approximately USD 1,797.0 million in value. This increase accounts for 42.3% of the total decade growth (2025-2035), reflecting the rising demand for time-sensitive and temperature-controlled delivery of nuclear medicine products. Air Freight will remain the dominant mode of transportation, accounting for around 50.0% of the market by 2030, driven by the continued globalization of radiopharmaceutical supply chains and increasing reliance on imported isotopes. Ground Transport will also hold significant relevance with a share close to 39.0%, particularly for intra-regional distribution to hospitals and centralized radiopharmacies.

During the second half of the decade, from 2030 to 2035, the global radiopharmaceutical logistics market is projected to grow from USD 1,741.1 million to USD 2,740.6 million, adding approximately USD 943.9million in market value. This surge contributes to 57.7% of the total decade growth, reflecting a sharp acceleration in demand driven by the widespread clinical adoption of radiotheranostics, decentralization of isotope production, and increasing investments in cold chain infrastructure across emerging markets.

From 2020 to 2024, the global Radiopharmaceutical Logistics Market expanded from USD 743.5 million to USD 1,006.9million, driven by the rapid uptake of nuclear imaging procedures and growing emphasis on cold chain integrity in life sciences logistics. This early growth phase was powered by expanding demand for both diagnostic and therapeutic isotopes across hospitals and imaging centers. Leading logistics providers such as PHSE S.r.l., MNX Global Logistics, and Orchestra Life Sciences collectively accounted for nearly 52.5% of the global market revenue during this period. These players leveraged integrated networks, time-critical transport capabilities, and strong regulatory compliance infrastructure to deliver value-added services tailored for radiopharmaceutical supply chains.

In 2025, the Global Radiopharmaceutical Logistics Market is expected to reach a value of approximately USD 1,106.0 million, fueled by the increasing demand for timely, compliant, and temperature-controlled delivery of radiopharmaceuticals. This growth reflects a market-wide shift from traditional medical courier services to specialized, precision-driven logistics ecosystems capable of handling radioactive materials with stringent time and safety constraints.

Why Is This Market Growing?

The Global Radiopharmaceutical Logistics Market is experiencing strong growth as nuclear medicine becomes increasingly central to both diagnostic imaging and targeted cancer therapies. Healthcare providers worldwide face mounting pressure to ensure the safe, compliant, and time-sensitive transport of radioactive isotopes, especially those with ultra-short half-lives, such as Fluorine-18 and Carbon-11.Innovations in the logistics space such as AI-based route optimization, sensor-integrated cold chain packaging, and real-time tracking dashboards are helping reduce isotope spoilage, minimize delivery delays, and enhance overall clinical reliability.

These solutions also enable hospitals and radiopharmacies to generate measurable ROI by optimizing workflow and avoiding costly re-dosing or treatment cancellations. As hospital budgets increasingly prioritize dose accuracy, regulatory compliance, and patient safety, logistics providers offering validated packaging, chain-of-custody traceability, and comprehensive SLA-backed delivery models are achieving robust contract wins and client retention.

Segmental Analysis

The Global Radiopharmaceutical Logistics Market is segmented by service type, mode of transportation, packaging temperature range, end user, and region, reflecting the diverse logistical requirements of nuclear medicine products across diagnostic and therapeutic domains. Service Type segment is classified into: Standard Delivery Services, and Time-Critical Delivery Services. Mode of Transportation segment includes: Ground Transport, Air Freight, and Multi-modal Transport. Packaging Temperature Range is segmented into Ambient (15°C - 25°C), Refrigerated (2°C - 8°C), Frozen (-20°C), and Cryogenic (-80°C to -190°C). End user segment includes Hospitals, Diagnostic Imaging Centers, Cancer Clinics / Radiotherapy Centers, Radiopharmacies & Centralized Preparation Labs, Research Institutes & CROs, and CDMOs/CMOs.

Insights into the Service Type Segment with Standard Delivery Services Leading in Market Share

Service Type Market Share (%)
Standard Delivery Services 54.7%
Time-critical Delivery Services 45.3%

Standard Delivery Services are expected to retain a dominant position in the global radiopharmaceutical logistics market, contributing approximately 54.7% of total market value in 2025. This dominance is primarily driven by the growing availability of radioisotopes with longer half-lives and the expansion of scheduled, routine nuclear medicine workflows across hospitals and diagnostic imaging centers. Their adoption has been steadily rising as healthcare systems prioritize predictable, cost-effective logistics models that ensure regulatory-compliant delivery without the premium cost or operational complexity of ultra-expedited shipments. These services are particularly well-suited for the distribution of radiopharmaceuticals like Lutetium-177 or Iodine-123, which allow for extended handling and delivery windows.
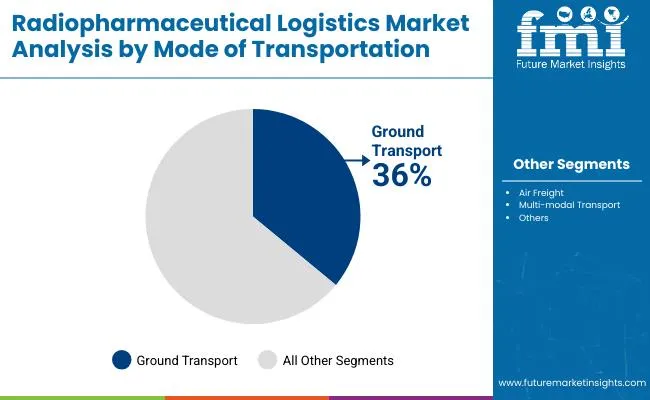
Insights into the Mode of Transportation Segment with Air Freight Dominating the Demand

Radiopharmaceutical Logistics Market By Mode

Mode of Transportation Market Share (%)
Ground Transport 36.0%
Air Freight 30.0%
Multi-modal Transport 10.0%

Air Freight has emerged as the leading mode of transportation in the global radiopharmaceutical logistics market and is projected to account for approximately 48.6% of total market share in 2025, driven by the increasing need for fast, reliable, and compliant delivery of time-sensitive isotopes. As radiopharmaceuticals like Fluorine-18, Gallium-68, and Carbon-11 require delivery within a few hours of synthesis, air transport has become essential to meeting the tight timelines demanded by PET and SPECT procedures. This dominance is further reinforced by the rising international movement of radioisotopes, especially in regions where in-house cyclotron infrastructure is limited. Countries in Asia Pacific, Latin America, and parts of Eastern Europe rely on regional or global suppliers, necessitating air freight for efficient cross-border delivery.
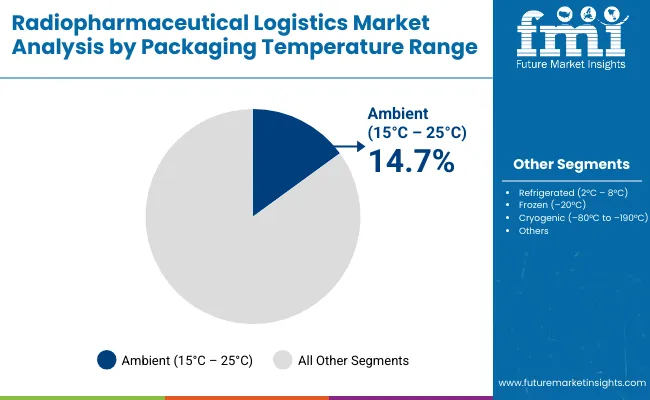
Insights into the Packaging Temperature Range Segment with Refrigerated (2°C - 8°C) the demand

Radiopharmaceutical Logistics Market By Packaging

Packaging Temperature Range Market Share (%)
Ambient (15°C - 25°C) 14.7%
Refrigerated (2°C - 8°C) 43.6%
Frozen (-20°C) 32.9%
Cryogenic (-80°C to -190°C) 8.8%

Refrigerated Packaging (2°C - 8°C) is expected to remain the largest and most critical temperature range segment in the global radiopharmaceutical logistics market, accounting for approximately 43.6% of market share in 2025. This segment is driven by the widespread use of diagnostic and therapeutic radiopharmaceuticals that require stable, low-temperature conditions to maintain potency and shelf life during transit. Most commonly used isotopes including Lutetium-177, Iodine-123, and Technetium-99m-based compounds, require refrigerated transport to ensure chemical stability and radiological efficacy, especially in multi-leg journeys between cyclotrons, radiopharmacies, and end-use clinical sites. The sustained dominance of the refrigerated segment is being reinforced by:

  • Tightened regulatory standards from IAEA, FDA, and EANM regarding cold chain integrity for radioactive pharmaceuticals
  • Greater adoption of centralized radiopharmacy models, which necessitate temperature-controlled transport over longer distances
  • Growing use of radiotheranostics, which involve complex biologic components that are highly sensitive to thermal excursions

Insights into the End User Segment with Hospitals the demand

End User Market Share (%)
Hospitals 42.9%
Diagnostic Imaging Centers 22.1%
Cancer Clinics / Radiotherapy Centers 12.6%
Radiopharmacies & Centralized Preparation Labs 9.3%
Research Institutes & CROs 7.0%
CDMOs/CMOs 6.1%

Hospitals have emerged as the leading end user in the global radiopharmaceutical logistics market and are projected to account for approximately 42.9% of total market share in 2025, owing to their central role in diagnostic imaging and nuclear medicine-based therapies. As primary sites for PET/CT and SPECT scans, as well as inpatient radionuclide therapies, hospitals rely heavily on the timely and safe delivery of radiopharmaceuticals often on a daily or even intra-day basis.

This dominance is underpinned by the rapid rise in oncology and cardiology imaging procedures, which has significantly expanded the volume and frequency of isotope deliveries to hospital-based nuclear medicine departments. Furthermore, the growing clinical adoption of radiotheranostics, such as Lutetium-177 DOTATATE and Actinium-225, has increased hospital dependency on reliable, compliant logistics networks that can support specialized cold chain requirements.

What are the Drivers, Restraints, and Key Trends of the Radiopharmaceutical Logistics Market?

Growing Use in Radiotheranostics and Molecular Imaging

Radiotheranosticsa convergence of diagnostics and targeted therapy is reshaping oncology and precision treatment. Techniques like PET (Positron Emission Tomography) and SPECT (Single-Photon Emission Computed Tomography), enhanced by targeted radiotracers, enable real-time visualization of tumors and guide therapeutic planning. Imaging modalities that combine functional insight with anatomical detail (e.g., PET/CT, SPECT/CT) are becoming clinical staples due to heightened sensitivity and specificity. This rapid adoption of imaging and theranostic techniques increases the volume and frequency of radiopharmaceutical shipments, driving demand for advanced logistics solutions especially those capable of meeting tight delivery schedules and stringent temperature requirements.

Beyond routine imaging, theranostics plays a pivotal role in clinical trials and personalized medicine programs. Over 600 active clinical trials globally now leverage molecular imaging spanning oncology, neurology, cardiology, and infectious diseases. Applications include PET tracers like ^18F‑FDG, ^68Ga‑PSMA, and newer compounds such as ^177Lu-DOTATATE.These trials are further catalyzing demand for radiopharmaceutical shipments that must maintain cold chain integrity and rapid delivery. Personalized radiopharmaceutical therapy also relies on AI-backed modeling for dosimetry and treatment optimization. Emerging research highlights data-driven frameworks to refine radiopharmaceutical delivery and dosing, reinforcing the need for responsive and adaptive logistics capabilities.

Limited Infrastructure in Emerging Markets

One of the most significant barriers impeding the growth of radiopharmaceutical logistics in emerging markets is the absence of reliable cold chain infrastructure. Maintaining temperature control from refrigerated (2 °C-8 °C) to frozen or ultra-cold conditions, is essential to preserve the integrity and efficacy of radiopharmaceuticals during transit. However, many regions in Sub-Saharan Africa, Southeast Asia, and parts of Latin America lack consistent power supplies, modern refrigerated storage facilities, and temperature-controlled transport fleets.

For example, in Africa, frequent power outages and limited access to cold storage contribute to widespread vaccine spoilage, a challenge that directly translates to radiopharmaceutical fragility. Such infrastructure fragility threatens therapeutic efficacy and increases the risk of dose degradation, making cold chain reliability a pivotal logistics concern.

Beyond cold storage, transportation networks needed to support real-time delivery of short half-life isotopes are often inadequate. In regions like India, even expanding vaccine cold-storage chains reveals gaps: only a fraction of required facilities exist, and heat-induced failures during transport are common. Logistical breakdowns such as those encountered in rural or remote areas can delay radiopharmaceutical deliveries, compromising treatment schedules. Consequently, the lack of integrated cold chain and transport infrastructure becomes a critical bottleneck to market expansion in these regions.

Integration of Real-Time Tracking and Cold Chain Monitoring Technologies

Radiopharmaceuticals especially those used in molecular imaging (such as PET and SPECT tracers) and theranosticsrequire precise temperature control and timely delivery to ensure efficacy, safety, and patient outcomes. These compounds often have extremely short half-lives (e.g., Fluorine‑18 with ~110 minutes, Gallium‑68 around 68 minutes), making preservation of their activity during transit a logistical imperative. Even minor deviations in temperature or delivery time can degrade dose potency, risk regulatory non‑compliance, or jeopardize a diagnostic or therapeutic procedure. This complexity has driven logistics providers and healthcare systems to adopt increasingly sophisticated real‑time tracking and cold‑chain monitoring technologies. Collectively, these capabilities are helping transform radiopharmaceutical logistics from reactive, batch-based systems into intelligent, responsive, and data‑driven supply chains.
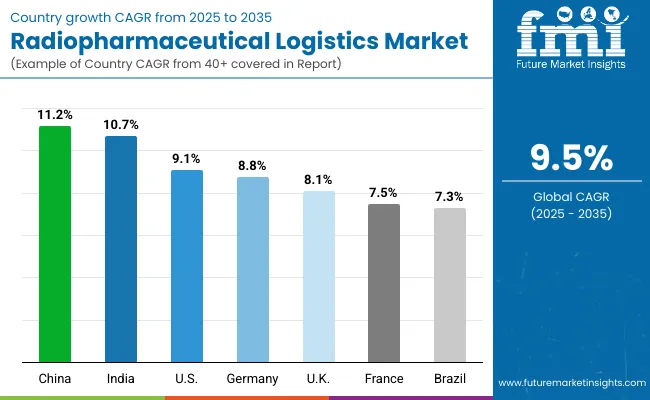
Analysis of Radiopharmaceutical Logistics Market, By Key Countries

Radiopharmaceutical Logistics Market By Country

Countries CAGR
USA 9.1%
Brazil 7.3%
China 11.2%
India 10.7%
Europe 7.5%
Germany 8.8%
France 7.5%
UK 8.1%

The Asia Pacific region is set to emerge as the fastest-growing region in the global radiopharmaceutical logistics market, projected to grow at a CAGR of 11.2% in China and 10.7% in India between 2025 and 2035. These are the highest national growth rates globally, signaling rapid expansion in demand for efficient and compliant transport of radiopharmaceuticals. This acceleration is primarily driven by:

  • The aggressive expansion of PET/CT infrastructure in India and China, increasing the volume of time-sensitive radiotracers being transported daily.
  • In India, hospital network expansion into Tier 2 and Tier 3 cities is increasing reliance on outsourced logistics providers to supply critical isotopes from regional production hubs.
  • Government initiatives supporting the installation of cyclotrons and the licensing of new diagnostic radiopharmaceuticals are boosting isotope production across public and private sectors.
  • Increasing adoption of radiotheranostics and targeted nuclear therapies has made time-critical, refrigerated, and cryogenic delivery capabilities indispensable.

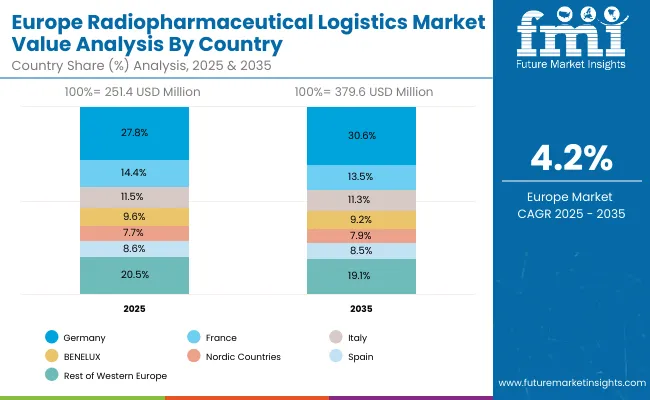
Europe is expected to experience steady growth at a CAGR of 7.5% between 2025 and 2035. The regional market is projected to expand from USD 251.4million in 2025 to USD 379.6million by 2035, adding approximately USD 128.1million in value.

  • Germany, the region’s largest market, will grow at a CAGR of 8.8%, contributing over 28.9% of Europe’s radiopharmaceutical logistics value by 2035.
  • The UK and France are expected to grow at 8.1% and 7.5% CAGR, respectively, driven by NHS reforms and France’s “Ségur de la santé” hospital upgrade initiatives.
  • The BENELUX region, Nordics, and Italy also maintain strong adoption, with harmonized cold-chain regulations (like GDP guidelines) and cross-border delivery frameworks already in place.

Europe’s growth is supported by its mature diagnostic imaging landscape, expanding theranostic usage, and a network of centralized radiopharmacies, which create repeat demand for highly controlled, refrigerated and cryogenic delivery services.

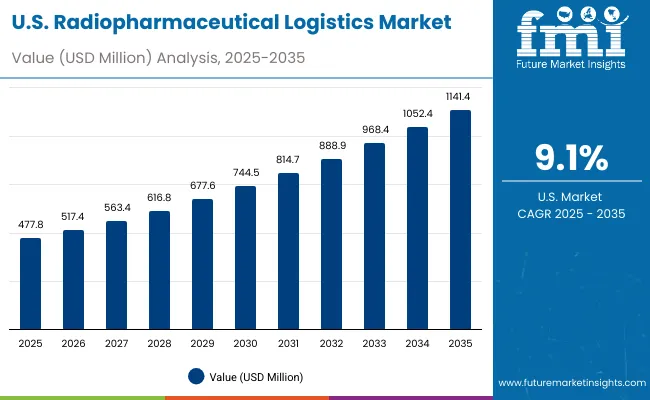
North America remains the largest and most established regional market, led by the United States, which will grow at a CAGR of 9.1%. The USA market is projected to expand from USD 477.8 million in 2025 to USD 1,141.5 million by 2035, representing an absolute growth of USD 663.7 million over the decade.
  • The widespread use of time-sensitive PET tracers (like Fluorine-18 and Gallium-68) in hospitals and outpatient imaging centers.
  • Strong presence of centralized radiopharmacies and cyclotron facilities supporting same-day and next-day deliveries.
  • Investments in real-time temperature and location tracking, automated dispatch platforms, and compliance with FDA and NRC regulations.
  • Growth in theranostic procedures is increasing demand for dual-purpose transport (diagnostic + therapeutic isotopes) and advanced packaging for cryogenic shipments (-80°C to -190°C).

Sales Outlook for Radiopharmaceutical Logistics Market in the United States

Radiopharmaceutical Logistics Market Usa

The Radiopharmaceutical Logistics Market in the USA is forecasted to grow at a robust CAGR of 9.1% between 2025 and 2035, expanding from USD 477.8 million in 2025 to USD 1,141.5 million by 2035. This strong growth trajectory is primarily driven by the increasing demand for time-critical delivery services of diagnostic and therapeutic isotopes, coupled with rising adoption of molecular imaging and radiotheranostics across healthcare systems.

Hospitals, cancer centers, and imaging facilities across the USA are heavily reliant on same-day delivery of short half-life isotopes such as Fluorine-18 and Gallium-68, especially for PET and SPECT scans. As most radiopharmaceuticals are synthesized off-site, compliance with NRC, DOT, and USP guidelines, along with uninterrupted cold chain maintenance, has become central to operational workflows. These factors are pushing logistics providers to enhance air freight and ground-based transport capabilities while integrating real-time tracking, temperature monitoring, and tamper-proof packaging solutions.

  • Hospitals and diagnostic imaging centers are increasingly dependent on external radiopharmacies and centralized compounding labs to meet demand for nuclear imaging agents, necessitating robust logistics partnerships.
  • Radiopharmaceutical CDMOs and CMOs are expanding production capacities for therapeutic isotopes (e.g., Lutetium-177, Actinium-225), requiring highly regulated transport networks with deep cold storage and cryogenic capabilities (-80°C to -190°C).
  • Ambulatory care networks and outpatient clinics, which are seeing rising nuclear imaging volumes, are demanding just-in-time delivery solutions with flexible scheduling and strict quality assurance protocols.

Growth and Expansion Outlook for Radiopharmaceutical Logistics Market in the United Kingdom

The radiopharmaceutical logistics market in the United Kingdom is projected to grow at a CAGR of 8.1% between 2025 and 2035, supported by NHS England’s strategic push toward enhancing nuclear medicine infrastructure and broadening access to PET/CT imaging services across regional and tertiary care centers. As part of its Imaging Transformation Program and Community Diagnostic Centers (CDCs) expansion plan, the NHS is facilitating broader access to time-sensitive radiotracers-driving up the demand for reliable and compliant logistics services.

The UK market is expected to increase its share of the European radiopharmaceutical logistics market, from 18.7% in 2025 to approximately 19.1% by 2035, supported by consistent investment in imaging capacity and streamlined procurement of isotopes via centralized radiopharmacies. NHS Trusts, private imaging providers, and oncology centers are increasingly relying on air freight and secure ground transport solutions to enable same-day delivery of diagnostic tracers such as Fluorine-18 and Gallium-68, as well as therapeutic isotopes like Lutetium-177 used in radioligand therapy. Compliance with MHRA guidelines, IR(ME)R regulations, and Good Distribution Practice (GDP) for radiopharmaceuticals is shaping procurement criteria for logistics providers.

  • NHS Trust hospitals are partnering with accredited logistics companies to standardize radioactive material transport protocols across multi-hospital systems. This is streamlining costs, improving compliance, and ensuring consistent delivery windows for daily PET procedures.
  • Community Diagnostic Centers (CDCs) and standalone imaging clinics are driving the need for time-critical delivery services, particularly in rural and underserved regions where in-house isotope production is absent.
  • The UK’s post-Brexit regulatory framework continues to emphasize radiological safety, cold chain integrity, and audit-readiness-further reinforcing investment in temperature-controlled packaging, real-time tracking, and tamper-evident containers.

In-depth Analysis of Radiopharmaceutical Logistics Market in Germany

The radiopharmaceutical logistics market in Germany is forecast to grow at a CAGR of 8.8% between 2025 and 2035, increasing from a significant base to further consolidate its position as the largest national market in Europe, with a projected market share rising from 28.2% in 2025 to 28.9% by 2035. Growth is being accelerated by the country’s deeply institutionalized nuclear medicine infrastructure, strong PET/CT imaging capacity, and progressive federal investments under Germany’s Krankenhauszukunftsgesetz (KHZG or Hospital Future Act), which is directly supporting digital and physical healthcare modernization, including advanced logistics capabilities for radiopharmaceuticals.

Germany’s high volume of PET and SPECT scans driven by early detection protocols in oncology and neurology-has created a robust demand for time-sensitive, compliance-led transportation solutions. This is particularly vital given the short half-life of diagnostic tracers like Fluorine-18, which require delivery within 4-6 hours post-synthesis. Coupled with growing demand for radiotheranostics (e.g., Lutetium-177, Actinium-225), Germany is seeing a sharp rise in temperature-controlled and cryogenic logistics infrastructure investments, especially in urban academic medical centers and regional radiopharmacies.
  • University hospitals and teaching centers across Berlin, Munich, Frankfurt, and Hamburg are integrating logistics platforms that offer end-to-end visibility, real-time temperature logging, and regulatory documentation support as they expand nuclear medicine and radiopharmacy services.
  • Large public and private healthcare providers are increasingly outsourcing radiopharmaceutical delivery to GDP-certified logistics firms, favoring air-ground hybrid models to ensure precision timing, especially for isotope deliveries to rural or secondary care sites.
  • Dedicated radiopharmaceutical CDMOs and CMOs in Germany are centralizing isotope manufacturing for national distribution, requiring just-in-time delivery contracts with robust cryogenic and refrigerated transport solutions.

Europe Radiopharmaceutical Logistics Market Value Analysis By Country

Radiopharmaceutical Logistics Market Europe

Europe Countries 2025
Germany 27.8%
France 14.4%
Italy 11.5%
BENELUX 9.6%
Nordic Countries 7.7%
Spain 8.6%
Rest of Western Europe 20.5%
Europe Countries 2035
Germany 30.6%
France 13.5%
Italy 11.3%
BENELUX 9.2%
Nordic Countries 7.9%
Spain 8.5%
Rest of Western Europe 19.1%

Market Expansion Outlook for Radiopharmaceutical Logistics Market in India

The radiopharmaceutical logistics market in India is expected to grow at a CAGR of 10.7% between 2025 and 2035, making it one of the fastest-growing national markets globally. This rapid expansion is driven by India’s aggressive growth in tertiary hospitals, oncology centers, and PET/CT diagnostic networks, especially across Tier 1 and Tier 2 cities. The rising demand for molecular imaging, along with increased investments in radiotheranostic capabilities, is placing pressure on logistics providers to scale up time-sensitive, cold chain-compliant delivery systems for diagnostic and therapeutic radioisotopes.

India’s strategic push to become a global hub for nuclear medicine manufacturing and clinical application-through government-funded institutions like BARC (Bhabha Atomic Research Centre) and Board of Radiation & Isotope Technology (BRIT)-has led to the expansion of regional radiopharmacies and centralized isotope production centers. These hubs are increasingly servicing a wider network of public and private healthcare providers, creating complex logistics demands for refrigerated and cryogenic transport solutions, especially for isotopes such as Fluorine-18, Gallium-68, Lutetium-177, and Yttrium-90.

  • Private multi-specialty hospitals and diagnostic imaging chains, especially in cities like Delhi, Mumbai, Hyderabad, and Bangalore, are expanding PET/CT and SPECT capacity, relying heavily on time-critical deliveries of radiopharmaceuticals within 2-4 hours post-synthesis.
  • Medical colleges and teaching hospitals are integrating nuclear medicine units and on-campus radiopharmacies, creating demand for short-range, same-day delivery logistics that must comply with Atomic Energy Regulatory Board (AERB) safety and transport guidelines.
  • Tier 2 and Tier 3 cities are witnessing the rise of cancer centers and PET scan facilities, often without local production capabilities. These centers depend on centralized suppliers in metros and require air-ground hybrid transport for just-in-time isotope delivery.

Sales Outlook for Radiopharmaceutical Logistics Market in China

China is projected to be the fastest-growing country in the global radiopharmaceutical logistics market, with a CAGR of 11.2% from 2025 to 2035. This exceptional growth is underpinned by robust government policy frameworks like “Healthy China 2030”, aggressive national investments in oncology and diagnostic imaging, and the widespread expansion of PET/CT capacity across both urban and county-level hospitals. As China emerges as a leading hub for molecular imaging and radiotheranostics, the need for time-sensitive, cold chain-enabled logistics infrastructure is rapidly intensifying.

The market growth is further accelerated by China's increasing clinical deployment of theranostic isotopes-such as Lutetium-177 and Actinium-225-as well as higher demand for Fluorine-18 FDG in PET-based cancer diagnostics. As of 2025, major hospital systems in Tier 1 cities like Beijing, Shanghai, Guangzhou, and Chengdu are upgrading their nuclear medicine departments and establishing in-house or satellite radiopharmacies. This is catalyzing the need for reliable, temperature-controlled delivery systems that can comply with NMPA (National Medical Products Administration) and IAEA guidelines.
  • Urban tertiary hospitals in Class A categories are investing in on-site cyclotrons, GMP-compliant radiopharmacies, and third-party logistics services to handle real-time distribution of PET tracers and therapeutic isotopes.
  • County and district-level hospitals without in-house production are increasingly dependent on centralized radiopharmacies, requiring early-morning air and ground dispatches to ensure on-schedule imaging procedures.
  • Public-private joint venture hospitals, especially those in partnership with international networks, are demanding GDP-compliant logistics services capable of supporting multi-isotope workflows, including both diagnostic and emerging radiotherapeutic compounds.

Growth Outlook of Radiopharmaceutical Logistics Market in Japan

Radiopharmaceutical Logistics Market Japan

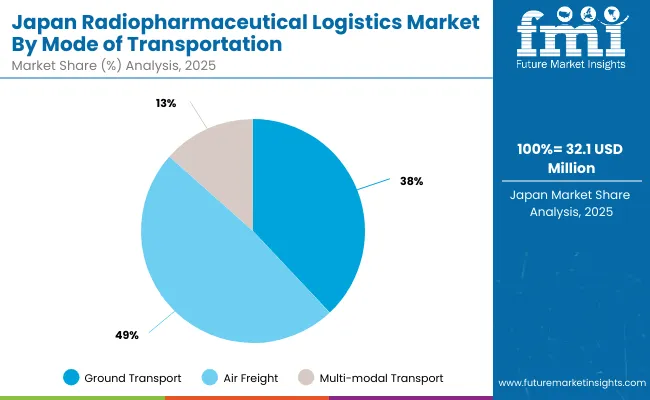
Japan’s radiopharmaceutical logistics market is projected to reach USD 32.1 million in 2025, growing at a CAGR of 5.1% through 2035, supported by the country’s commitment to precision diagnostics, its expanding nuclear medicine infrastructure, and the unique logistical demands created by an aging population. As one of the most advanced healthcare systems globally, Japan prioritizes high regulatory compliance, worker safety, and timely access to diagnostic and therapeutic isotopes-factors that continue to shape the evolution of radiopharmaceutical logistics networks across the country.

Japan’s radiopharmaceutical supply chain has historically been highly centralized, with a focus on domestic production of isotopes like Technetium-99m, Fluorine-18, Gallium-67, and Iodine-123. However, as demand for PET imaging and theranostics agents such as Lutetium-177 and Actinium-225 continues to grow, hospitals and imaging centers are increasingly depending on time-sensitive logistics providers equipped to handle complex cold chain deliveries under stringent PMDA (Pharmaceuticals and Medical Devices Agency) and MHLW regulations.
  • Japan is projected to account for approximately 2.9% of global radiopharmaceutical logistics revenue in 2025, reaching a market value of USD 32.1 million.
  • Standard Delivery Services dominate the market in Japan, contributing around 57.9% of the service type share in 2025. This trend is reinforced by the structured, pre-scheduled delivery model widely adopted by nuclear medicine centers and centralized radiopharmacies, particularly for stable, high-volume tracers like Fluorine-18 FDG.
  • Infection control mandates from the Ministry of Health, Labour and Welfare (MHLW), especially in long-term care and surgical facilities, are stimulating demand for sterile, traceable logistics of radiopharmaceuticals.

Opportunity Analysis of South Korea in Radiopharmaceutical Logistics Market

Radiopharmaceutical Logistics Market South Korea

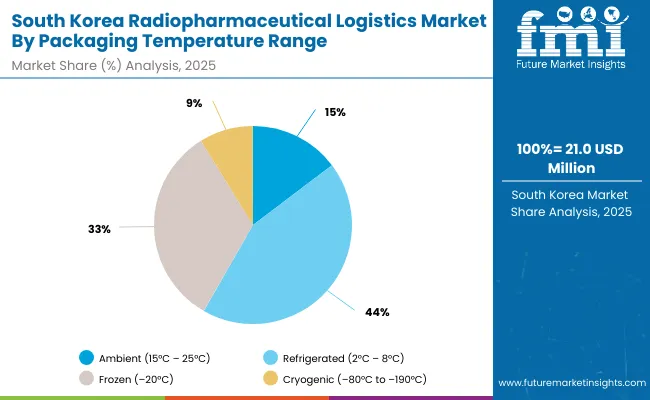
The radiopharmaceutical logistics market in South Korea is estimated at approximately USD 21.0million in 2025, capturing about 1.9% of the global market share. This reflects steady growth fueled by national healthcare policies focused on enhancing radiopharmaceutical availability and safe handling protocols.
  • Market size for South Korea in 2025 is USD 21.0million
  • South Korea holds 1.9% of the Global Market.
  • South Korea's dense air cargo network, anchored by Incheon International Airport, supports efficient cold chain handling and fast dispatch to nuclear medicine departments. Moreover, import reliance on certain isotopes and specialized compounds from international suppliers increases the dependence on air transport.

Competition Landscape

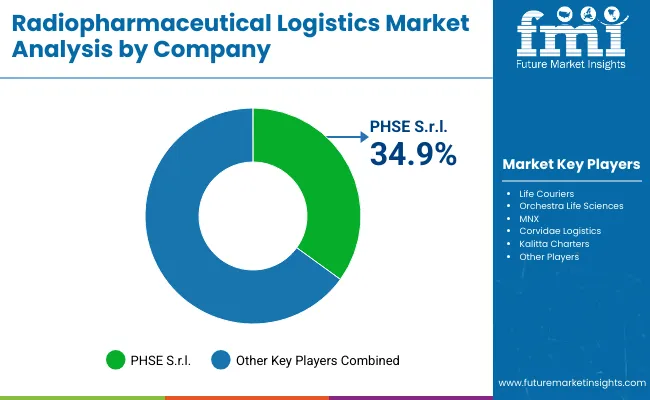
Radiopharmaceutical Logistics Market By Company

The Radiopharmaceutical Logistics Market is moderately fragmented, with a few dominant players, several established mid-sized providers, and a growing base of niche-focused specialists competing across radiopharmaceutical transportation, handling, and time-critical delivery services.

PHSE S.r.l. holds a commanding 34.9% market share, driven by its expertise in time- and temperature-sensitive radiopharmaceutical logistics. The company’s strategy focuses on expanding its global footprint, investing in dedicated cold-chain networks, and leveraging real-time tracking technologies for critical isotopes and PET tracers. PHSE has also strengthened partnerships with radiopharmaceutical manufacturers and nuclear medicine departments to ensure end-to-end compliance with radiation safety and international transport regulations.

Companies like Life Couriers, Orchestra Life Sciences, MNX, and B.P.L. GmbH cater to hospitals, imaging centers, and nuclear medicine facilities requiring high-frequency, regional delivery models. These players focus on rapid response capabilities, integration of 24/7 monitoring systems, and expansion of dedicated handling hubs to compete effectively against larger networks. Their strategies also emphasize collaboration with pharmaceutical distributors to cover last-mile delivery gaps in emerging markets.

Firms such as Corvidae Logistics, Kalitta Charters, American Expediting, AirNet II LLC, Medi-Ops LLC, GTA Air Inc., and Lab Carriers specialize in customized transport services for low-volume, high-priority radiopharmaceutical consignments. These companies differentiate themselves through on-demand charter solutions, specialized radiation handling certifications, and flexibility in cross-border regulatory navigation. Their strength lies in serving niche geographies, small-scale PET centers, and academic nuclear medicine institutes.

Key Developments

  • In 2025, PHSE, a leading global group in temperature-controlled and time critical pharmaceutical logistics, announced that today it has completed the acquisition of 100% of Sat Cargo Srl, a company specialized in international (import and export) temperature-controlled transport of pharmaceuticals, animal healths products and food supplements, with storage and “cross docking” activities at its temperature-controlled warehouse in Lainate (MI), operating at +2/+8 °C and +15/+25 °C and covering approximately 5,000 sqm.
  • In 2025, - Radio Pharma Logistics Group (RLG) announced a significant milestone in its journey as it celebrates the 20th anniversary of its founding company ISOVital and unveils a strategic rebranding that will unite its subsidiaries under a single brand. Going forward, RLG will be known as Life Couriers Radiopharma Europe, with its subsidiaries - ISOVital and ISOLife in France and Isotopes Services International in Belgium - operating under the single brand name of Life Couriers. This comprehensive rebranding reflects the Life Couriers commitment to streamlined operations and a bold vision for the future of radiopharmaceutical logistics. As a leader in temperature-controlled and time-sensitive deliveries, Life Couriers is committed to providing unparalleled solutions that meet the ever-evolving needs of the healthcare and life sciences industries.

Scope of the Report

Item Value
Quantitative Units USD 1,106.0 million
Service Type Standard Delivery Services, Time-critical Delivery Services
Mode of Transportation Ground Transport, Air Freight, and Multi-modal Transport
Packaging Temperature Range Ambient (15°C - 25°C), Refrigerated (2°C - 8°C), Frozen (-20°C), and Cryogenic (-80°C to -190°C)
End User Hospitals, Diagnostic Imaging Centers, Cancer Clinics / Radiotherapy Centers, Radiopharmacies & Centralized Preparation Labs, Research Institutes & CROs, and CDMOs/CMOs
Regions Covered North America, Latin America, Western & Eastern Europe, East Asia, South Asia & Pacific, Middle East & Africa
Countries Covered USA, Brazil, China, India, Germany, France, UK etc.
Key Companies Profiled PHSE S.r.l ., Life Couriers, Orchestra Life Scienc es, MNX, a UPS Company, Corvidae Logistics, Kalitta Charters., American Expediting, AirNet II LLC., Medi -Ops, LLC., GTA Air, Inc., Lab Carriers, and B.P.L. GmbH
Additional Attributes Dollar sales by service type and region s, Hospitals and Diagnostic Imaging Centers: remain the largest end users for logistics, correlating with expanded procedural volumes-and in Asia Pacific, accounting for ~38-44% of end-user share by 2035 . The combination of domestic production capacity and decentralized distribution networks is amplifying demand for standardized logistics models that can meet cold chain and regulatory requirements efficiently.

Key Segments

By Service Type:

  • Standard Delivery Services
  • Time-critical Delivery Services

By Mode of Transportation:

  • Ground Transport
  • Air Freight
  • Multi-modal Transport

By Packaging Temperature Range:

  • Ambient (15°C - 25°C)
  • Refrigerated (2°C - 8°C)
  • Frozen (-20°C)
  • Cryogenic (-80°C to -190°C)

By End User:

  • Hospitals
  • Diagnostic Imaging Centers
  • Cancer Clinics / Radiotherapy Centers
  • Radiopharmacies & Centralized Preparation Labs
  • Research Institutes & CROs
  • CDMOs/CMOs

By Region:

  • North America
  • Latin America
  • Western Europe
  • Eastern Europe
  • East Asia
  • South Asia
  • MEA

Table of Content

  1. Executive Summary
    • Global Market Outlook
    • Demand-side Trends
    • Supply-side Trends
    • Technology Roadmap Analysis
    • Analysis and Recommendations
  2. Market Overview
    • Market Coverage / Taxonomy
    • Market Definition / Scope / Limitations
  3. Market Background
    • Market Dynamics
      • Drivers
      • Restraints
      • Opportunity a
      • Trends
    • Scenario Forecast
      • Demand in Optimistic Scenario
      • Demand in Likely Scenario
      • Demand in Conservative Scenario
    • Opportunity Map Analysis
    • Technological Advancement
    • Investment Feasibility Matrix
    • PESTLE and Porter’s Analysis
    • Regulatory Landscape
      • By Key Regions
      • By Key Countries
    • Regional Parent Market Outlook
  4. Global Market Analysis 2020 to 2024 and Forecast, 2025 to 2035
    • Historical Market Size Value (USD Million) Analysis, 2020 to 2024
    • Current and Future Market Size Value (USD Million) Projections, 2025 to 2035
      • Y-o-Y Growth Trend Analysis
      • Absolute $ Opportunity Analysis
  5. Global Market Analysis 2020 to 2024 and Forecast 2025 to 2035, By Service Type
    • Introduction / Key Findings
    • Historical Market Size Value (USD Million) Analysis By Service Type, 2020 to 2024
    • Current and Future Market Size Value (USD Million) Analysis and Forecast By Service Type, 2025 to 2035
      • Standard Delivery Services
      • Time-critical Delivery Services
    • Y-o-Y Growth Trend Analysis By Service Type, 2020 to 2024
    • Absolute $ Opportunity Analysis By Service Type, 2025 to 2035
  6. Global Market Analysis 2020 to 2024 and Forecast 2025 to 2035, By Mode of Transportation
    • Introduction / Key Findings
    • Historical Market Size Value (USD Million) Analysis By Mode of Transportation, 2020 to 2024
    • Current and Future Market Size Value (USD Million) Analysis and Forecast By Mode of Transportation, 2025 to 2035
      • Ground Transport
      • Air Freight
      • Multi-modal Transport
    • Y-o-Y Growth Trend Analysis By Mode of Transportation, 2020 to 2024
    • Absolute $ Opportunity Analysis By Mode of Transportation, 2025 to 2035
  7. Global Market Analysis 2020 to 2024 and Forecast 2025 to 2035, By Packaging Temperature Range
    • Introduction / Key Findings
    • Historical Market Size Value (USD Million) Analysis By Packaging Temperature Range, 2020 to 2024
    • Current and Future Market Size Value (USD Million) Analysis and Forecast By Packaging Temperature Range, 2025 to 2035
      • Ambient (15°C - 25°C)
      • Refrigerated (2°C - 8°C)
      • Frozen (-20°C)
      • Cryogenic (-80°C to -190°C)
    • Y-o-Y Growth Trend Analysis By Packaging Temperature Range, 2020 to 2024
    • Absolute $ Opportunity Analysis By Packaging Temperature Range, 2025 to 2035
  8. Global Market Analysis 2020 to 2024 and Forecast 2025 to 2035, By End User
    • Introduction / Key Findings
    • Historical Market Size Value (USD Million) Analysis By End User, 2020 to 2024
    • Current and Future Market Size Value (USD Million) Analysis and Forecast By End User, 2025 to 2035
      • Hospitals
      • Diagnostic Imaging Centers
      • Cancer Clinics / Radiotherapy Centers
      • Radiopharmacies & Centralized Preparation Labs
      • Research Institutes & CROs
      • CDMOs/CMOs
    • Y-o-Y Growth Trend Analysis By End User, 2020 to 2024
    • Absolute $ Opportunity Analysis By End User, 2025 to 2035
  9. Global Market Analysis 2020 to 2024 and Forecast 2025 to 2035, By Region
    • Introduction
    • Historical Market Size Value (USD Million) Analysis By Region, 2020 to 2024
    • Current Market Size Value (USD Million) Analysis and Forecast By Region, 2025 to 2035
      • North America
      • Latin America
      • Western Europe
      • Eastern Europe
      • East Asia
      • South Asia
      • MEA
    • Market Attractiveness Analysis By Region
  10. North America Market Analysis 2020 to 2024 and Forecast 2025 to 2035, By Country
    • Historical Market Size Value (USD Million) Trend Analysis By Market Taxonomy, 2020 to 2024
    • Market Size Value (USD Million) Forecast By Market Taxonomy, 2025 to 2035
      • By Country
        • USA
        • Canada
        • Mexico
      • By Service Type
      • By Mode of Transportation
      • By Packaging Temperature Range
      • By End User
    • Market Attractiveness Analysis
      • By Country
      • By Service Type
      • By Mode of Transportation
      • By Packaging Temperature Range
      • By End User
    • Key Takeaways
  11. Latin America Market Analysis 2020 to 2024 and Forecast 2025 to 2035, By Country
    • Historical Market Size Value (USD Million) Trend Analysis By Market Taxonomy, 2020 to 2024
    • Market Size Value (USD Million) Forecast By Market Taxonomy, 2025 to 2035
      • By Country
        • Brazil
        • Argentina
        • Rest of Latin America
      • By Service Type
      • By Mode of Transportation
      • By Packaging Temperature Range
      • By End User
    • Market Attractiveness Analysis
      • By Country
      • By Service Type
      • By Mode of Transportation
      • By Packaging Temperature Range
      • By End User
    • Key Takeaways
  12. Western Europe Market Analysis 2020 to 2024 and Forecast 2025 to 2035, By Country
    • Historical Market Size Value (USD Million) Trend Analysis By Market Taxonomy, 2020 to 2024
    • Market Size Value (USD Million) Forecast By Market Taxonomy, 2025 to 2035
      • By Country
        • Germany
        • Italy
        • France
        • UK
        • Spain
        • BENELUX
        • Nordic Countries
        • Rest of Western Europe
      • By Service Type
      • By Mode of Transportation
      • By Packaging Temperature Range
      • By End User
    • Market Attractiveness Analysis
      • By Country
      • By Service Type
      • By Mode of Transportation
      • By Packaging Temperature Range
      • By End User
    • Key Takeaways
  13. Eastern Europe Market Analysis 2020 to 2024 and Forecast 2025 to 2035, By Country
    • Historical Market Size Value (USD Million) Trend Analysis By Market Taxonomy, 2020 to 2024
    • Market Size Value (USD Million) Forecast By Market Taxonomy, 2025 to 2035
      • By Country
        • Russia
        • Hungry
        • Poland
        • Rest of Eastern Europe
      • By Service Type
      • By Mode of Transportation
      • By Packaging Temperature Range
      • By End User
    • Market Attractiveness Analysis
      • By Country
      • By Service Type
      • By Mode of Transportation
      • By Packaging Temperature Range
      • By End User
    • Key Takeaways
  14. East Asia Market Analysis 2020 to 2024 and Forecast 2025 to 2035, By Country
    • Historical Market Size Value (USD Million) Trend Analysis By Market Taxonomy, 2020 to 2024
    • Market Size Value (USD Million) Forecast By Market Taxonomy, 2025 to 2035
      • By Country
        • China
        • Japan
        • South Korea
      • By Service Type
      • By Mode of Transportation
      • By Packaging Temperature Range
      • By End User
    • Market Attractiveness Analysis
      • By Country
      • By Service Type
      • By Mode of Transportation
      • By Packaging Temperature Range
      • By End User
    • Key Takeaways
  15. South Asia Market Analysis 2020 to 2024 and Forecast 2025 to 2035, By Country
    • Historical Market Size Value (USD Million) Trend Analysis By Market Taxonomy, 2020 to 2024
    • Market Size Value (USD Million) Forecast By Market Taxonomy, 2025 to 2035
      • By Country
        • India
        • ASEAN Countries
        • Australia & New Zealand
        • Rest of South Asia
      • By Service Type
      • By Mode of Transportation
      • By Packaging Temperature Range
      • By End User
    • Market Attractiveness Analysis
      • By Country
      • By Service Type
      • By Mode of Transportation
      • By Packaging Temperature Range
      • By End User
    • Key Takeaways
  16. MEA Market Analysis 2020 to 2024 and Forecast 2025 to 2035, By Country
    • Historical Market Size Value (USD Million) Trend Analysis By Market Taxonomy, 2020 to 2024
    • Market Size Value (USD Million) Forecast By Market Taxonomy, 2025 to 2035
      • By Country
        • Saudi Arabia
        • Türkiye
        • South Africa
        • Other African Union
        • Rest of MEA
      • By Service Type
      • By Mode of Transportation
      • By Packaging Temperature Range
      • By End User
    • Market Attractiveness Analysis
      • By Country
      • By Service Type
      • By Mode of Transportation
      • By Packaging Temperature Range
      • By End User
    • Key Takeaways
  17. Key Countries Market Analysis
    • USA
      • Pricing Analysis
      • Market Share Analysis, 2024
        • By Service Type
        • By Mode of Transportation
        • By Packaging Temperature Range
        • By End User
    • Brazil
      • Pricing Analysis
      • Market Share Analysis, 2024
        • By Service Type
        • By Mode of Transportation
        • By Packaging Temperature Range
        • By End User
    • China
      • Pricing Analysis
      • Market Share Analysis, 2024
        • By Service Type
        • By Mode of Transportation
        • By Packaging Temperature Range
        • By End User
    • India
      • Pricing Analysis
      • Market Share Analysis, 2024
        • By Service Type
        • By Mode of Transportation
        • By Packaging Temperature Range
        • By End User
    • Europe
      • Pricing Analysis
      • Market Share Analysis, 2024
        • By Service Type
        • By Mode of Transportation
        • By Packaging Temperature Range
        • By End User
    • Germany
      • Pricing Analysis
      • Market Share Analysis, 2024
        • By Service Type
        • By Mode of Transportation
        • By Packaging Temperature Range
        • By End User
    • France
      • Pricing Analysis
      • Market Share Analysis, 2024
        • By Service Type
        • By Mode of Transportation
        • By Packaging Temperature Range
        • By End User
    • UK
      • Pricing Analysis
      • Market Share Analysis, 2024
        • By Service Type
        • By Mode of Transportation
        • By Packaging Temperature Range
        • By End User
  18. Market Structure Analysis
    • Competition Dashboard
    • Competition Benchmarking
    • Market Share Analysis of Top Players
      • By Regional
      • By Service Type
      • By Mode of Transportation
      • By Packaging Temperature Range
      • By End User
  19. Competition Analysis
    • Competition Deep Dive
      • PHSE S.r.l.
        • Overview
        • Product Portfolio
        • Profitability by Market Segments (Product/Age /Sales Channel/Region)
        • Sales Footprint
        • Strategy Overview
          • Marketing Strategy
          • Product Strategy
          • Channel Strategy
      • Life Couriers
        • Overview
        • Product Portfolio
        • Profitability by Market Segments (Product/Age /Sales Channel/Region)
        • Sales Footprint
        • Strategy Overview
          • Marketing Strategy
          • Product Strategy
          • Channel Strategy
      • Orchestra Life Sciences
        • Overview
        • Product Portfolio
        • Profitability by Market Segments (Product/Age /Sales Channel/Region)
        • Sales Footprint
        • Strategy Overview
          • Marketing Strategy
          • Product Strategy
          • Channel Strategy
      • MNX, a UPS Company
        • Overview
        • Product Portfolio
        • Profitability by Market Segments (Product/Age /Sales Channel/Region)
        • Sales Footprint
        • Strategy Overview
          • Marketing Strategy
          • Product Strategy
          • Channel Strategy
      • Corvidae Logistics
        • Overview
        • Product Portfolio
        • Profitability by Market Segments (Product/Age /Sales Channel/Region)
        • Sales Footprint
        • Strategy Overview
          • Marketing Strategy
          • Product Strategy
          • Channel Strategy
      • Kalitta Charters.
        • Overview
        • Product Portfolio
        • Profitability by Market Segments (Product/Age /Sales Channel/Region)
        • Sales Footprint
        • Strategy Overview
          • Marketing Strategy
          • Product Strategy
          • Channel Strategy
      • American Expediting
        • Overview
        • Product Portfolio
        • Profitability by Market Segments (Product/Age /Sales Channel/Region)
        • Sales Footprint
        • Strategy Overview
          • Marketing Strategy
          • Product Strategy
          • Channel Strategy
      • AirNet II LLC.
        • Overview
        • Product Portfolio
        • Profitability by Market Segments (Product/Age /Sales Channel/Region)
        • Sales Footprint
        • Strategy Overview
          • Marketing Strategy
          • Product Strategy
          • Channel Strategy
      • Medi-Ops, LLC.
        • Overview
        • Product Portfolio
        • Profitability by Market Segments (Product/Age /Sales Channel/Region)
        • Sales Footprint
        • Strategy Overview
          • Marketing Strategy
          • Product Strategy
          • Channel Strategy
      • GTA Air, Inc.
        • Overview
        • Product Portfolio
        • Profitability by Market Segments (Product/Age /Sales Channel/Region)
        • Sales Footprint
        • Strategy Overview
          • Marketing Strategy
          • Product Strategy
          • Channel Strategy
      • Lab Carriers
        • Overview
        • Product Portfolio
        • Profitability by Market Segments (Product/Age /Sales Channel/Region)
        • Sales Footprint
        • Strategy Overview
          • Marketing Strategy
          • Product Strategy
          • Channel Strategy
      • B.P.L. GmbH
        • Overview
        • Product Portfolio
        • Profitability by Market Segments (Product/Age /Sales Channel/Region)
        • Sales Footprint
        • Strategy Overview
          • Marketing Strategy
          • Product Strategy
          • Channel Strategy
  20. Assumptions & Acronyms Used
  21. Research Methodology

List of Tables

  • Table 1: Global Market Value (USD Million) Forecast by Region, 2020-2035
  • Table 2: Global Market Value (USD Million) Forecast by Service Type, 2020-2035
  • Table 3: Global Market Value (USD Million) Forecast by Mode of Transportation, 2020-2035
  • Table 4: Global Market Value (USD Million) Forecast by Packaging Temperature Range, 2020-2035
  • Table 5: Global Market Value (USD Million) Forecast by End User, 2020-2035
  • Table 6: North America Market Value (USD Million) Forecast by Country, 2020-2035
  • Table 7: North America Market Value (USD Million) Forecast by Service Type, 2020-2035
  • Table 8: North America Market Value (USD Million) Forecast by Mode of Transportation, 2020-2035
  • Table 9: North America Market Value (USD Million) Forecast by Packaging Temperature Range, 2020-2035
  • Table 10: North America Market Value (USD Million) Forecast by End User, 2020-2035
  • Table 11: Latin America Market Value (USD Million) Forecast by Country, 2020-2035
  • Table 12: Latin America Market Value (USD Million) Forecast by Service Type, 2020-2035
  • Table 13: Latin America Market Value (USD Million) Forecast by Mode of Transportation, 2020-2035
  • Table 14: Latin America Market Value (USD Million) Forecast by Packaging Temperature Range, 2020-2035
  • Table 15: Latin America Market Value (USD Million) Forecast by End User, 2020-2035
  • Table 16: Western Europe Market Value (USD Million) Forecast by Country, 2020-2035
  • Table 17: Western Europe Market Value (USD Million) Forecast by Service Type, 2020-2035
  • Table 18: Western Europe Market Value (USD Million) Forecast by Mode of Transportation, 2020-2035
  • Table 19: Western Europe Market Value (USD Million) Forecast by Packaging Temperature Range, 2020-2035
  • Table 20: Western Europe Market Value (USD Million) Forecast by End User, 2020-2035
  • Table 21: Eastern Europe Market Value (USD Million) Forecast by Country, 2020-2035
  • Table 22: Eastern Europe Market Value (USD Million) Forecast by Service Type, 2020-2035
  • Table 23: Eastern Europe Market Value (USD Million) Forecast by Mode of Transportation, 2020-2035
  • Table 24: Eastern Europe Market Value (USD Million) Forecast by Packaging Temperature Range, 2020-2035
  • Table 25: Eastern Europe Market Value (USD Million) Forecast by End User, 2020-2035
  • Table 26: East Asia Market Value (USD Million) Forecast by Country, 2020-2035
  • Table 27: East Asia Market Value (USD Million) Forecast by Service Type, 2020-2035
  • Table 28: East Asia Market Value (USD Million) Forecast by Mode of Transportation, 2020-2035
  • Table 29: East Asia Market Value (USD Million) Forecast by Packaging Temperature Range, 2020-2035
  • Table 30: East Asia Market Value (USD Million) Forecast by End User, 2020-2035
  • Table 31: South Asia Market Value (USD Million) Forecast by Country, 2020-2035
  • Table 32: South Asia Market Value (USD Million) Forecast by Service Type, 2020-2035
  • Table 33: South Asia Market Value (USD Million) Forecast by Mode of Transportation, 2020-2035
  • Table 34: South Asia Market Value (USD Million) Forecast by Packaging Temperature Range, 2020-2035
  • Table 35: South Asia Market Value (USD Million) Forecast by End User, 2020-2035
  • Table 36: MEA Market Value (USD Million) Forecast by Country, 2020-2035
  • Table 37: MEA Market Value (USD Million) Forecast by Service Type, 2020-2035
  • Table 38: MEA Market Value (USD Million) Forecast by Mode of Transportation, 2020-2035
  • Table 39: MEA Market Value (USD Million) Forecast by Packaging Temperature Range, 2020-2035
  • Table 40: MEA Market Value (USD Million) Forecast by End User, 2020-2035

List of Figures

  • Figure 1: Global Market Value (USD Million) by Service Type, 2025-2035
  • Figure 2: Global Market Value (USD Million) by Mode of Transportation, 2025-2035
  • Figure 3: Global Market Value (USD Million) by Packaging Temperature Range, 2025-2035
  • Figure 4: Global Market Value (USD Million) by End User, 2025-2035
  • Figure 5: Global Market Value (USD Million) by Region, 2025-2035
  • Figure 6: Global Market Value (USD Million) Analysis by Region, 2020-2035
  • Figure 7: Global Market Value Share (%) and BPS Analysis by Region, 2025-2035
  • Figure 8: Global Market Y-o-Y Growth (%) Projections by Region, 2025-2035
  • Figure 9: Global Market Value (USD Million) Analysis by Service Type, 2020-2035
  • Figure 10: Global Market Value Share (%) and BPS Analysis by Service Type, 2025-2035
  • Figure 11: Global Market Y-o-Y Growth (%) Projections by Service Type, 2025-2035
  • Figure 12: Global Market Value (USD Million) Analysis by Mode of Transportation, 2020-2035
  • Figure 13: Global Market Value Share (%) and BPS Analysis by Mode of Transportation, 2025-2035
  • Figure 14: Global Market Y-o-Y Growth (%) Projections by Mode of Transportation, 2025-2035
  • Figure 15: Global Market Value (USD Million) Analysis by Packaging Temperature Range, 2020-2035
  • Figure 16: Global Market Value Share (%) and BPS Analysis by Packaging Temperature Range, 2025-2035
  • Figure 17: Global Market Y-o-Y Growth (%) Projections by Packaging Temperature Range, 2025-2035
  • Figure 18: Global Market Value (USD Million) Analysis by End User, 2020-2035
  • Figure 19: Global Market Value Share (%) and BPS Analysis by End User, 2025-2035
  • Figure 20: Global Market Y-o-Y Growth (%) Projections by End User, 2025-2035
  • Figure 21: Global Market Attractiveness by Service Type, 2025-2035
  • Figure 22: Global Market Attractiveness by Mode of Transportation, 2025-2035
  • Figure 23: Global Market Attractiveness by Packaging Temperature Range, 2025-2035
  • Figure 24: Global Market Attractiveness by End User, 2025-2035
  • Figure 25: Global Market Attractiveness by Region, 2025-2035
  • Figure 26: North America Market Value (USD Million) by Service Type, 2025-2035
  • Figure 27: North America Market Value (USD Million) by Mode of Transportation, 2025-2035
  • Figure 28: North America Market Value (USD Million) by Packaging Temperature Range, 2025-2035
  • Figure 29: North America Market Value (USD Million) by End User, 2025-2035
  • Figure 30: North America Market Value (USD Million) by Country, 2025-2035
  • Figure 31: North America Market Value (USD Million) Analysis by Country, 2020-2035
  • Figure 32: North America Market Value Share (%) and BPS Analysis by Country, 2025-2035
  • Figure 33: North America Market Y-o-Y Growth (%) Projections by Country, 2025-2035
  • Figure 34: North America Market Value (USD Million) Analysis by Service Type, 2020-2035
  • Figure 35: North America Market Value Share (%) and BPS Analysis by Service Type, 2025-2035
  • Figure 36: North America Market Y-o-Y Growth (%) Projections by Service Type, 2025-2035
  • Figure 37: North America Market Value (USD Million) Analysis by Mode of Transportation, 2020-2035
  • Figure 38: North America Market Value Share (%) and BPS Analysis by Mode of Transportation, 2025-2035
  • Figure 39: North America Market Y-o-Y Growth (%) Projections by Mode of Transportation, 2025-2035
  • Figure 40: North America Market Value (USD Million) Analysis by Packaging Temperature Range, 2020-2035
  • Figure 41: North America Market Value Share (%) and BPS Analysis by Packaging Temperature Range, 2025-2035
  • Figure 42: North America Market Y-o-Y Growth (%) Projections by Packaging Temperature Range, 2025-2035
  • Figure 43: North America Market Value (USD Million) Analysis by End User, 2020-2035
  • Figure 44: North America Market Value Share (%) and BPS Analysis by End User, 2025-2035
  • Figure 45: North America Market Y-o-Y Growth (%) Projections by End User, 2025-2035
  • Figure 46: North America Market Attractiveness by Service Type, 2025-2035
  • Figure 47: North America Market Attractiveness by Mode of Transportation, 2025-2035
  • Figure 48: North America Market Attractiveness by Packaging Temperature Range, 2025-2035
  • Figure 49: North America Market Attractiveness by End User, 2025-2035
  • Figure 50: North America Market Attractiveness by Country, 2025-2035
  • Figure 51: Latin America Market Value (USD Million) by Service Type, 2025-2035
  • Figure 52: Latin America Market Value (USD Million) by Mode of Transportation, 2025-2035
  • Figure 53: Latin America Market Value (USD Million) by Packaging Temperature Range, 2025-2035
  • Figure 54: Latin America Market Value (USD Million) by End User, 2025-2035
  • Figure 55: Latin America Market Value (USD Million) by Country, 2025-2035
  • Figure 56: Latin America Market Value (USD Million) Analysis by Country, 2020-2035
  • Figure 57: Latin America Market Value Share (%) and BPS Analysis by Country, 2025-2035
  • Figure 58: Latin America Market Y-o-Y Growth (%) Projections by Country, 2025-2035
  • Figure 59: Latin America Market Value (USD Million) Analysis by Service Type, 2020-2035
  • Figure 60: Latin America Market Value Share (%) and BPS Analysis by Service Type, 2025-2035
  • Figure 61: Latin America Market Y-o-Y Growth (%) Projections by Service Type, 2025-2035
  • Figure 62: Latin America Market Value (USD Million) Analysis by Mode of Transportation, 2020-2035
  • Figure 63: Latin America Market Value Share (%) and BPS Analysis by Mode of Transportation, 2025-2035
  • Figure 64: Latin America Market Y-o-Y Growth (%) Projections by Mode of Transportation, 2025-2035
  • Figure 65: Latin America Market Value (USD Million) Analysis by Packaging Temperature Range, 2020-2035
  • Figure 66: Latin America Market Value Share (%) and BPS Analysis by Packaging Temperature Range, 2025-2035
  • Figure 67: Latin America Market Y-o-Y Growth (%) Projections by Packaging Temperature Range, 2025-2035
  • Figure 68: Latin America Market Value (USD Million) Analysis by End User, 2020-2035
  • Figure 69: Latin America Market Value Share (%) and BPS Analysis by End User, 2025-2035
  • Figure 70: Latin America Market Y-o-Y Growth (%) Projections by End User, 2025-2035
  • Figure 71: Latin America Market Attractiveness by Service Type, 2025-2035
  • Figure 72: Latin America Market Attractiveness by Mode of Transportation, 2025-2035
  • Figure 73: Latin America Market Attractiveness by Packaging Temperature Range, 2025-2035
  • Figure 74: Latin America Market Attractiveness by End User, 2025-2035
  • Figure 75: Latin America Market Attractiveness by Country, 2025-2035
  • Figure 76: Western Europe Market Value (USD Million) by Service Type, 2025-2035
  • Figure 77: Western Europe Market Value (USD Million) by Mode of Transportation, 2025-2035
  • Figure 78: Western Europe Market Value (USD Million) by Packaging Temperature Range, 2025-2035
  • Figure 79: Western Europe Market Value (USD Million) by End User, 2025-2035
  • Figure 80: Western Europe Market Value (USD Million) by Country, 2025-2035
  • Figure 81: Western Europe Market Value (USD Million) Analysis by Country, 2020-2035
  • Figure 82: Western Europe Market Value Share (%) and BPS Analysis by Country, 2025-2035
  • Figure 83: Western Europe Market Y-o-Y Growth (%) Projections by Country, 2025-2035
  • Figure 84: Western Europe Market Value (USD Million) Analysis by Service Type, 2020-2035
  • Figure 85: Western Europe Market Value Share (%) and BPS Analysis by Service Type, 2025-2035
  • Figure 86: Western Europe Market Y-o-Y Growth (%) Projections by Service Type, 2025-2035
  • Figure 87: Western Europe Market Value (USD Million) Analysis by Mode of Transportation, 2020-2035
  • Figure 88: Western Europe Market Value Share (%) and BPS Analysis by Mode of Transportation, 2025-2035
  • Figure 89: Western Europe Market Y-o-Y Growth (%) Projections by Mode of Transportation, 2025-2035
  • Figure 90: Western Europe Market Value (USD Million) Analysis by Packaging Temperature Range, 2020-2035
  • Figure 91: Western Europe Market Value Share (%) and BPS Analysis by Packaging Temperature Range, 2025-2035
  • Figure 92: Western Europe Market Y-o-Y Growth (%) Projections by Packaging Temperature Range, 2025-2035
  • Figure 93: Western Europe Market Value (USD Million) Analysis by End User, 2020-2035
  • Figure 94: Western Europe Market Value Share (%) and BPS Analysis by End User, 2025-2035
  • Figure 95: Western Europe Market Y-o-Y Growth (%) Projections by End User, 2025-2035
  • Figure 96: Western Europe Market Attractiveness by Service Type, 2025-2035
  • Figure 97: Western Europe Market Attractiveness by Mode of Transportation, 2025-2035
  • Figure 98: Western Europe Market Attractiveness by Packaging Temperature Range, 2025-2035
  • Figure 99: Western Europe Market Attractiveness by End User, 2025-2035
  • Figure 100: Western Europe Market Attractiveness by Country, 2025-2035
  • Figure 101: Eastern Europe Market Value (USD Million) by Service Type, 2025-2035
  • Figure 102: Eastern Europe Market Value (USD Million) by Mode of Transportation, 2025-2035
  • Figure 103: Eastern Europe Market Value (USD Million) by Packaging Temperature Range, 2025-2035
  • Figure 104: Eastern Europe Market Value (USD Million) by End User, 2025-2035
  • Figure 105: Eastern Europe Market Value (USD Million) by Country, 2025-2035
  • Figure 106: Eastern Europe Market Value (USD Million) Analysis by Country, 2020-2035
  • Figure 107: Eastern Europe Market Value Share (%) and BPS Analysis by Country, 2025-2035
  • Figure 108: Eastern Europe Market Y-o-Y Growth (%) Projections by Country, 2025-2035
  • Figure 109: Eastern Europe Market Value (USD Million) Analysis by Service Type, 2020-2035
  • Figure 110: Eastern Europe Market Value Share (%) and BPS Analysis by Service Type, 2025-2035
  • Figure 111: Eastern Europe Market Y-o-Y Growth (%) Projections by Service Type, 2025-2035
  • Figure 112: Eastern Europe Market Value (USD Million) Analysis by Mode of Transportation, 2020-2035
  • Figure 113: Eastern Europe Market Value Share (%) and BPS Analysis by Mode of Transportation, 2025-2035
  • Figure 114: Eastern Europe Market Y-o-Y Growth (%) Projections by Mode of Transportation, 2025-2035
  • Figure 115: Eastern Europe Market Value (USD Million) Analysis by Packaging Temperature Range, 2020-2035
  • Figure 116: Eastern Europe Market Value Share (%) and BPS Analysis by Packaging Temperature Range, 2025-2035
  • Figure 117: Eastern Europe Market Y-o-Y Growth (%) Projections by Packaging Temperature Range, 2025-2035
  • Figure 118: Eastern Europe Market Value (USD Million) Analysis by End User, 2020-2035
  • Figure 119: Eastern Europe Market Value Share (%) and BPS Analysis by End User, 2025-2035
  • Figure 120: Eastern Europe Market Y-o-Y Growth (%) Projections by End User, 2025-2035
  • Figure 121: Eastern Europe Market Attractiveness by Service Type, 2025-2035
  • Figure 122: Eastern Europe Market Attractiveness by Mode of Transportation, 2025-2035
  • Figure 123: Eastern Europe Market Attractiveness by Packaging Temperature Range, 2025-2035
  • Figure 124: Eastern Europe Market Attractiveness by End User, 2025-2035
  • Figure 125: Eastern Europe Market Attractiveness by Country, 2025-2035
  • Figure 126: East Asia Market Value (USD Million) by Service Type, 2025-2035
  • Figure 127: East Asia Market Value (USD Million) by Mode of Transportation, 2025-2035
  • Figure 128: East Asia Market Value (USD Million) by Packaging Temperature Range, 2025-2035
  • Figure 129: East Asia Market Value (USD Million) by End User, 2025-2035
  • Figure 130: East Asia Market Value (USD Million) by Country, 2025-2035
  • Figure 131: East Asia Market Value (USD Million) Analysis by Country, 2020-2035
  • Figure 132: East Asia Market Value Share (%) and BPS Analysis by Country, 2025-2035
  • Figure 133: East Asia Market Y-o-Y Growth (%) Projections by Country, 2025-2035
  • Figure 134: East Asia Market Value (USD Million) Analysis by Service Type, 2020-2035
  • Figure 135: East Asia Market Value Share (%) and BPS Analysis by Service Type, 2025-2035
  • Figure 136: East Asia Market Y-o-Y Growth (%) Projections by Service Type, 2025-2035
  • Figure 137: East Asia Market Value (USD Million) Analysis by Mode of Transportation, 2020-2035
  • Figure 138: East Asia Market Value Share (%) and BPS Analysis by Mode of Transportation, 2025-2035
  • Figure 139: East Asia Market Y-o-Y Growth (%) Projections by Mode of Transportation, 2025-2035
  • Figure 140: East Asia Market Value (USD Million) Analysis by Packaging Temperature Range, 2020-2035
  • Figure 141: East Asia Market Value Share (%) and BPS Analysis by Packaging Temperature Range, 2025-2035
  • Figure 142: East Asia Market Y-o-Y Growth (%) Projections by Packaging Temperature Range, 2025-2035
  • Figure 143: East Asia Market Value (USD Million) Analysis by End User, 2020-2035
  • Figure 144: East Asia Market Value Share (%) and BPS Analysis by End User, 2025-2035
  • Figure 145: East Asia Market Y-o-Y Growth (%) Projections by End User, 2025-2035
  • Figure 146: East Asia Market Attractiveness by Service Type, 2025-2035
  • Figure 147: East Asia Market Attractiveness by Mode of Transportation, 2025-2035
  • Figure 148: East Asia Market Attractiveness by Packaging Temperature Range, 2025-2035
  • Figure 149: East Asia Market Attractiveness by End User, 2025-2035
  • Figure 150: East Asia Market Attractiveness by Country, 2025-2035
  • Figure 151: South Asia Market Value (USD Million) by Service Type, 2025-2035
  • Figure 152: South Asia Market Value (USD Million) by Mode of Transportation, 2025-2035
  • Figure 153: South Asia Market Value (USD Million) by Packaging Temperature Range, 2025-2035
  • Figure 154: South Asia Market Value (USD Million) by End User, 2025-2035
  • Figure 155: South Asia Market Value (USD Million) by Country, 2025-2035
  • Figure 156: South Asia Market Value (USD Million) Analysis by Country, 2020-2035
  • Figure 157: South Asia Market Value Share (%) and BPS Analysis by Country, 2025-2035
  • Figure 158: South Asia Market Y-o-Y Growth (%) Projections by Country, 2025-2035
  • Figure 159: South Asia Market Value (USD Million) Analysis by Service Type, 2020-2035
  • Figure 160: South Asia Market Value Share (%) and BPS Analysis by Service Type, 2025-2035
  • Figure 161: South Asia Market Y-o-Y Growth (%) Projections by Service Type, 2025-2035
  • Figure 162: South Asia Market Value (USD Million) Analysis by Mode of Transportation, 2020-2035
  • Figure 163: South Asia Market Value Share (%) and BPS Analysis by Mode of Transportation, 2025-2035
  • Figure 164: South Asia Market Y-o-Y Growth (%) Projections by Mode of Transportation, 2025-2035
  • Figure 165: South Asia Market Value (USD Million) Analysis by Packaging Temperature Range, 2020-2035
  • Figure 166: South Asia Market Value Share (%) and BPS Analysis by Packaging Temperature Range, 2025-2035
  • Figure 167: South Asia Market Y-o-Y Growth (%) Projections by Packaging Temperature Range, 2025-2035
  • Figure 168: South Asia Market Value (USD Million) Analysis by End User, 2020-2035
  • Figure 169: South Asia Market Value Share (%) and BPS Analysis by End User, 2025-2035
  • Figure 170: South Asia Market Y-o-Y Growth (%) Projections by End User, 2025-2035
  • Figure 171: South Asia Market Attractiveness by Service Type, 2025-2035
  • Figure 172: South Asia Market Attractiveness by Mode of Transportation, 2025-2035
  • Figure 173: South Asia Market Attractiveness by Packaging Temperature Range, 2025-2035
  • Figure 174: South Asia Market Attractiveness by End User, 2025-2035
  • Figure 175: South Asia Market Attractiveness by Country, 2025-2035
  • Figure 176: MEA Market Value (USD Million) by Service Type, 2025-2035
  • Figure 177: MEA Market Value (USD Million) by Mode of Transportation, 2025-2035
  • Figure 178: MEA Market Value (USD Million) by Packaging Temperature Range, 2025-2035
  • Figure 179: MEA Market Value (USD Million) by End User, 2025-2035
  • Figure 180: MEA Market Value (USD Million) by Country, 2025-2035
  • Figure 181: MEA Market Value (USD Million) Analysis by Country, 2020-2035
  • Figure 182: MEA Market Value Share (%) and BPS Analysis by Country, 2025-2035
  • Figure 183: MEA Market Y-o-Y Growth (%) Projections by Country, 2025-2035
  • Figure 184: MEA Market Value (USD Million) Analysis by Service Type, 2020-2035
  • Figure 185: MEA Market Value Share (%) and BPS Analysis by Service Type, 2025-2035
  • Figure 186: MEA Market Y-o-Y Growth (%) Projections by Service Type, 2025-2035
  • Figure 187: MEA Market Value (USD Million) Analysis by Mode of Transportation, 2020-2035
  • Figure 188: MEA Market Value Share (%) and BPS Analysis by Mode of Transportation, 2025-2035
  • Figure 189: MEA Market Y-o-Y Growth (%) Projections by Mode of Transportation, 2025-2035
  • Figure 190: MEA Market Value (USD Million) Analysis by Packaging Temperature Range, 2020-2035
  • Figure 191: MEA Market Value Share (%) and BPS Analysis by Packaging Temperature Range, 2025-2035
  • Figure 192: MEA Market Y-o-Y Growth (%) Projections by Packaging Temperature Range, 2025-2035
  • Figure 193: MEA Market Value (USD Million) Analysis by End User, 2020-2035
  • Figure 194: MEA Market Value Share (%) and BPS Analysis by End User, 2025-2035
  • Figure 195: MEA Market Y-o-Y Growth (%) Projections by End User, 2025-2035
  • Figure 196: MEA Market Attractiveness by Service Type, 2025-2035
  • Figure 197: MEA Market Attractiveness by Mode of Transportation, 2025-2035
  • Figure 198: MEA Market Attractiveness by Packaging Temperature Range, 2025-2035
  • Figure 199: MEA Market Attractiveness by End User, 2025-2035
  • Figure 200: MEA Market Attractiveness by Country, 2025-2035

Frequently Asked Questions

How big is the radiopharmaceutical logistics market in 2025?

The global radiopharmaceutical logistics market is estimated to be valued at USD 1,106.0 million in 2025.

What will be the size of the radiopharmaceutical logistics market in 2035?

The market size for radiopharmaceutical logistics market is projected to reach USD 2,740.6 million by 2035.

How much will the radiopharmaceutical logistics market grow between 2025 and 2035?

The radiopharmaceutical logistics market is expected to grow at a CAGR of 9.5% during this period.

What are the key Service Type in the radiopharmaceutical logistics market?

Service Type include Standard Delivery Services, and Time-critical Delivery Services

Which Mode of Transportation segment will contribute a significant share in the radiopharmaceutical logistics market in 2025?

The Air Freight segment is projected to command 36.0% of the market in 2025.

Explore Similar Insights

Future Market Insights

Radiopharmaceutical Logistics Market