Smart Logistics Services Market Size and Share Forecast Outlook 2025 to 2035

The Smart Logistics Services market is expected to record a valuation of USD 94.5 billion in 2025 and USD 243.8 billion in 2035, with an increase of USD 149,320.2 million, which equals a growth of 158% over the decade. The overall expansion represents a CAGR of 9.9% and a 2.6X increase in market size.
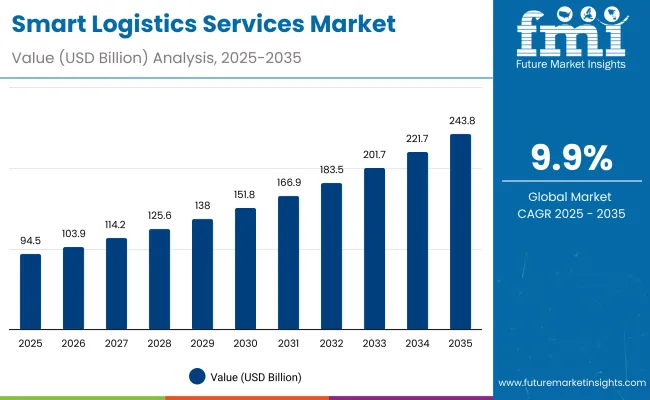
Quick Stats for Smart Logistics Services Market

  • Smart Logistics Services Market Value (2025): USD 94.5 billion
  • Smart Logistics Services Market Forecast Value (2035): USD 243.8 billion
  • Smart Logistics Services Market Forecast CAGR: 9.9%
  • Leading Segment in 2025: Last-mile optimization & orchestration (29.4%)
  • Key Growth Regions: China, India, USA, Germany, Japan, UK
  • Top Key Players: DHL Supply Chain, UPS Supply Chain Solutions, FedEx Logistics, Maersk Logistics & Services, Kuehne+Nagel, DSV, XPO, Flexport, GXO Logistics, ShipBob

Smart Logistics Services Market

Smart Logistics Services Market Key Takeaways

Metric Value
Market Estimated Value in (2025E) USD 94.5 billion
Market Forecast Value in (2035F) USD 243.8 billion
Forecast CAGR (2025 to 2035) 9.9%

During the first five-year period from 2025 to 2030, the market rises from USD 94.5 billion to USD 151,813.7 million, adding USD 57,294.8 million, which accounts for 38% of the total decade growth. This phase records steady adoption in retail & e-commerce, consumer electronics, and pharma logistics, driven by the need for last-mile efficiency and real-time visibility. Last-mile optimization & orchestration leads with a 29.4% share in 2025, while transaction-based models gain traction across enterprises.

The second half from 2030 to 2035 contributes USD 92,025.4 million, equal to 62% of total growth, as the market jumps from USD 151,813.7 million to USD 243.8 billion. This acceleration is powered by the widespread deployment of cloud-native logistics platforms, AI-driven control towers, robotics-enabled warehouses, and cold-chain compliance systems. By 2035, managed services strengthen their dominance with over 52% share, while China and India emerge as the fastest-growing regions, expanding at 10.1% and 11.2% CAGR respectively.

From 2020 to 2024, the smart logistics market was shaped by rapid digitization of supply chains, accelerated by e-commerce growth and post-pandemic resilience strategies. During this phase, the competitive landscape was led by global integrators such as DHL, UPS, and FedEx, who controlled a significant share of revenue. Competitive differentiation focused on network scale, last-mile efficiency, and integrated freight forwarding capabilities, while digital platforms and SaaS-based models were still in early adoption. Managed services accounted for a growing share but remained below 50% of market revenues.

By 2025, demand for Smart Logistics Services will expand to USD 94.5 billion, with the revenue mix shifting as managed services (52.1% share) and cloud-native deployments gain dominance. Traditional logistics giants face increasing competition from digital-first players such as Flexport and ShipBob, who leverage AI-driven control towers, subscription-based platforms, and cloud interoperability. The competitive edge is moving away from asset-heavy operations alone toward ecosystem integration, scalability, and recurring service revenues.

Why the Smart Logistics Services Market is growing?

Shift from Asset-Centric to Service-Centric Logistics - Enterprises are increasingly outsourcing logistics functions such as control tower management, returns optimization, and compliance monitoring. This transition toward managed services and SaaS-based orchestration is fueling recurring revenue streams and reducing reliance on traditional, asset-heavy models.

Regulatory Push for Transparency & Compliance - Governments worldwide are enforcing stricter trade compliance, cold-chain monitoring, and sustainability reporting. This is accelerating adoption of real-time visibility platforms, IoT-enabled monitoring, and AI-driven compliance tools, making smart logistics services a necessity rather than an optional upgrade.

Segmental Analysis

The Smart Logistics Services market is segmented by service type, transport mode, delivery model, pricing model, end industry, deployment, and region. Service offerings range from last-mile optimization, visibility platforms, digital freight brokerage, warehouse automation, cold-chain monitoring, reverse logistics, to customs compliance, catering to end-to-end logistics needs. Transport modes include road, ocean, air, rail, and multimodal, while delivery models span managed services, SaaS platforms, and shipper-carrier marketplaces. Pricing structures cover transaction-based, subscription, and contract models, with enterprises increasingly shifting toward predictable engagements. End-use industries such as retail & e-commerce, consumer electronics, pharma, automotive, manufacturing, and food & beverage drive adoption, supported by cloud-native, hybrid, and on-prem deployments. Regionally, growth is led by China and India, alongside steady expansion in the USA, Germany, Japan, and the UK, underscoring the global scale of adoption.
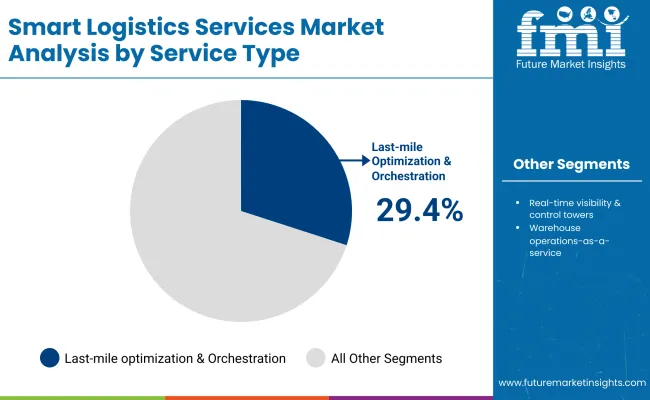
Insights into the Service Type Segment with Last-Mile Optimization Leading in Market Share

Smart Logistics Services Market By Service

Service Type Value Share% 2025
Last-mile optimization & orchestration 29.4%
Others 70.6%

The last-mile optimization & orchestration segment is projected to contribute 29.4% of the Smart Logistics Services revenue in 2025, maintaining its position as the leading service category. Growth is driven by the surge in retail and e-commerce deliveries, where efficient routing, orchestration platforms, and delivery scheduling are critical to customer satisfaction. Enterprises are prioritizing investments in AI-enabled route planning, automated dispatching, and dynamic fleet orchestration, making last-mile optimization central to logistics digitalization.

The segment’s momentum is further supported by the shift toward hyperlocal fulfillment centers, increased same-day/next-day delivery commitments, and integration with gig-economy delivery networks. As logistics providers scale operations across urban and semi-urban regions, last-mile solutions are being enhanced with real-time visibility, predictive analytics, and customer communication tools. This ensures that last-mile optimization remains the backbone of smart logistics services, anchoring digital transformation in the industry.
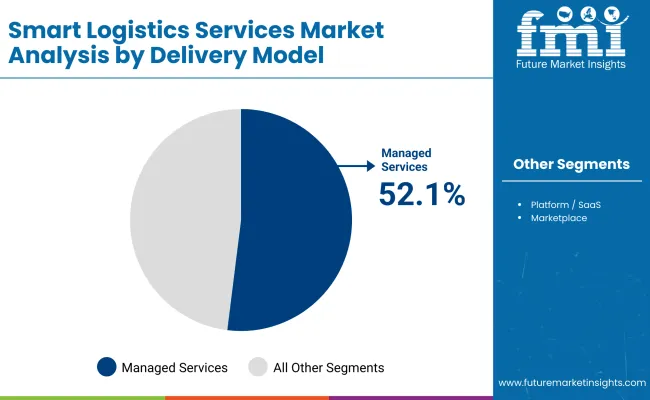
Insights into the Delivery Model Segment with Managed Services Dominating the Demand

Smart Logistics Services Market By Delivery

Delivery Model Value Share% 2025
Managed services 52.1%
Others 47.9%

The managed services segment is forecasted to hold 52.1% of the market share in 2025, led by its role in enabling enterprises to outsource complex logistics operations such as control tower management, BPO-driven orchestration, and end-to-end supply chain visibility. These services are favored for their ability to optimize cost, ensure regulatory compliance, and provide scalability, making them highly attractive to global shippers and manufacturers.

Widespread adoption is supported by the growing complexity of global trade, multi-country freight flows, and the need for 24/7 monitoring of logistics networks. Managed services providers are increasingly integrating AI-based predictive analytics, IoT-enabled tracking, and automated workflow management, reducing delays while enhancing resilience.

As industries expand cross-border operations and prioritize resilient, digital-first supply chains, managed services are expected to retain dominance, shaping the backbone of the Smart Logistics Services market over the next decade.
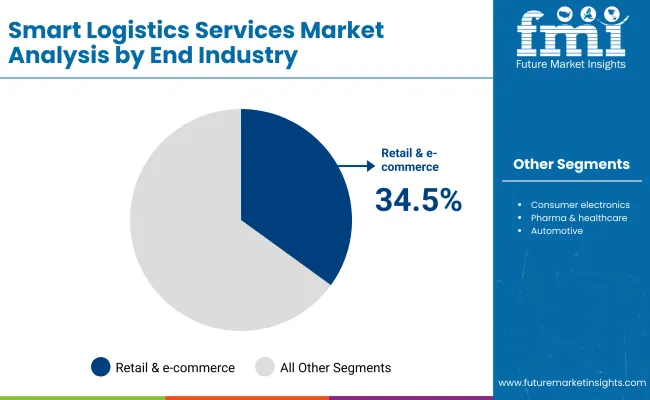
Insights into the End Industry Segment with Retail & E-commerce Leading in Market Share

Smart Logistics Services Market By End

End Industry Value Share% 2025
Retail & e-commerce 34.5%
Others 65.5%

The retail & e-commerce segment is projected to account for 34.5% of the Smart Logistics Services revenue in 2025, establishing it as the leading end-use industry. This dominance is driven by the surge in online shopping, omnichannel retailing, and demand for same-day/next-day delivery, which place immense pressure on logistics networks to operate with speed, visibility, and cost efficiency.

The segment benefits from the rapid deployment of AI-enabled last-mile optimization, real-time order tracking, automated returns management, and cloud-native orchestration platforms. Retailers and e-commerce giants are also investing in micro-fulfillment centers, warehouse robotics, and predictive analytics, ensuring shorter lead times and higher customer satisfaction.Given its scale, pace of innovation, and consumer-driven urgency, retail & e-commerce is expected to remain the backbone of demand in the Smart Logistics Services market throughout the forecast period.

What are the Drivers, Restraints, and Key Trends of the Smart Logistics Services market?

E-commerce Boom Driving Last-Mile Demand

The surge in global e-commerce and omnichannel retail is placing unprecedented demand on logistics networks, particularly in the last-mile segment. Customers expect faster deliveries, real-time tracking, and seamless returns, which is driving adoption of smart logistics services such as orchestration platforms, dynamic route optimization, and AI-powered fleet management. This rapid shift toward customer-centric delivery models ensures sustained growth for digital logistics solutions.

Rising Regulatory Compliance in Global Trade

Governments and trade authorities worldwide are tightening compliance standards related to customs, sustainability, and cold-chain monitoring. Industries such as pharmaceuticals, food, and healthcare face stringent requirements for safety and traceability. Smart logistics platforms with IoT sensors, AI-driven compliance tools, and control tower visibility are increasingly being deployed to ensure adherence. This regulatory push acts as a catalyst, driving enterprises to invest in smart logistics systems.

High Integration & Transition Costs

Despite its benefits, the adoption of smart logistics services is often slowed by high transition costs. Integrating AI-enabled platforms, robotics, and cloud-based orchestration into legacy supply chain systems requires significant capital investment and skilled workforce training. Small and mid-sized enterprises, in particular, face challenges in justifying these upfront costs, which creates a barrier to large-scale adoption and slows the pace of market expansion.

Shift Toward Platformization and Service-Centric Models

A major trend shaping the industry is the pivot from asset-heavy operations to service-driven logistics ecosystems. Providers are increasingly adopting platform-based models-SaaS logistics tools, managed service engagements, and digital freight marketplaces-that generate recurring revenues and foster ecosystem collaboration. This platformization trend is further enhanced by AI, predictive analytics, and cloud-native deployments, enabling logistics players to scale efficiently while delivering end-to-end digital visibility.
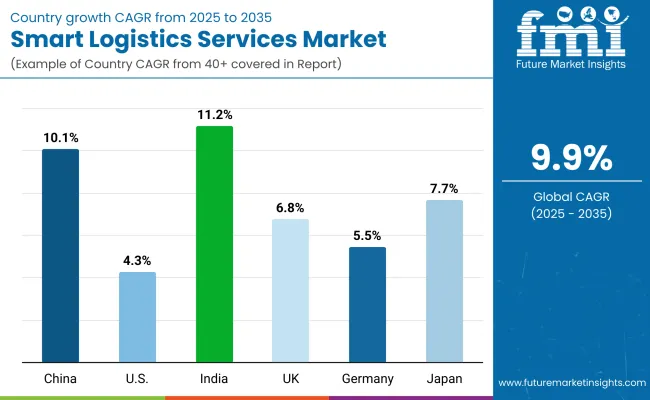
Analysis of Smart Logistics Services Market By Key Countries

Smart Logistics Services Market By Country

Countries Estimated CAGR (2025 to 2035)
China 10.1%
USA 4.3%
India 11.2%
UK 6.8%
Germany 5.5%
Japan 7.7%

The global Smart Logistics Services market shows strong regional variations in adoption speed, largely shaped by e-commerce expansion, digital infrastructure maturity, and regulatory mandates for supply chain visibility.

Asia-Pacific emerges as the fastest-growing region, anchored by India at 11.2% CAGR and China at 10.1% CAGR. India’s trajectory reflects rising digitization initiatives, adoption of control tower platforms, and growing demand for managed logistics services from manufacturing and e-commerce sectors. China’s growth is supported by its cross-border e-commerce ecosystem, government-backed digital trade corridors, and investments in AI-driven logistics visibility and compliance platforms. Europe maintains a robust growth profile, led by Germany (5.5%) and the UK (6.8%), with adoption supported by stringent compliance frameworks, carbon reporting mandates, and logistics automation in retail and automotive supply chains.

Germany’s logistics service providers are rapidly deploying warehouse robotics and cloud-native orchestration platforms, while the UK is expanding in returns management and last-mile delivery optimization. North America shows moderate expansion, with the USA at 4.3% CAGR, reflecting a mature logistics infrastructure and widespread adoption of 3PL/4PL models. Growth here is more service-driven, with demand concentrated in subscription-based SaaS logistics platforms, AR/VR-enabled warehouse training, and AI-powered fleet orchestration rather than large-scale infrastructure overhauls. Japan (7.7%) balances steady growth through automation in cold-chain logistics, robotics-driven warehouses, and IoT-enabled monitoring for pharmaceuticals and food safety, highlighting its focus on quality and compliance-driven adoption.
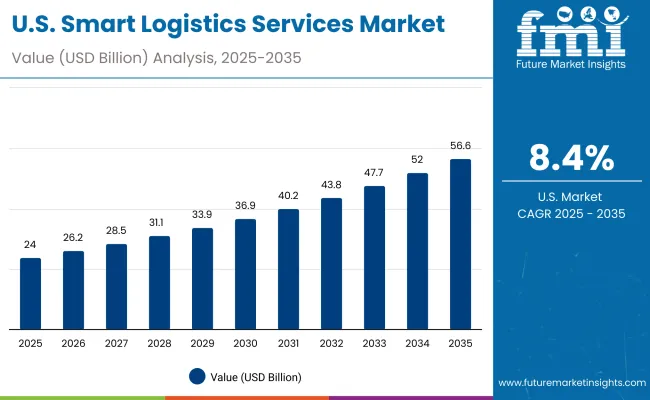
Sales Outlook for 3D Scanning in the United States

Smart Logistics Services Market Usa

Year USA Smart Logistics Services (USD Billion)
2025 24086.23
2026 26238.16
2027 28582.36
2028 31135.98
2029 33917.76
2030 36948.07
2031 40249.12
2032 43845.09
2033 47762.33
2034 52029.55
2035 56678.02

The USA Smart Logistics Services market is projected to expand at a steady CAGR of ~8.4% (2025-2035), supported by the widespread adoption of digital platforms, automation, and managed logistics services. Growth is led by retail and e-commerce, where demand for last-mile optimization, real-time visibility, and returns management is rising sharply. Manufacturing and automotive supply chains are increasingly adopting orchestration platforms and predictive analytics to streamline multi-modal logistics.

Healthcare and pharma logistics are also key contributors, with cold-chain monitoring and compliance-driven digital solutions gaining traction. In addition, sustainability-focused reporting and carbon tracking mandates are creating new demand for cloud-based orchestration and SaaS models.

  • E-commerce and retail: High adoption of managed logistics platforms for returns and last-mile efficiency.
  • Healthcare & pharmaceuticals: Rising use of IoT-enabled cold chain monitoring to meet FDA compliance.
  • Automotive & manufacturing: Integration of AI-driven orchestration and predictive analytics for multi-tier supply chains.

Growth and Expansion Outlook for Smart Logistics Services Market in the United Kingdom

The Smart Logistics Services Market in the UK is expected to grow at a CAGR of ~6.8% (2025-2035), fueled by strong e-commerce penetration, sustainability targets, and digital-first logistics transformation. Retailers are adopting last-mile orchestration platforms to improve same-day and next-day delivery, while the manufacturing sector is investing in predictive logistics solutions to optimize multi-modal supply chains. Public-private collaborations under the UK’s Future of Mobility and Net-Zero initiatives are pushing enterprises to integrate green logistics reporting and EV-based delivery networks.

  • Retailers are deploying AI-driven orchestration tools to cut delivery times and optimize returns.
  • Logistics firms are integrating carbon footprint tracking into operations to align with ESG mandates.
  • Public-private programs are boosting adoption of green fleet management and smart warehousing.

Growth and Expansion Outlook for Smart Logistics Services Market in India

India is witnessing rapid growth in the Smart Logistics Services Market, projected to expand at a CAGR of ~11.2% (2025-2035). This momentum is supported by rising e-commerce activity in tier-2 and tier-3 cities, government-backed Digital India and Gati Shakti initiatives, and cost-efficient managed service platforms. MSMEs and regional manufacturers are turning to cloud-based orchestration to reduce inefficiencies in fragmented logistics networks. Additionally, the growing adoption of AI-based route optimization and IoT-enabled fleet monitoring is streamlining operations for retail, pharma, and automotive supply chains.

  • E-commerce growth in smaller cities is fueling demand for last-mile orchestration services.
  • MSMEs are leveraging cost-effective managed logistics platforms for scale and visibility.
  • Government programs are accelerating the adoption of digitized freight management systems.

Sales Outlook for Smart Logistics Services in China

The Smart Logistics Services Market in China is forecasted to grow at a CAGR of ~10.1% (2025-2035), the highest among leading economies. Expansion is driven by nationwide smart city programs, advanced e-commerce ecosystems, and large-scale industrial automation. Chinese retailers and manufacturers are increasingly adopting autonomous delivery systems, AI-driven orchestration, and IoT-enabled warehousing. Municipal projects around digital twins and logistics hubs are further accelerating adoption. Local technology firms, with competitive pricing and innovation in AI + logistics platforms, are also enabling faster integration of smart logistics across sectors.

  • Smart city initiatives are integrating AI-driven logistics orchestration platforms for urban supply chains.
  • Leading e-commerce firms are expanding autonomous delivery fleets and smart warehousing systems.
  • Local tech players are offering competitive, AI-enabled logistics solutions, driving cross-sector adoption.

In-depth Analysis of Smart Logistics Services in Germany

Countries 2025 Share (%)
USA 25.5%
China 7.9%
Japan 6.0%
Germany 10.4%
UK 7.1%
India 3.6%
Countries 2035 Share (%)
USA 23.2%
China 11.9%
Japan 6.9%
Germany 15.3%
UK 8.1%
India 4.9%

The Smart Logistics Services Market in Germany is expected to expand steadily at a CAGR of ~5.5% (2025-2035), supported by the country’s strong industrial base and leadership in Industry 4.0 adoption. German manufacturers are increasingly embedding AI-driven logistics orchestration platforms into production and distribution to synchronize factory output with global supply chains. Automotive OEMs and tier-1 suppliers are leveraging predictive logistics services for just-in-time and just-in-sequence delivery. Logistics hubs across Hamburg, Frankfurt, and Munich are integrating IoT-enabled warehousing to support Europe’s growing e-commerce demand. Furthermore, compliance with EU sustainability directives is pushing logistics firms to adopt EV-based fleet management, carbon tracking, and circular packaging logistics.
  • Automotive supply chains are adopting predictive logistics platforms for just-in-sequence deliveries.
  • Smart warehouses with IoT and robotics are being deployed in key logistics corridors.
  • Sustainability regulations are driving adoption of EV fleets and carbon-tracking services.

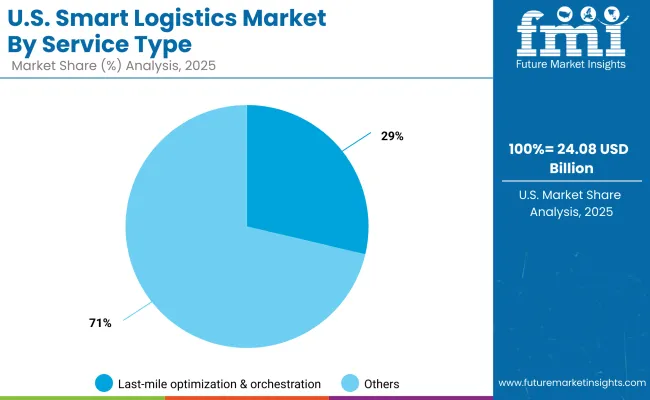
Growth Outlook for Smart Logistics Services Market in USA

Smart Logistics Services Market Usa 2

USA By Service Type Value Share% 2025
Last-mile optimization & orchestration 28.7%
Others 71.3%

The Smart Logistics Services Market in the United States is projected at USD 24,086.23million in 2025, with last-mile optimization & orchestration accounting for 28.7% of total market value. This strong share reflects the USA focus on addressing delivery bottlenecks in urban areas and meeting consumer expectations for same-day and next-day delivery. Service-based solutions such as route optimization, dynamic scheduling, and AI-driven demand forecasting are gaining priority over traditional logistics infrastructure upgrades.

The USA market is also witnessing a shift toward cloud-based logistics management systems, which allow for real-time fleet visibility, integration with e-commerce platforms, and improved customer communication. Retailers and logistics providers are investing heavily in automation-enabled warehouses and driverless delivery pilots, further accelerating adoption. Sustainability goals, particularly around electrification of delivery fleets and carbon-neutral logistics strategies, are additional growth drivers.
  • The USA market contributes 25.5% of the global share in 2025.
  • Last-mile services lead at 28.7%, underscoring urban delivery challenges.
  • Growth driven by cloud-based platforms, automation, and EV fleet adoption.

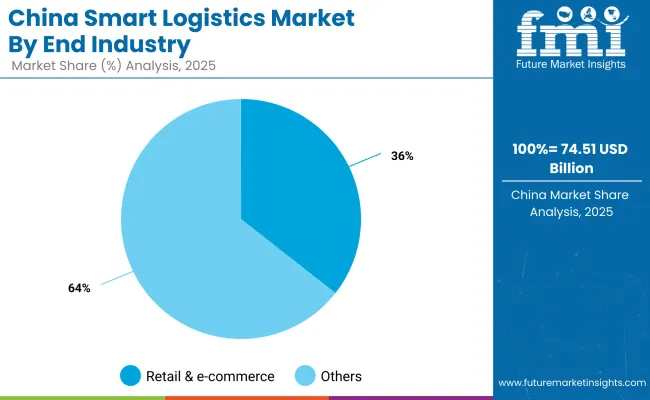
Opportunity Analysis of China Smart Logistics Market

Smart Logistics Services Market China

China By End Industry Value Share% 2025
Retail & e-commerce 35.6%
Others 64.4%

The Smart Logistics Services Market in China is valued at USD 7451.14 million in 2025. The dominance of warehouse automation is driven by China’s high-volume e-commerce and retail sectors, which require fast, accurate, and scalable order fulfillment. Automated guided vehicles (AGVs), robotic sorting, and AI-driven inventory tracking are increasingly critical to reducing operational bottlenecks and improving delivery speed.

Portability, modularity, and integration with existing warehouse management systems (WMS) further accelerate adoption, making warehouse automation the backbone of efficient logistics operations. Transportation optimization platforms remain important for urban delivery and last-mile logistics but show slightly slower growth due to infrastructure limitations and regulatory compliance requirements.

As China expands Industry 4.0 and smart city initiatives, AI-powered predictive analytics combined with smart logistics services will become essential for real-time supply chain visibility, cost reduction, and service-level improvement.
  • Market size for China in 2025: USD 7451.14 million
  • Global market share: 7.9%
  • End Industry leads at 35.6% due to high e-commerce and retail logistics demand

Competitive Landscape of Smart Logistics Market

Smart Logistics Services Market By Company

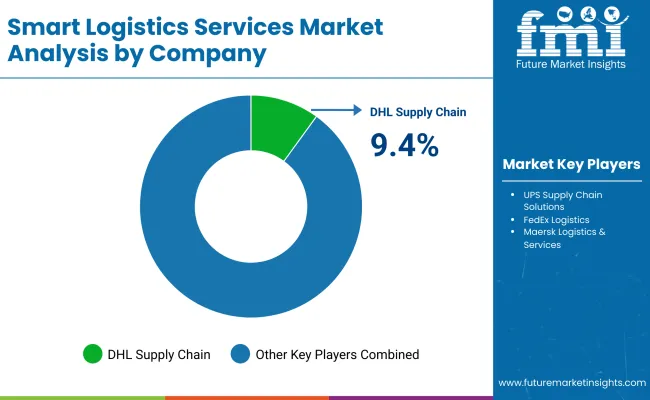
The Smart Logistics Services Market is moderately fragmented, featuring global leaders, regional innovators, and niche-focused specialists operating across multiple logistics segments. Major players such as DHL Supply Chain, Kuehne + Nagel, and DB Schenker hold significant market share, driven by advanced warehouse automation, AI-based route optimization, and end-to-end supply chain visibility solutions. Their strategies increasingly emphasize predictive analytics, IoT-enabled fleet management, and cloud-based logistics platforms for e-commerce, retail, and industrial clients.Mid-sized players, including XPO Logistics, GXO Logistics, and CEVA Logistics, focus on flexible and technology-driven offerings such as last-mile delivery optimization, autonomous guided vehicle (AGV) integration, and smart inventory management. Their adoption is fueled by modular, scalable solutions suitable for both urban and regional supply chains.

Specialized providers like ShipBob, Stord, and Flexport cater to specific niches such as SME e-commerce fulfillment, temperature-sensitive logistics, or customized regional delivery services. Their competitive edge lies in tailored solutions, regional adaptability, and integration with client-specific platforms rather than global reach. Competitive differentiation is increasingly moving away from individual service offerings toward integrated ecosystems combining predictive analytics, real-time tracking, AI-driven automation, and subscription-based logistics solutions.

Key Developments

  • 2023: Major logistics providers implemented AI-driven warehouse management systems, combining robotic sorting, automated guided vehicles, and predictive inventory analytics. This development significantly increased operational efficiency, reduced fulfillment errors, and accelerated delivery timelines, particularly in e-commerce and retail sectors, strengthening real-time supply chain responsiveness.
  • 2024: Smart logistics operators deployed IoT-enabled sensors and GPS-based tracking across fleets, enabling end-to-end visibility and predictive route optimization. This innovation improved on-time deliveries, lowered fuel consumption, and enhanced proactive maintenance, positioning real-time monitoring as a core component of modern, technology-driven logistics services.

Scope of the Report

Item Value
Quantitative Units USD 94,518.9 Million
Service Type Last-mile optimization & orchestration, Real-time visibility & control towers, Digital freight brokerage & TMS-as-a-service, Warehouse operations-as-a-service (WMS, robotics enablement), Cold-chain monitoring & compliance, Reverse logistics & returns optimization, Customs & trade compliance services
Transport Mode Road, Ocean, Air, Rail, Multimodal
Delivery Model Managed services (outsourced ops, control tower BPO), Platform / SaaS (self-serve), Marketplace (shipper-carrier network)
Pricing Model Transaction-based (per shipment/stop), Subscription (seat / account / lane), Contract / retainer (managed engagement)
End Industry Retail & e-commerce, Consumer electronics, Pharma & healthcare, Automotive, Industrial & manufacturing, Food & beverage
Deployment Cloud-native, Hybrid, On- prem managed
Regions Covered North America, Europe, Asia-Pacific, Latin America, Middle East & Africa
Country Covered United States, Canada, Germany, France, United Kingdom, China, Japan, India, Brazil, South Africa
Key Companies Profiled DHL Supply Chain, UPS Supply Chain Solutions, FedEx Logistics, Maersk Logistics & Services, Kuehne+Nagel, DSV, XPO, Flexport, GXO Logistics, ShipBob
Additional Attributes Revenue segmentation by service type and pet type, adoption trends of mobile versus traditional grooming, rising demand for eco-friendly and premium treatments, growth in luxury grooming services, app-based booking and tracking platforms, integration with tele-grooming and AI-based pet monitoring, regional trends shaped by urbanization and pet ownership, and innovations in portable grooming equipment and automated tools.

Key Segments

By Service Type:

  • Last-mile optimization & orchestration
  • Real-time visibility & control towers
  • Digital freight brokerage & TMS-as-a-service
  • Warehouse operations-as-a-service (WMS, robotics enablement)
  • Cold-chain monitoring & compliance
  • Reverse logistics & returns optimization
  • Customs & trade compliance services

By Transport Mode:

  • Road
  • Ocean
  • Air
  • Rail
  • Multimodal

By Delivery Model:

  • Managed services (outsourced ops, control tower BPO)
  • Platform / SaaS (self-serve)
  • Marketplace (shipper-carrier network)

By Pricing Model:

  • Transaction-based (per shipment/stop)
  • Subscription (seat / account / lane)
  • Contract / retainer (managed engagement)

By End Industry:

  • Retail & e-commerce
  • Consumer electronics
  • Pharma & healthcare
  • Automotive
  • Industrial & manufacturing
  • Food & beverage

By Deployment:

  • Cloud-native
  • Hybrid
  • On-prem managed

By Region:

  • North America
  • Latin America
  • Europe
  • East Asia
  • South Asia & Pacific
  • Middle East and Africa

Table of Content

  1. Executive Summary
    • Global Market Outlook
    • Demand-side Trends
    • Supply-side Trends
    • Technology Roadmap Analysis
    • Analysis and Recommendations
  2. Market Overview
    • Market Coverage / Taxonomy
    • Market Definition / Scope / Limitations
  3. Market Background
    • Market Dynamics
      • Drivers
      • Restraints
      • Opportunity
      • Trends
    • Scenario Forecast
      • Demand in Optimistic Scenario
      • Demand in Likely Scenario
      • Demand in Conservative Scenario
    • Opportunity Map Analysis
    • Product Life Cycle Analysis
    • Supply Chain Analysis
      • Supply Side Participants and their Roles
        • Producers
        • Mid-Level Participants (Traders/ Agents/ Brokers)
        • Wholesalers and Distributors
      • Value Added and Value Created at Node in the Supply Chain
      • List of Raw Material Suppliers
      • List of Existing and Potential Buyer’s
    • Investment Feasibility Matrix
    • Value Chain Analysis
      • Profit Margin Analysis
      • Wholesalers and Distributors
      • Retailers
    • PESTLE and Porter’s Analysis
    • Regulatory Landscape
      • By Key Regions
      • By Key Countries
    • Regional Parent Market Outlook
    • Production and Consumption Statistics
    • Import and Export Statistics
  4. Global Analysis 2020 to 2024 and Forecast, 2025 to 2035
    • Historical Market Size Value (USD Million) & Volume (Units) Analysis, 2020 to 2024
    • Current and Future Market Size Value (USD Million) & Volume (Units) Projections, 2025 to 2035
      • Y-o-Y Growth Trend Analysis
      • Absolute $ Opportunity Analysis
  5. Global Analysis 2020 to 2024 and Forecast 2025 to 2035, By Service Type
    • Introduction / Key Findings
    • Historical Market Size Value (USD Million) & Volume (Units) Analysis By Service Type, 2020 to 2024
    • Current and Future Market Size Value (USD Million) & Volume (Units) Analysis and Forecast By Service Type, 2025 to 2035
      • Last-mile optimization & orchestration
      • Real-time visibility & control towers
      • Digital freight brokerage & TMS-as-a-service
      • Warehouse operations-as-a-service (WMS, robotics enablement)
      • Cold-chain monitoring & compliance
      • Reverse logistics & returns optimization
      • Customs & trade compliance services
    • Y-o-Y Growth Trend Analysis By Service Type, 2020 to 2024
    • Absolute $ Opportunity Analysis By Service Type, 2025 to 2035
  6. Global Analysis 2020 to 2024 and Forecast 2025 to 2035, By Transport Mode
    • Introduction / Key Findings
    • Historical Market Size Value (USD Million) & Volume (Units) Analysis By Transport Mode, 2020 to 2024
    • Current and Future Market Size Value (USD Million) & Volume (Units) Analysis and Forecast By Transport Mode, 2025 to 2035
      • Road
      • Ocean
      • Air
      • Rail
      • Multimodal
    • Y-o-Y Growth Trend Analysis By Transport Mode, 2020 to 2024
    • Absolute $ Opportunity Analysis By Transport Mode, 2025 to 2035
  7. Global Analysis 2020 to 2024 and Forecast 2025 to 2035, By Delivery Model
    • Introduction / Key Findings
    • Historical Market Size Value (USD Million) & Volume (Units) Analysis By Delivery Model, 2020 to 2024
    • Current and Future Market Size Value (USD Million) & Volume (Units) Analysis and Forecast By Delivery Model, 2025 to 2035
      • Managed services (outsourced ops, control tower BPO)
      • Platform / SaaS (self-serve)
      • Marketplace (shipper-carrier network)
    • Y-o-Y Growth Trend Analysis By Delivery Model, 2020 to 2024
    • Absolute $ Opportunity Analysis By Delivery Model, 2025 to 2035
  8. Global Analysis 2020 to 2024 and Forecast 2025 to 2035, By Pricing Model
    • Introduction / Key Findings
    • Historical Market Size Value (USD Million) & Volume (Units) Analysis By Pricing Model, 2020 to 2024
    • Current and Future Market Size Value (USD Million) & Volume (Units) Analysis and Forecast By Pricing Model, 2025 to 2035
      • Transaction-based (per shipment/stop)
      • Subscription (seat / account / lane)
      • Contract / retainer (managed engagement)
    • Y-o-Y Growth Trend Analysis By Pricing Model, 2020 to 2024
    • Absolute $ Opportunity Analysis By Pricing Model, 2025 to 2035
  9. Global Analysis 2020 to 2024 and Forecast 2025 to 2035, By End Industry
    • Introduction / Key Findings
    • Historical Market Size Value (USD Million) & Volume (Units) Analysis By End Industry, 2020 to 2024
    • Current and Future Market Size Value (USD Million) & Volume (Units) Analysis and Forecast By End Industry, 2025 to 2035
      • Retail & e-commerce
      • Consumer electronics
      • Pharma & healthcare
      • Automotive
      • Industrial & manufacturing
      • Food & beverage
    • Y-o-Y Growth Trend Analysis By End Industry, 2020 to 2024
    • Absolute $ Opportunity Analysis By End Industry, 2025 to 2035
  10. Global Analysis 2020 to 2024 and Forecast 2025 to 2035, By Deployment
    • Introduction / Key Findings
    • Historical Market Size Value (USD Million) & Volume (Units) Analysis By Deployment, 2020 to 2024
    • Current and Future Market Size Value (USD Million) & Volume (Units) Analysis and Forecast By Deployment, 2025 to 2035
      • Cloud-native
      • Hybrid
      • On-prem managed
    • Y-o-Y Growth Trend Analysis By Deployment, 2020 to 2024
    • Absolute $ Opportunity Analysis By Deployment, 2025 to 2035
  11. Global Analysis 2020 to 2024 and Forecast 2025 to 2035, By Region
    • Introduction
    • Historical Market Size Value (USD Million) & Volume (Units) Analysis By Region, 2020 to 2024
    • Current Market Size Value (USD Million) & Volume (Units) Analysis and Forecast By Region, 2025 to 2035
      • North America
      • Latin America
      • Europe
      • East Asia
      • South Asia & Pacific
      • Middle East and Africa
    • Market Attractiveness Analysis By Region
  12. North America Analysis 2020 to 2024 and Forecast 2025 to 2035, By Country
    • Historical Market Size Value (USD Million) & Volume (Units) Trend Analysis By Market Taxonomy, 2020 to 2024
    • Market Size Value (USD Million) & Volume (Units) Forecast By Market Taxonomy, 2025 to 2035
      • By Country
        • USA
        • Canada
      • By Service Type
      • By Transport Mode
      • By Delivery Model
      • By Pricing Model
      • By End Industry
      • By Deployment
    • Market Attractiveness Analysis
      • By Country
      • By Service Type
      • By Transport Mode
      • By Delivery Model
      • By Pricing Model
      • By End Industry
      • By Deployment
    • Key Takeaways
  13. Latin America Analysis 2020 to 2024 and Forecast 2025 to 2035, By Country
    • Historical Market Size Value (USD Million) & Volume (Units) Trend Analysis By Market Taxonomy, 2020 to 2024
    • Market Size Value (USD Million) & Volume (Units) Forecast By Market Taxonomy, 2025 to 2035
      • By Country
        • Brazil
        • Mexico
        • Colombia
        • Rest of Latin America
      • By Service Type
      • By Transport Mode
      • By Delivery Model
      • By Pricing Model
      • By End Industry
      • By Deployment
    • Market Attractiveness Analysis
      • By Country
      • By Service Type
      • By Transport Mode
      • By Delivery Model
      • By Pricing Model
      • By End Industry
      • By Deployment
    • Key Takeaways
  14. Europe Analysis 2020 to 2024 and Forecast 2025 to 2035, By Country
    • Historical Market Size Value (USD Million) & Volume (Units) Trend Analysis By Market Taxonomy, 2020 to 2024
    • Market Size Value (USD Million) & Volume (Units) Forecast By Market Taxonomy, 2025 to 2035
      • By Country
        • Germany
        • UK
        • France
        • Italy
        • Spain
        • Belgium
        • Netherlands
        • Nordic
        • Switzerland
        • Russia
        • Poland
        • Rest of Europe
      • By Service Type
      • By Transport Mode
      • By Delivery Model
      • By Pricing Model
      • By End Industry
      • By Deployment
    • Market Attractiveness Analysis
      • By Country
      • By Service Type
      • By Transport Mode
      • By Delivery Model
      • By Pricing Model
      • By End Industry
      • By Deployment
    • Key Takeaways
  15. East Asia Analysis 2020 to 2024 and Forecast 2025 to 2035, By Country
    • Historical Market Size Value (USD Million) & Volume (Units) Trend Analysis By Market Taxonomy, 2020 to 2024
    • Market Size Value (USD Million) & Volume (Units) Forecast By Market Taxonomy, 2025 to 2035
      • By Country
        • China
        • Japan
        • South Korea
      • By Service Type
      • By Transport Mode
      • By Delivery Model
      • By Pricing Model
      • By End Industry
      • By Deployment
    • Market Attractiveness Analysis
      • By Country
      • By Service Type
      • By Transport Mode
      • By Delivery Model
      • By Pricing Model
      • By End Industry
      • By Deployment
    • Key Takeaways
  16. South Asia & Pacific Analysis 2020 to 2024 and Forecast 2025 to 2035, By Country
    • Historical Market Size Value (USD Million) & Volume (Units) Trend Analysis By Market Taxonomy, 2020 to 2024
    • Market Size Value (USD Million) & Volume (Units) Forecast By Market Taxonomy, 2025 to 2035
      • By Country
        • India
        • Thailand
        • Malaysia
        • Indonesia
        • Singapore
        • Vietnam
        • Australia
        • New Zealand
        • Rest of South Asia
      • By Service Type
      • By Transport Mode
      • By Delivery Model
      • By Pricing Model
      • By End Industry
      • By Deployment
    • Market Attractiveness Analysis
      • By Country
      • By Service Type
      • By Transport Mode
      • By Delivery Model
      • By Pricing Model
      • By End Industry
      • By Deployment
    • Key Takeaways
  17. Middle East and Africa Analysis 2020 to 2024 and Forecast 2025 to 2035, By Country
    • Historical Market Size Value (USD Million) & Volume (Units) Trend Analysis By Market Taxonomy, 2020 to 2024
    • Market Size Value (USD Million) & Volume (Units) Forecast By Market Taxonomy, 2025 to 2035
      • By Country
        • Turkey
        • UAE
        • Saudi Arabia
        • Israel
        • Other GCC Countries
        • North Africa
        • South Africa
      • By Service Type
      • By Transport Mode
      • By Delivery Model
      • By Pricing Model
      • By End Industry
      • By Deployment
    • Market Attractiveness Analysis
      • By Country
      • By Service Type
      • By Transport Mode
      • By Delivery Model
      • By Pricing Model
      • By End Industry
      • By Deployment
    • Key Takeaways
  18. Key Countries Analysis
    • USA
      • Pricing Analysis
      • Market Share Analysis, 2024
        • By Service Type
        • By Transport Mode
        • By Delivery Model
        • By Pricing Model
        • By End Industry
        • By Deployment
    • Canada
      • Pricing Analysis
      • Market Share Analysis, 2024
        • By Service Type
        • By Transport Mode
        • By Delivery Model
        • By Pricing Model
        • By End Industry
        • By Deployment
    • Brazil
      • Pricing Analysis
      • Market Share Analysis, 2024
        • By Service Type
        • By Transport Mode
        • By Delivery Model
        • By Pricing Model
        • By End Industry
        • By Deployment
    • Mexico
      • Pricing Analysis
      • Market Share Analysis, 2024
        • By Service Type
        • By Transport Mode
        • By Delivery Model
        • By Pricing Model
        • By End Industry
        • By Deployment
    • Colombia
      • Pricing Analysis
      • Market Share Analysis, 2024
        • By Service Type
        • By Transport Mode
        • By Delivery Model
        • By Pricing Model
        • By End Industry
        • By Deployment
    • Germany
      • Pricing Analysis
      • Market Share Analysis, 2024
        • By Service Type
        • By Transport Mode
        • By Delivery Model
        • By Pricing Model
        • By End Industry
        • By Deployment
    • UK
      • Pricing Analysis
      • Market Share Analysis, 2024
        • By Service Type
        • By Transport Mode
        • By Delivery Model
        • By Pricing Model
        • By End Industry
        • By Deployment
    • France
      • Pricing Analysis
      • Market Share Analysis, 2024
        • By Service Type
        • By Transport Mode
        • By Delivery Model
        • By Pricing Model
        • By End Industry
        • By Deployment
    • Italy
      • Pricing Analysis
      • Market Share Analysis, 2024
        • By Service Type
        • By Transport Mode
        • By Delivery Model
        • By Pricing Model
        • By End Industry
        • By Deployment
    • Spain
      • Pricing Analysis
      • Market Share Analysis, 2024
        • By Service Type
        • By Transport Mode
        • By Delivery Model
        • By Pricing Model
        • By End Industry
        • By Deployment
    • Belgium
      • Pricing Analysis
      • Market Share Analysis, 2024
        • By Service Type
        • By Transport Mode
        • By Delivery Model
        • By Pricing Model
        • By End Industry
        • By Deployment
    • Netherlands
      • Pricing Analysis
      • Market Share Analysis, 2024
        • By Service Type
        • By Transport Mode
        • By Delivery Model
        • By Pricing Model
        • By End Industry
        • By Deployment
    • Nordic
      • Pricing Analysis
      • Market Share Analysis, 2024
        • By Service Type
        • By Transport Mode
        • By Delivery Model
        • By Pricing Model
        • By End Industry
        • By Deployment
    • Switzerland
      • Pricing Analysis
      • Market Share Analysis, 2024
        • By Service Type
        • By Transport Mode
        • By Delivery Model
        • By Pricing Model
        • By End Industry
        • By Deployment
    • Russia
      • Pricing Analysis
      • Market Share Analysis, 2024
        • By Service Type
        • By Transport Mode
        • By Delivery Model
        • By Pricing Model
        • By End Industry
        • By Deployment
    • Poland
      • Pricing Analysis
      • Market Share Analysis, 2024
        • By Service Type
        • By Transport Mode
        • By Delivery Model
        • By Pricing Model
        • By End Industry
        • By Deployment
    • China
      • Pricing Analysis
      • Market Share Analysis, 2024
        • By Service Type
        • By Transport Mode
        • By Delivery Model
        • By Pricing Model
        • By End Industry
        • By Deployment
    • Japan
      • Pricing Analysis
      • Market Share Analysis, 2024
        • By Service Type
        • By Transport Mode
        • By Delivery Model
        • By Pricing Model
        • By End Industry
        • By Deployment
    • South Korea
      • Pricing Analysis
      • Market Share Analysis, 2024
        • By Service Type
        • By Transport Mode
        • By Delivery Model
        • By Pricing Model
        • By End Industry
        • By Deployment
    • India
      • Pricing Analysis
      • Market Share Analysis, 2024
        • By Service Type
        • By Transport Mode
        • By Delivery Model
        • By Pricing Model
        • By End Industry
        • By Deployment
    • Thailand
      • Pricing Analysis
      • Market Share Analysis, 2024
        • By Service Type
        • By Transport Mode
        • By Delivery Model
        • By Pricing Model
        • By End Industry
        • By Deployment
    • Indonesia
      • Pricing Analysis
      • Market Share Analysis, 2024
        • By Service Type
        • By Transport Mode
        • By Delivery Model
        • By Pricing Model
        • By End Industry
        • By Deployment
    • Australia
      • Pricing Analysis
      • Market Share Analysis, 2024
        • By Service Type
        • By Transport Mode
        • By Delivery Model
        • By Pricing Model
        • By End Industry
        • By Deployment
    • New Zealand
      • Pricing Analysis
      • Market Share Analysis, 2024
        • By Service Type
        • By Transport Mode
        • By Delivery Model
        • By Pricing Model
        • By End Industry
        • By Deployment
    • Turkey
      • Pricing Analysis
      • Market Share Analysis, 2024
        • By Service Type
        • By Transport Mode
        • By Delivery Model
        • By Pricing Model
        • By End Industry
        • By Deployment
    • UAE
      • Pricing Analysis
      • Market Share Analysis, 2024
        • By Service Type
        • By Transport Mode
        • By Delivery Model
        • By Pricing Model
        • By End Industry
        • By Deployment
    • Saudi Arabia
      • Pricing Analysis
      • Market Share Analysis, 2024
        • By Service Type
        • By Transport Mode
        • By Delivery Model
        • By Pricing Model
        • By End Industry
        • By Deployment
    • Israel
      • Pricing Analysis
      • Market Share Analysis, 2024
        • By Service Type
        • By Transport Mode
        • By Delivery Model
        • By Pricing Model
        • By End Industry
        • By Deployment
    • North Africa
      • Pricing Analysis
      • Market Share Analysis, 2024
        • By Service Type
        • By Transport Mode
        • By Delivery Model
        • By Pricing Model
        • By End Industry
        • By Deployment
    • South Africa
      • Pricing Analysis
      • Market Share Analysis, 2024
        • By Service Type
        • By Transport Mode
        • By Delivery Model
        • By Pricing Model
        • By End Industry
        • By Deployment
  19. Market Structure Analysis
    • Competition Dashboard
    • Competition Benchmarking
    • Market Share Analysis of Top Players
      • By Regional
      • By Service Type
      • By Transport Mode
      • By Delivery Model
      • By Pricing Model
      • By End Industry
      • By Deployment
  20. Competition Analysis
    • Competition Deep Dive
      • DHL Supply Chain
        • Overview
        • Product Portfolio
        • Profitability by Market Segments (Product/Age /Sales Channel/Region)
        • Sales Footprint
        • Strategy Overview
          • Marketing Strategy
          • Product Strategy
          • Channel Strategy
      • UPS Supply Chain Solutions
        • Overview
        • Product Portfolio
        • Profitability by Market Segments (Product/Age /Sales Channel/Region)
        • Sales Footprint
        • Strategy Overview
          • Marketing Strategy
          • Product Strategy
          • Channel Strategy
      • FedEx Logistics
        • Overview
        • Product Portfolio
        • Profitability by Market Segments (Product/Age /Sales Channel/Region)
        • Sales Footprint
        • Strategy Overview
          • Marketing Strategy
          • Product Strategy
          • Channel Strategy
      • Maersk Logistics & Services
        • Overview
        • Product Portfolio
        • Profitability by Market Segments (Product/Age /Sales Channel/Region)
        • Sales Footprint
        • Strategy Overview
          • Marketing Strategy
          • Product Strategy
          • Channel Strategy
      • Kuehne+Nagel
        • Overview
        • Product Portfolio
        • Profitability by Market Segments (Product/Age /Sales Channel/Region)
        • Sales Footprint
        • Strategy Overview
          • Marketing Strategy
          • Product Strategy
          • Channel Strategy
      • DSV
        • Overview
        • Product Portfolio
        • Profitability by Market Segments (Product/Age /Sales Channel/Region)
        • Sales Footprint
        • Strategy Overview
          • Marketing Strategy
          • Product Strategy
          • Channel Strategy
      • XPO
        • Overview
        • Product Portfolio
        • Profitability by Market Segments (Product/Age /Sales Channel/Region)
        • Sales Footprint
        • Strategy Overview
          • Marketing Strategy
          • Product Strategy
          • Channel Strategy
      • Flexport
        • Overview
        • Product Portfolio
        • Profitability by Market Segments (Product/Age /Sales Channel/Region)
        • Sales Footprint
        • Strategy Overview
          • Marketing Strategy
          • Product Strategy
          • Channel Strategy
      • GXO Logistics
        • Overview
        • Product Portfolio
        • Profitability by Market Segments (Product/Age /Sales Channel/Region)
        • Sales Footprint
        • Strategy Overview
          • Marketing Strategy
          • Product Strategy
          • Channel Strategy
      • ShipBob
        • Overview
        • Product Portfolio
        • Profitability by Market Segments (Product/Age /Sales Channel/Region)
        • Sales Footprint
        • Strategy Overview
          • Marketing Strategy
          • Product Strategy
          • Channel Strategy
      • Others
        • Overview
        • Product Portfolio
        • Profitability by Market Segments (Product/Age /Sales Channel/Region)
        • Sales Footprint
        • Strategy Overview
          • Marketing Strategy
          • Product Strategy
          • Channel Strategy
  21. Assumptions & Acronyms Used
  22. Research Methodology

List of Tables

  • Table 1: Global Value (USD Million) Forecast by Region, 2020-2035
  • Table 2: Global Volume (Units) Forecast by Region, 2020-2035
  • Table 3: Global Value (USD Million) Forecast by Service Type, 2020-2035
  • Table 4: Global Volume (Units) Forecast by Service Type, 2020-2035
  • Table 5: Global Value (USD Million) Forecast by Transport Mode, 2020-2035
  • Table 6: Global Volume (Units) Forecast by Transport Mode, 2020-2035
  • Table 7: Global Value (USD Million) Forecast by Delivery Model, 2020-2035
  • Table 8: Global Volume (Units) Forecast by Delivery Model, 2020-2035
  • Table 9: Global Value (USD Million) Forecast by Pricing Model, 2020-2035
  • Table 10: Global Volume (Units) Forecast by Pricing Model, 2020-2035
  • Table 11: Global Value (USD Million) Forecast by End Industry, 2020-2035
  • Table 12: Global Volume (Units) Forecast by End Industry, 2020-2035
  • Table 13: Global Value (USD Million) Forecast by Deployment, 2020-2035
  • Table 14: Global Volume (Units) Forecast by Deployment, 2020-2035
  • Table 15: North America Value (USD Million) Forecast by Country, 2020-2035
  • Table 16: North America Volume (Units) Forecast by Country, 2020-2035
  • Table 17: North America Value (USD Million) Forecast by Service Type, 2020-2035
  • Table 18: North America Volume (Units) Forecast by Service Type, 2020-2035
  • Table 19: North America Value (USD Million) Forecast by Transport Mode, 2020-2035
  • Table 20: North America Volume (Units) Forecast by Transport Mode, 2020-2035
  • Table 21: North America Value (USD Million) Forecast by Delivery Model, 2020-2035
  • Table 22: North America Volume (Units) Forecast by Delivery Model, 2020-2035
  • Table 23: North America Value (USD Million) Forecast by Pricing Model, 2020-2035
  • Table 24: North America Volume (Units) Forecast by Pricing Model, 2020-2035
  • Table 25: North America Value (USD Million) Forecast by End Industry, 2020-2035
  • Table 26: North America Volume (Units) Forecast by End Industry, 2020-2035
  • Table 27: North America Value (USD Million) Forecast by Deployment, 2020-2035
  • Table 28: North America Volume (Units) Forecast by Deployment, 2020-2035
  • Table 29: Latin America Value (USD Million) Forecast by Country, 2020-2035
  • Table 30: Latin America Volume (Units) Forecast by Country, 2020-2035
  • Table 31: Latin America Value (USD Million) Forecast by Service Type, 2020-2035
  • Table 32: Latin America Volume (Units) Forecast by Service Type, 2020-2035
  • Table 33: Latin America Value (USD Million) Forecast by Transport Mode, 2020-2035
  • Table 34: Latin America Volume (Units) Forecast by Transport Mode, 2020-2035
  • Table 35: Latin America Value (USD Million) Forecast by Delivery Model, 2020-2035
  • Table 36: Latin America Volume (Units) Forecast by Delivery Model, 2020-2035
  • Table 37: Latin America Value (USD Million) Forecast by Pricing Model, 2020-2035
  • Table 38: Latin America Volume (Units) Forecast by Pricing Model, 2020-2035
  • Table 39: Latin America Value (USD Million) Forecast by End Industry, 2020-2035
  • Table 40: Latin America Volume (Units) Forecast by End Industry, 2020-2035
  • Table 41: Latin America Value (USD Million) Forecast by Deployment, 2020-2035
  • Table 42: Latin America Volume (Units) Forecast by Deployment, 2020-2035
  • Table 43: Europe Value (USD Million) Forecast by Country, 2020-2035
  • Table 44: Europe Volume (Units) Forecast by Country, 2020-2035
  • Table 45: Europe Value (USD Million) Forecast by Service Type, 2020-2035
  • Table 46: Europe Volume (Units) Forecast by Service Type, 2020-2035
  • Table 47: Europe Value (USD Million) Forecast by Transport Mode, 2020-2035
  • Table 48: Europe Volume (Units) Forecast by Transport Mode, 2020-2035
  • Table 49: Europe Value (USD Million) Forecast by Delivery Model, 2020-2035
  • Table 50: Europe Volume (Units) Forecast by Delivery Model, 2020-2035
  • Table 51: Europe Value (USD Million) Forecast by Pricing Model, 2020-2035
  • Table 52: Europe Volume (Units) Forecast by Pricing Model, 2020-2035
  • Table 53: Europe Value (USD Million) Forecast by End Industry, 2020-2035
  • Table 54: Europe Volume (Units) Forecast by End Industry, 2020-2035
  • Table 55: Europe Value (USD Million) Forecast by Deployment, 2020-2035
  • Table 56: Europe Volume (Units) Forecast by Deployment, 2020-2035
  • Table 57: East Asia Value (USD Million) Forecast by Country, 2020-2035
  • Table 58: East Asia Volume (Units) Forecast by Country, 2020-2035
  • Table 59: East Asia Value (USD Million) Forecast by Service Type, 2020-2035
  • Table 60: East Asia Volume (Units) Forecast by Service Type, 2020-2035
  • Table 61: East Asia Value (USD Million) Forecast by Transport Mode, 2020-2035
  • Table 62: East Asia Volume (Units) Forecast by Transport Mode, 2020-2035
  • Table 63: East Asia Value (USD Million) Forecast by Delivery Model, 2020-2035
  • Table 64: East Asia Volume (Units) Forecast by Delivery Model, 2020-2035
  • Table 65: East Asia Value (USD Million) Forecast by Pricing Model, 2020-2035
  • Table 66: East Asia Volume (Units) Forecast by Pricing Model, 2020-2035
  • Table 67: East Asia Value (USD Million) Forecast by End Industry, 2020-2035
  • Table 68: East Asia Volume (Units) Forecast by End Industry, 2020-2035
  • Table 69: East Asia Value (USD Million) Forecast by Deployment, 2020-2035
  • Table 70: East Asia Volume (Units) Forecast by Deployment, 2020-2035
  • Table 71: South Asia & Pacific Value (USD Million) Forecast by Country, 2020-2035
  • Table 72: South Asia & Pacific Volume (Units) Forecast by Country, 2020-2035
  • Table 73: South Asia & Pacific Value (USD Million) Forecast by Service Type, 2020-2035
  • Table 74: South Asia & Pacific Volume (Units) Forecast by Service Type, 2020-2035
  • Table 75: South Asia & Pacific Value (USD Million) Forecast by Transport Mode, 2020-2035
  • Table 76: South Asia & Pacific Volume (Units) Forecast by Transport Mode, 2020-2035
  • Table 77: South Asia & Pacific Value (USD Million) Forecast by Delivery Model, 2020-2035
  • Table 78: South Asia & Pacific Volume (Units) Forecast by Delivery Model, 2020-2035
  • Table 79: South Asia & Pacific Value (USD Million) Forecast by Pricing Model, 2020-2035
  • Table 80: South Asia & Pacific Volume (Units) Forecast by Pricing Model, 2020-2035
  • Table 81: South Asia & Pacific Value (USD Million) Forecast by End Industry, 2020-2035
  • Table 82: South Asia & Pacific Volume (Units) Forecast by End Industry, 2020-2035
  • Table 83: South Asia & Pacific Value (USD Million) Forecast by Deployment, 2020-2035
  • Table 84: South Asia & Pacific Volume (Units) Forecast by Deployment, 2020-2035
  • Table 85: Middle East and Africa Value (USD Million) Forecast by Country, 2020-2035
  • Table 86: Middle East and Africa Volume (Units) Forecast by Country, 2020-2035
  • Table 87: Middle East and Africa Value (USD Million) Forecast by Service Type, 2020-2035
  • Table 88: Middle East and Africa Volume (Units) Forecast by Service Type, 2020-2035
  • Table 89: Middle East and Africa Value (USD Million) Forecast by Transport Mode, 2020-2035
  • Table 90: Middle East and Africa Volume (Units) Forecast by Transport Mode, 2020-2035
  • Table 91: Middle East and Africa Value (USD Million) Forecast by Delivery Model, 2020-2035
  • Table 92: Middle East and Africa Volume (Units) Forecast by Delivery Model, 2020-2035
  • Table 93: Middle East and Africa Value (USD Million) Forecast by Pricing Model, 2020-2035
  • Table 94: Middle East and Africa Volume (Units) Forecast by Pricing Model, 2020-2035
  • Table 95: Middle East and Africa Value (USD Million) Forecast by End Industry, 2020-2035
  • Table 96: Middle East and Africa Volume (Units) Forecast by End Industry, 2020-2035
  • Table 97: Middle East and Africa Value (USD Million) Forecast by Deployment, 2020-2035
  • Table 98: Middle East and Africa Volume (Units) Forecast by Deployment, 2020-2035

List of Figures

  • Figure 1: Global Value (USD Million) by Service Type, 2025-2035
  • Figure 2: Global Value (USD Million) by Transport Mode, 2025-2035
  • Figure 3: Global Value (USD Million) by Delivery Model, 2025-2035
  • Figure 4: Global Value (USD Million) by Pricing Model, 2025-2035
  • Figure 5: Global Value (USD Million) by End Industry, 2025-2035
  • Figure 6: Global Value (USD Million) by Deployment, 2025-2035
  • Figure 7: Global Value (USD Million) by Region, 2025-2035
  • Figure 8: Global Value (USD Million) Analysis by Region, 2020-2035
  • Figure 9: Global Volume (Units) Analysis by Region, 2020-2035
  • Figure 10: Global Value Share (%) and BPS Analysis by Region, 2025-2035
  • Figure 11: Global Y-o-Y Growth (%) Projections by Region, 2025-2035
  • Figure 12: Global Value (USD Million) Analysis by Service Type, 2020-2035
  • Figure 13: Global Volume (Units) Analysis by Service Type, 2020-2035
  • Figure 14: Global Value Share (%) and BPS Analysis by Service Type, 2025-2035
  • Figure 15: Global Y-o-Y Growth (%) Projections by Service Type, 2025-2035
  • Figure 16: Global Value (USD Million) Analysis by Transport Mode, 2020-2035
  • Figure 17: Global Volume (Units) Analysis by Transport Mode, 2020-2035
  • Figure 18: Global Value Share (%) and BPS Analysis by Transport Mode, 2025-2035
  • Figure 19: Global Y-o-Y Growth (%) Projections by Transport Mode, 2025-2035
  • Figure 20: Global Value (USD Million) Analysis by Delivery Model, 2020-2035
  • Figure 21: Global Volume (Units) Analysis by Delivery Model, 2020-2035
  • Figure 22: Global Value Share (%) and BPS Analysis by Delivery Model, 2025-2035
  • Figure 23: Global Y-o-Y Growth (%) Projections by Delivery Model, 2025-2035
  • Figure 24: Global Value (USD Million) Analysis by Pricing Model, 2020-2035
  • Figure 25: Global Volume (Units) Analysis by Pricing Model, 2020-2035
  • Figure 26: Global Value Share (%) and BPS Analysis by Pricing Model, 2025-2035
  • Figure 27: Global Y-o-Y Growth (%) Projections by Pricing Model, 2025-2035
  • Figure 28: Global Value (USD Million) Analysis by End Industry, 2020-2035
  • Figure 29: Global Volume (Units) Analysis by End Industry, 2020-2035
  • Figure 30: Global Value Share (%) and BPS Analysis by End Industry, 2025-2035
  • Figure 31: Global Y-o-Y Growth (%) Projections by End Industry, 2025-2035
  • Figure 32: Global Value (USD Million) Analysis by Deployment, 2020-2035
  • Figure 33: Global Volume (Units) Analysis by Deployment, 2020-2035
  • Figure 34: Global Value Share (%) and BPS Analysis by Deployment, 2025-2035
  • Figure 35: Global Y-o-Y Growth (%) Projections by Deployment, 2025-2035
  • Figure 36: Global Attractiveness by Service Type, 2025-2035
  • Figure 37: Global Attractiveness by Transport Mode, 2025-2035
  • Figure 38: Global Attractiveness by Delivery Model, 2025-2035
  • Figure 39: Global Attractiveness by Pricing Model, 2025-2035
  • Figure 40: Global Attractiveness by End Industry, 2025-2035
  • Figure 41: Global Attractiveness by Deployment, 2025-2035
  • Figure 42: Global Attractiveness by Region, 2025-2035
  • Figure 43: North America Value (USD Million) by Service Type, 2025-2035
  • Figure 44: North America Value (USD Million) by Transport Mode, 2025-2035
  • Figure 45: North America Value (USD Million) by Delivery Model, 2025-2035
  • Figure 46: North America Value (USD Million) by Pricing Model, 2025-2035
  • Figure 47: North America Value (USD Million) by End Industry, 2025-2035
  • Figure 48: North America Value (USD Million) by Deployment, 2025-2035
  • Figure 49: North America Value (USD Million) by Country, 2025-2035
  • Figure 50: North America Value (USD Million) Analysis by Country, 2020-2035
  • Figure 51: North America Volume (Units) Analysis by Country, 2020-2035
  • Figure 52: North America Value Share (%) and BPS Analysis by Country, 2025-2035
  • Figure 53: North America Y-o-Y Growth (%) Projections by Country, 2025-2035
  • Figure 54: North America Value (USD Million) Analysis by Service Type, 2020-2035
  • Figure 55: North America Volume (Units) Analysis by Service Type, 2020-2035
  • Figure 56: North America Value Share (%) and BPS Analysis by Service Type, 2025-2035
  • Figure 57: North America Y-o-Y Growth (%) Projections by Service Type, 2025-2035
  • Figure 58: North America Value (USD Million) Analysis by Transport Mode, 2020-2035
  • Figure 59: North America Volume (Units) Analysis by Transport Mode, 2020-2035
  • Figure 60: North America Value Share (%) and BPS Analysis by Transport Mode, 2025-2035
  • Figure 61: North America Y-o-Y Growth (%) Projections by Transport Mode, 2025-2035
  • Figure 62: North America Value (USD Million) Analysis by Delivery Model, 2020-2035
  • Figure 63: North America Volume (Units) Analysis by Delivery Model, 2020-2035
  • Figure 64: North America Value Share (%) and BPS Analysis by Delivery Model, 2025-2035
  • Figure 65: North America Y-o-Y Growth (%) Projections by Delivery Model, 2025-2035
  • Figure 66: North America Value (USD Million) Analysis by Pricing Model, 2020-2035
  • Figure 67: North America Volume (Units) Analysis by Pricing Model, 2020-2035
  • Figure 68: North America Value Share (%) and BPS Analysis by Pricing Model, 2025-2035
  • Figure 69: North America Y-o-Y Growth (%) Projections by Pricing Model, 2025-2035
  • Figure 70: North America Value (USD Million) Analysis by End Industry, 2020-2035
  • Figure 71: North America Volume (Units) Analysis by End Industry, 2020-2035
  • Figure 72: North America Value Share (%) and BPS Analysis by End Industry, 2025-2035
  • Figure 73: North America Y-o-Y Growth (%) Projections by End Industry, 2025-2035
  • Figure 74: North America Value (USD Million) Analysis by Deployment, 2020-2035
  • Figure 75: North America Volume (Units) Analysis by Deployment, 2020-2035
  • Figure 76: North America Value Share (%) and BPS Analysis by Deployment, 2025-2035
  • Figure 77: North America Y-o-Y Growth (%) Projections by Deployment, 2025-2035
  • Figure 78: North America Attractiveness by Service Type, 2025-2035
  • Figure 79: North America Attractiveness by Transport Mode, 2025-2035
  • Figure 80: North America Attractiveness by Delivery Model, 2025-2035
  • Figure 81: North America Attractiveness by Pricing Model, 2025-2035
  • Figure 82: North America Attractiveness by End Industry, 2025-2035
  • Figure 83: North America Attractiveness by Deployment, 2025-2035
  • Figure 84: North America Attractiveness by Country, 2025-2035
  • Figure 85: Latin America Value (USD Million) by Service Type, 2025-2035
  • Figure 86: Latin America Value (USD Million) by Transport Mode, 2025-2035
  • Figure 87: Latin America Value (USD Million) by Delivery Model, 2025-2035
  • Figure 88: Latin America Value (USD Million) by Pricing Model, 2025-2035
  • Figure 89: Latin America Value (USD Million) by End Industry, 2025-2035
  • Figure 90: Latin America Value (USD Million) by Deployment, 2025-2035
  • Figure 91: Latin America Value (USD Million) by Country, 2025-2035
  • Figure 92: Latin America Value (USD Million) Analysis by Country, 2020-2035
  • Figure 93: Latin America Volume (Units) Analysis by Country, 2020-2035
  • Figure 94: Latin America Value Share (%) and BPS Analysis by Country, 2025-2035
  • Figure 95: Latin America Y-o-Y Growth (%) Projections by Country, 2025-2035
  • Figure 96: Latin America Value (USD Million) Analysis by Service Type, 2020-2035
  • Figure 97: Latin America Volume (Units) Analysis by Service Type, 2020-2035
  • Figure 98: Latin America Value Share (%) and BPS Analysis by Service Type, 2025-2035
  • Figure 99: Latin America Y-o-Y Growth (%) Projections by Service Type, 2025-2035
  • Figure 100: Latin America Value (USD Million) Analysis by Transport Mode, 2020-2035
  • Figure 101: Latin America Volume (Units) Analysis by Transport Mode, 2020-2035
  • Figure 102: Latin America Value Share (%) and BPS Analysis by Transport Mode, 2025-2035
  • Figure 103: Latin America Y-o-Y Growth (%) Projections by Transport Mode, 2025-2035
  • Figure 104: Latin America Value (USD Million) Analysis by Delivery Model, 2020-2035
  • Figure 105: Latin America Volume (Units) Analysis by Delivery Model, 2020-2035
  • Figure 106: Latin America Value Share (%) and BPS Analysis by Delivery Model, 2025-2035
  • Figure 107: Latin America Y-o-Y Growth (%) Projections by Delivery Model, 2025-2035
  • Figure 108: Latin America Value (USD Million) Analysis by Pricing Model, 2020-2035
  • Figure 109: Latin America Volume (Units) Analysis by Pricing Model, 2020-2035
  • Figure 110: Latin America Value Share (%) and BPS Analysis by Pricing Model, 2025-2035
  • Figure 111: Latin America Y-o-Y Growth (%) Projections by Pricing Model, 2025-2035
  • Figure 112: Latin America Value (USD Million) Analysis by End Industry, 2020-2035
  • Figure 113: Latin America Volume (Units) Analysis by End Industry, 2020-2035
  • Figure 114: Latin America Value Share (%) and BPS Analysis by End Industry, 2025-2035
  • Figure 115: Latin America Y-o-Y Growth (%) Projections by End Industry, 2025-2035
  • Figure 116: Latin America Value (USD Million) Analysis by Deployment, 2020-2035
  • Figure 117: Latin America Volume (Units) Analysis by Deployment, 2020-2035
  • Figure 118: Latin America Value Share (%) and BPS Analysis by Deployment, 2025-2035
  • Figure 119: Latin America Y-o-Y Growth (%) Projections by Deployment, 2025-2035
  • Figure 120: Latin America Attractiveness by Service Type, 2025-2035
  • Figure 121: Latin America Attractiveness by Transport Mode, 2025-2035
  • Figure 122: Latin America Attractiveness by Delivery Model, 2025-2035
  • Figure 123: Latin America Attractiveness by Pricing Model, 2025-2035
  • Figure 124: Latin America Attractiveness by End Industry, 2025-2035
  • Figure 125: Latin America Attractiveness by Deployment, 2025-2035
  • Figure 126: Latin America Attractiveness by Country, 2025-2035
  • Figure 127: Europe Value (USD Million) by Service Type, 2025-2035
  • Figure 128: Europe Value (USD Million) by Transport Mode, 2025-2035
  • Figure 129: Europe Value (USD Million) by Delivery Model, 2025-2035
  • Figure 130: Europe Value (USD Million) by Pricing Model, 2025-2035
  • Figure 131: Europe Value (USD Million) by End Industry, 2025-2035
  • Figure 132: Europe Value (USD Million) by Deployment, 2025-2035
  • Figure 133: Europe Value (USD Million) by Country, 2025-2035
  • Figure 134: Europe Value (USD Million) Analysis by Country, 2020-2035
  • Figure 135: Europe Volume (Units) Analysis by Country, 2020-2035
  • Figure 136: Europe Value Share (%) and BPS Analysis by Country, 2025-2035
  • Figure 137: Europe Y-o-Y Growth (%) Projections by Country, 2025-2035
  • Figure 138: Europe Value (USD Million) Analysis by Service Type, 2020-2035
  • Figure 139: Europe Volume (Units) Analysis by Service Type, 2020-2035
  • Figure 140: Europe Value Share (%) and BPS Analysis by Service Type, 2025-2035
  • Figure 141: Europe Y-o-Y Growth (%) Projections by Service Type, 2025-2035
  • Figure 142: Europe Value (USD Million) Analysis by Transport Mode, 2020-2035
  • Figure 143: Europe Volume (Units) Analysis by Transport Mode, 2020-2035
  • Figure 144: Europe Value Share (%) and BPS Analysis by Transport Mode, 2025-2035
  • Figure 145: Europe Y-o-Y Growth (%) Projections by Transport Mode, 2025-2035
  • Figure 146: Europe Value (USD Million) Analysis by Delivery Model, 2020-2035
  • Figure 147: Europe Volume (Units) Analysis by Delivery Model, 2020-2035
  • Figure 148: Europe Value Share (%) and BPS Analysis by Delivery Model, 2025-2035
  • Figure 149: Europe Y-o-Y Growth (%) Projections by Delivery Model, 2025-2035
  • Figure 150: Europe Value (USD Million) Analysis by Pricing Model, 2020-2035
  • Figure 151: Europe Volume (Units) Analysis by Pricing Model, 2020-2035
  • Figure 152: Europe Value Share (%) and BPS Analysis by Pricing Model, 2025-2035
  • Figure 153: Europe Y-o-Y Growth (%) Projections by Pricing Model, 2025-2035
  • Figure 154: Europe Value (USD Million) Analysis by End Industry, 2020-2035
  • Figure 155: Europe Volume (Units) Analysis by End Industry, 2020-2035
  • Figure 156: Europe Value Share (%) and BPS Analysis by End Industry, 2025-2035
  • Figure 157: Europe Y-o-Y Growth (%) Projections by End Industry, 2025-2035
  • Figure 158: Europe Value (USD Million) Analysis by Deployment, 2020-2035
  • Figure 159: Europe Volume (Units) Analysis by Deployment, 2020-2035
  • Figure 160: Europe Value Share (%) and BPS Analysis by Deployment, 2025-2035
  • Figure 161: Europe Y-o-Y Growth (%) Projections by Deployment, 2025-2035
  • Figure 162: Europe Attractiveness by Service Type, 2025-2035
  • Figure 163: Europe Attractiveness by Transport Mode, 2025-2035
  • Figure 164: Europe Attractiveness by Delivery Model, 2025-2035
  • Figure 165: Europe Attractiveness by Pricing Model, 2025-2035
  • Figure 166: Europe Attractiveness by End Industry, 2025-2035
  • Figure 167: Europe Attractiveness by Deployment, 2025-2035
  • Figure 168: Europe Attractiveness by Country, 2025-2035
  • Figure 169: East Asia Value (USD Million) by Service Type, 2025-2035
  • Figure 170: East Asia Value (USD Million) by Transport Mode, 2025-2035
  • Figure 171: East Asia Value (USD Million) by Delivery Model, 2025-2035
  • Figure 172: East Asia Value (USD Million) by Pricing Model, 2025-2035
  • Figure 173: East Asia Value (USD Million) by End Industry, 2025-2035
  • Figure 174: East Asia Value (USD Million) by Deployment, 2025-2035
  • Figure 175: East Asia Value (USD Million) by Country, 2025-2035
  • Figure 176: East Asia Value (USD Million) Analysis by Country, 2020-2035
  • Figure 177: East Asia Volume (Units) Analysis by Country, 2020-2035
  • Figure 178: East Asia Value Share (%) and BPS Analysis by Country, 2025-2035
  • Figure 179: East Asia Y-o-Y Growth (%) Projections by Country, 2025-2035
  • Figure 180: East Asia Value (USD Million) Analysis by Service Type, 2020-2035
  • Figure 181: East Asia Volume (Units) Analysis by Service Type, 2020-2035
  • Figure 182: East Asia Value Share (%) and BPS Analysis by Service Type, 2025-2035
  • Figure 183: East Asia Y-o-Y Growth (%) Projections by Service Type, 2025-2035
  • Figure 184: East Asia Value (USD Million) Analysis by Transport Mode, 2020-2035
  • Figure 185: East Asia Volume (Units) Analysis by Transport Mode, 2020-2035
  • Figure 186: East Asia Value Share (%) and BPS Analysis by Transport Mode, 2025-2035
  • Figure 187: East Asia Y-o-Y Growth (%) Projections by Transport Mode, 2025-2035
  • Figure 188: East Asia Value (USD Million) Analysis by Delivery Model, 2020-2035
  • Figure 189: East Asia Volume (Units) Analysis by Delivery Model, 2020-2035
  • Figure 190: East Asia Value Share (%) and BPS Analysis by Delivery Model, 2025-2035
  • Figure 191: East Asia Y-o-Y Growth (%) Projections by Delivery Model, 2025-2035
  • Figure 192: East Asia Value (USD Million) Analysis by Pricing Model, 2020-2035
  • Figure 193: East Asia Volume (Units) Analysis by Pricing Model, 2020-2035
  • Figure 194: East Asia Value Share (%) and BPS Analysis by Pricing Model, 2025-2035
  • Figure 195: East Asia Y-o-Y Growth (%) Projections by Pricing Model, 2025-2035
  • Figure 196: East Asia Value (USD Million) Analysis by End Industry, 2020-2035
  • Figure 197: East Asia Volume (Units) Analysis by End Industry, 2020-2035
  • Figure 198: East Asia Value Share (%) and BPS Analysis by End Industry, 2025-2035
  • Figure 199: East Asia Y-o-Y Growth (%) Projections by End Industry, 2025-2035
  • Figure 200: East Asia Value (USD Million) Analysis by Deployment, 2020-2035
  • Figure 201: East Asia Volume (Units) Analysis by Deployment, 2020-2035
  • Figure 202: East Asia Value Share (%) and BPS Analysis by Deployment, 2025-2035
  • Figure 203: East Asia Y-o-Y Growth (%) Projections by Deployment, 2025-2035
  • Figure 204: East Asia Attractiveness by Service Type, 2025-2035
  • Figure 205: East Asia Attractiveness by Transport Mode, 2025-2035
  • Figure 206: East Asia Attractiveness by Delivery Model, 2025-2035
  • Figure 207: East Asia Attractiveness by Pricing Model, 2025-2035
  • Figure 208: East Asia Attractiveness by End Industry, 2025-2035
  • Figure 209: East Asia Attractiveness by Deployment, 2025-2035
  • Figure 210: East Asia Attractiveness by Country, 2025-2035
  • Figure 211: South Asia & Pacific Value (USD Million) by Service Type, 2025-2035
  • Figure 212: South Asia & Pacific Value (USD Million) by Transport Mode, 2025-2035
  • Figure 213: South Asia & Pacific Value (USD Million) by Delivery Model, 2025-2035
  • Figure 214: South Asia & Pacific Value (USD Million) by Pricing Model, 2025-2035
  • Figure 215: South Asia & Pacific Value (USD Million) by End Industry, 2025-2035
  • Figure 216: South Asia & Pacific Value (USD Million) by Deployment, 2025-2035
  • Figure 217: South Asia & Pacific Value (USD Million) by Country, 2025-2035
  • Figure 218: South Asia & Pacific Value (USD Million) Analysis by Country, 2020-2035
  • Figure 219: South Asia & Pacific Volume (Units) Analysis by Country, 2020-2035
  • Figure 220: South Asia & Pacific Value Share (%) and BPS Analysis by Country, 2025-2035
  • Figure 221: South Asia & Pacific Y-o-Y Growth (%) Projections by Country, 2025-2035
  • Figure 222: South Asia & Pacific Value (USD Million) Analysis by Service Type, 2020-2035
  • Figure 223: South Asia & Pacific Volume (Units) Analysis by Service Type, 2020-2035
  • Figure 224: South Asia & Pacific Value Share (%) and BPS Analysis by Service Type, 2025-2035
  • Figure 225: South Asia & Pacific Y-o-Y Growth (%) Projections by Service Type, 2025-2035
  • Figure 226: South Asia & Pacific Value (USD Million) Analysis by Transport Mode, 2020-2035
  • Figure 227: South Asia & Pacific Volume (Units) Analysis by Transport Mode, 2020-2035
  • Figure 228: South Asia & Pacific Value Share (%) and BPS Analysis by Transport Mode, 2025-2035
  • Figure 229: South Asia & Pacific Y-o-Y Growth (%) Projections by Transport Mode, 2025-2035
  • Figure 230: South Asia & Pacific Value (USD Million) Analysis by Delivery Model, 2020-2035
  • Figure 231: South Asia & Pacific Volume (Units) Analysis by Delivery Model, 2020-2035
  • Figure 232: South Asia & Pacific Value Share (%) and BPS Analysis by Delivery Model, 2025-2035
  • Figure 233: South Asia & Pacific Y-o-Y Growth (%) Projections by Delivery Model, 2025-2035
  • Figure 234: South Asia & Pacific Value (USD Million) Analysis by Pricing Model, 2020-2035
  • Figure 235: South Asia & Pacific Volume (Units) Analysis by Pricing Model, 2020-2035
  • Figure 236: South Asia & Pacific Value Share (%) and BPS Analysis by Pricing Model, 2025-2035
  • Figure 237: South Asia & Pacific Y-o-Y Growth (%) Projections by Pricing Model, 2025-2035
  • Figure 238: South Asia & Pacific Value (USD Million) Analysis by End Industry, 2020-2035
  • Figure 239: South Asia & Pacific Volume (Units) Analysis by End Industry, 2020-2035
  • Figure 240: South Asia & Pacific Value Share (%) and BPS Analysis by End Industry, 2025-2035
  • Figure 241: South Asia & Pacific Y-o-Y Growth (%) Projections by End Industry, 2025-2035
  • Figure 242: South Asia & Pacific Value (USD Million) Analysis by Deployment, 2020-2035
  • Figure 243: South Asia & Pacific Volume (Units) Analysis by Deployment, 2020-2035
  • Figure 244: South Asia & Pacific Value Share (%) and BPS Analysis by Deployment, 2025-2035
  • Figure 245: South Asia & Pacific Y-o-Y Growth (%) Projections by Deployment, 2025-2035
  • Figure 246: South Asia & Pacific Attractiveness by Service Type, 2025-2035
  • Figure 247: South Asia & Pacific Attractiveness by Transport Mode, 2025-2035
  • Figure 248: South Asia & Pacific Attractiveness by Delivery Model, 2025-2035
  • Figure 249: South Asia & Pacific Attractiveness by Pricing Model, 2025-2035
  • Figure 250: South Asia & Pacific Attractiveness by End Industry, 2025-2035
  • Figure 251: South Asia & Pacific Attractiveness by Deployment, 2025-2035
  • Figure 252: South Asia & Pacific Attractiveness by Country, 2025-2035
  • Figure 253: Middle East and Africa Value (USD Million) by Service Type, 2025-2035
  • Figure 254: Middle East and Africa Value (USD Million) by Transport Mode, 2025-2035
  • Figure 255: Middle East and Africa Value (USD Million) by Delivery Model, 2025-2035
  • Figure 256: Middle East and Africa Value (USD Million) by Pricing Model, 2025-2035
  • Figure 257: Middle East and Africa Value (USD Million) by End Industry, 2025-2035
  • Figure 258: Middle East and Africa Value (USD Million) by Deployment, 2025-2035
  • Figure 259: Middle East and Africa Value (USD Million) by Country, 2025-2035
  • Figure 260: Middle East and Africa Value (USD Million) Analysis by Country, 2020-2035
  • Figure 261: Middle East and Africa Volume (Units) Analysis by Country, 2020-2035
  • Figure 262: Middle East and Africa Value Share (%) and BPS Analysis by Country, 2025-2035
  • Figure 263: Middle East and Africa Y-o-Y Growth (%) Projections by Country, 2025-2035
  • Figure 264: Middle East and Africa Value (USD Million) Analysis by Service Type, 2020-2035
  • Figure 265: Middle East and Africa Volume (Units) Analysis by Service Type, 2020-2035
  • Figure 266: Middle East and Africa Value Share (%) and BPS Analysis by Service Type, 2025-2035
  • Figure 267: Middle East and Africa Y-o-Y Growth (%) Projections by Service Type, 2025-2035
  • Figure 268: Middle East and Africa Value (USD Million) Analysis by Transport Mode, 2020-2035
  • Figure 269: Middle East and Africa Volume (Units) Analysis by Transport Mode, 2020-2035
  • Figure 270: Middle East and Africa Value Share (%) and BPS Analysis by Transport Mode, 2025-2035
  • Figure 271: Middle East and Africa Y-o-Y Growth (%) Projections by Transport Mode, 2025-2035
  • Figure 272: Middle East and Africa Value (USD Million) Analysis by Delivery Model, 2020-2035
  • Figure 273: Middle East and Africa Volume (Units) Analysis by Delivery Model, 2020-2035
  • Figure 274: Middle East and Africa Value Share (%) and BPS Analysis by Delivery Model, 2025-2035
  • Figure 275: Middle East and Africa Y-o-Y Growth (%) Projections by Delivery Model, 2025-2035
  • Figure 276: Middle East and Africa Value (USD Million) Analysis by Pricing Model, 2020-2035
  • Figure 277: Middle East and Africa Volume (Units) Analysis by Pricing Model, 2020-2035
  • Figure 278: Middle East and Africa Value Share (%) and BPS Analysis by Pricing Model, 2025-2035
  • Figure 279: Middle East and Africa Y-o-Y Growth (%) Projections by Pricing Model, 2025-2035
  • Figure 280: Middle East and Africa Value (USD Million) Analysis by End Industry, 2020-2035
  • Figure 281: Middle East and Africa Volume (Units) Analysis by End Industry, 2020-2035
  • Figure 282: Middle East and Africa Value Share (%) and BPS Analysis by End Industry, 2025-2035
  • Figure 283: Middle East and Africa Y-o-Y Growth (%) Projections by End Industry, 2025-2035
  • Figure 284: Middle East and Africa Value (USD Million) Analysis by Deployment, 2020-2035
  • Figure 285: Middle East and Africa Volume (Units) Analysis by Deployment, 2020-2035
  • Figure 286: Middle East and Africa Value Share (%) and BPS Analysis by Deployment, 2025-2035
  • Figure 287: Middle East and Africa Y-o-Y Growth (%) Projections by Deployment, 2025-2035
  • Figure 288: Middle East and Africa Attractiveness by Service Type, 2025-2035
  • Figure 289: Middle East and Africa Attractiveness by Transport Mode, 2025-2035
  • Figure 290: Middle East and Africa Attractiveness by Delivery Model, 2025-2035
  • Figure 291: Middle East and Africa Attractiveness by Pricing Model, 2025-2035
  • Figure 292: Middle East and Africa Attractiveness by End Industry, 2025-2035
  • Figure 293: Middle East and Africa Attractiveness by Deployment, 2025-2035
  • Figure 294: Middle East and Africa Attractiveness by Country, 2025-2035

Frequently Asked Questions

How big is the Smart Logistics Market in 2025?

The global Smart Logistics Market is estimated to be valued at USD 94,518.9 million in 2025.

What will be the size of the Smart Logistics Market in 2035?

The market size for Smart Logistics is projected to reach USD 243,839.1 million by 2035.

How much will the Smart Logistics Market grow between 2025 and 2035?

The Smart Logistics Market is expected to grow at a 9.9% CAGR between 2025 and 2035.

What are the key Service types in the Smart Logistics Market?

The key services types are Last-mile optimization & orchestration, Real-time visibility & control towers, Digital freight brokerage & TMS-as-a-service, Warehouse operations-as-a-service (WMS, robotics enablement), Cold-chain monitoring & compliance, Reverse logistics & returns optimization, Customs & trade compliance services.

Which service type segment is expected to contribute a significant share in the Smart Logistics Market in 2025?

In terms of service type, last-mile optimization and orchestration solutions are expected to command the largest share, around 29.4%, in 2025.

Explore Similar Insights

Future Market Insights

Smart Logistics Services Market

Chat With MaRIA

Chat With

MaRIA

Hi There, I am MaRIA, Your Market Research Intelligence Assistant. How may I help you?