Virtual Try-On Platform Market Size and Share Forecast Outlook 2025 to 2035

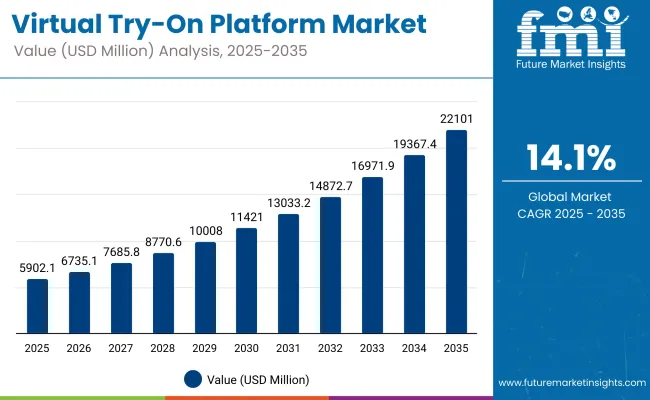
The Global Virtual Try-On Platform Market is projected to grow from USD 5,902.1 million in 2025 to USD 22,101.0 million by 2035, at a CAGR of 14.1%.
Quick Stats for Global Virtual Try-On Platform Market

  • Global Virtual Try-On Market Value (2025): USD 5,902.1 million
  • Global Virtual Try-On Market Forecast Value (2035): USD 22,101.0 million
  • GlobalVirtual Try-On Market Forecast CAGR: 14.1%
  • Leading Segment in GlobalVirtual Try-On Market in 2025: Cloud-Based SaaS (69.3%)
  • Key Growth Regions in the GlobalVirtual Try-On Market: Asia-Pacific (China, India), North America, Europe
  • Top Key Players in GlobalVirtual Try-On Market: Perfect Corp., Vue.ai, 3DLOOK, Banuba Limited, Zugara, Inc., Wannaby Inc. (Wanna), Virtooal, Bold Metrics, Inc., MemoMi Labs Inc., Metail Ltd., Tryon Technology Inc., BodyBlock AI, DeepAR, Styku, Inc., AnthillAR Inc.

Global Virtual Try On Platform Market

Global Virtual Try On Market Key Takeaways

Metric Value
Market Estimated Value in (2025E) USD 5,902.1 million
Market Forecast Value in (2035F) USD 22,101.0 million
Forecast CAGR (2025 to 2035) 14.1%

Cloud-Based SaaS platforms will dominate with a 69.3% market share, while Augmented Reality (AR) will lead the technology segment with a 63.4% share in 2025. GlobalVirtual Try-On Platform Market Size and Share Forecast Outlook 2025 to 2035 The GlobalVirtual Try-On Platform Market is expected to record a valuation of USD 5,902.1 million in 2025 and USD 22,101.0 million in 2035, with an increase of USD 16,198.9 million, which equals a growth of 275% over the decade. The overall expansion represents a CAGR of 14.1% and a nearly 4X increase in market size.

During the first five-year period from 2025 to 2030, the market increases from USD 5,902.1 million to USD 11,421.1 million, adding USD 5,519.0 million, which accounts for 34% of the total decade growth. This phase records steady adoption in apparel, beauty retail, and eyewear try-ons, driven by the need for personalization and return reduction. Augmented Reality platforms dominate this period as they cater to over 60% of mobile and web-based deployments requiring real-time visual overlays.

The second half from 2030 to 2035 contributes USD 10,679.9 million, equal to 66% of total growth, as the market jumps from USD 11,421.1 million to USD 22,101.0 million. This acceleration is powered by widespread deployment of digital avatars, AI-based personalization engines, and social-commerce-integrated virtual try-on systems.

Artificial Intelligence / Machine Learning solutions gain rapid ground, and hybrid deployments (cloud + in-store smart mirrors) capture a larger share above 30% by the end of the decade. Analytics-driven SaaS and API-led subscriptions drive recurring revenue, increasing the software share beyond 40% in total value.

From 2020 to 2024, the Virtual Try-On Market grew from USD 2,800 million to USD 5,000 million, driven by hardware-centric AR adoption. During this period, the competitive landscape was dominated by AR solution providers controlling nearly 70% of revenue, with leaders such as Perfect Corp., ModiFace, and MemoMi focusing on fashion and beauty applications.

Competitive differentiation relied on AR realism, 3D fitting precision, and integration into mobile/e-commerce apps, while AI and analytics were still emerging. Service-based models had limited traction, contributing less than 15% of the total market value.

Demand for Virtual Try-On solutions will expand to USD 5,902.1 million in 2025, and the revenue mix will shift as software, analytics, and platform subscriptions grow to over 40% share. Traditional visualization-first providers face rising competition from digital-first players offering AI-based fit prediction, cloud-enabled avatar try-ons, and mobile-native virtual styling engines.

Major AR vendors are pivoting to hybrid models, integrating personalization AI and workflow automation to stay competitive. New entrants specializing in cloud interoperability, avatar commerce, and industry-specific APIs are gaining traction. The competitive advantage is moving away from AR rendering alone to end-to-end platform ecosystems combining software, data, and continuous engagement.

Why the Global Virtual Try-On Platform Market is growing?

Advancements in augmented reality (AR) and artificial intelligence (AI) have significantly improved the realism and accuracy of virtual try-on experiences, enabling real-time body and face mapping across apparel, eyewear, and cosmetics categories. Cloud-based deployment has accelerated adoption by offering scalable and cost-efficient solutions, particularly for mid-sized retailers and D2C brands. The widespread use of smartphones and high-quality front-facing cameras has made virtual try-on technology accessible to the mass market, further supported by integrations with e-commerce websites and mobile apps.

Growing demand for personalization, return reduction, and enhanced customer engagement in online shopping is fueling the adoption of virtual try-on platforms. Retailers are increasingly deploying AR and AI-enabled platforms to simulate fit, style, and product compatibility. In-store smart mirrors, mobile-based facial scanning, and avatar-based try-ons are becoming standard across apparel chains, optical brands, and beauty retailers. Segment growth is being led by cloud-based SaaS platforms, AR technology in the visualization stack, and AI/ML models for fit prediction and personalization.

Segmental Analysis

The market is segmented by application, technology, platform delivery mode, end user type, and region. Application segments include apparel & fashion, footwear, eyewear, beauty & cosmetics, jewelry & watches, and furniture & home décor reflecting diverse usage across retail domains. Technology segmentation covers augmented reality (AR), artificial intelligence/machine learning (AI/ML), computer vision, 3D modeling/simulation, virtual reality (VR), and mixed/holographic reality each enabling different levels of visualization and personalization.

Platform delivery modes include cloud-based SaaS platforms, on-premise/in-store systems such as AR mirrors, and hybrid deployments combining both for omnichannel operations. End user types include retailers and direct-to-consumer (D2C) brands, e-commerce marketplaces, specialty retail chains (optical, cosmetics, furniture), technology developers (via SDK/API integrations), and omnichannel enterprises leveraging both online and physical touchpoints. Regionally, the scope spans North America, Europe, Asia-Pacific, Latin America, and the Middle East & Africa, with strong growth observed in China, India, the USA, Germany, the UK, and Japan.

Insights into the Application Segment with Apparel & Fashion Leading in Market Share

Application Segment Market Value Share, 2025
Apparel & Fashion 39.6%
Others 60.4%

The Apparel & Fashion segment is projected to contribute 39.6% of the Virtual Try-On Platform Market revenue in 2025, maintaining its lead as the dominant application category. This is driven by the widespread demand for digital fitting rooms, size prediction tools, and AR-based visualization in online fashion retail. Brands are increasingly turning to try-on platforms to enhance customer engagement, reduce return rates, and improve conversion during online purchases.

The segment’s continued growth is fueled by integration with mobile apps, e-commerce platforms, and virtual closets that allow users to preview full outfits. As Gen Z and millennial shoppers demand more immersive and personalized experiences, fashion remains the most responsive sector to virtual try-on innovation. Apparel & Fashion is expected to remain the core driver of market traction, especially across North America, Europe, and emerging Asia-Pacific e-retail ecosystems.
Insights into the Technology Segment with Augmented Reality (AR) Leading in Market Share

Global Virtual Try On Platform Market By Technology

Technology Segment Market Value Share, 2025
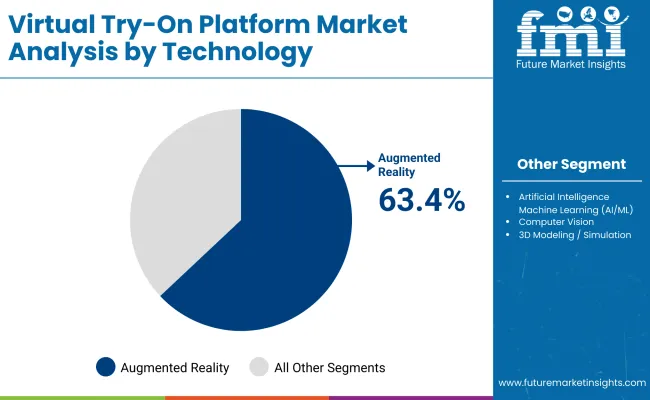
Augmented Reality (AR) 63.4%
Others 36.6%

The Augmented Reality (AR) segment is projected to contribute 63.4% of the Virtual Try-On Platform Market revenue in 2025, firmly leading the technology stack. AR's dominance is driven by its ability to offer real-time, camera-based overlays for face, body, and product try-ons through smartphones and web browsers. The technology has become a staple in beauty, eyewear, and apparel retail experiences.

AR’s growth is supported by improved rendering engines, facial/body tracking precision, and device compatibility. Retailers leverage AR to create frictionless shopping journeys, allowing customers to virtually try products before purchase enhancing satisfaction and brand loyalty. As 5G, AI, and camera hardware continue to evolve, AR is expected to retain its leadership in the virtual try-on experience stack, bridging digital and physical commerce.
Insights into the Platform Delivery Segment with Cloud-Based (SaaS) Leading in Market Share

Global Virtual Try On Platform Market By Platform

Platform Delivery Segment Market Value Share, 2025
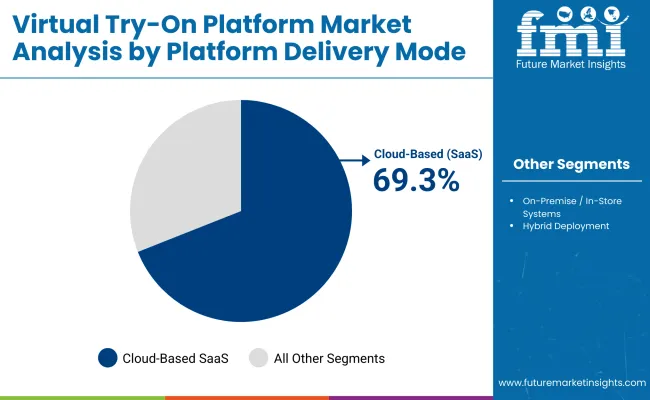
Cloud-Based (SaaS) 69.3%
Others 30.7%

The Cloud-Based (SaaS) segment is projected to contribute 69.3% of the Virtual Try-On Platform Market revenue in 2025, making it the most dominant platform delivery mode. Its rise is attributed to the scalability, affordability, and ease of integration offered to retailers and D2C brands of all sizes. SaaS-based platforms enable faster deployments, remote updates, and flexible pricing models suitable for both enterprise and mid-market users.

As omnichannel and mobile commerce expand globally, SaaS platforms are favored for their compatibility with e-commerce engines, mobile apps, and API ecosystems. Vendors continue to invest in performance, uptime, and security while also embedding analytics and personalization layers. Cloud-based delivery is expected to remain the operational backbone of virtual try-on ecosystems, particularly in fashion, cosmetics, and lifestyle retail sectors.

What are the Drivers, Restraints, and Key Trends of the Global Virtual Try On Market?

Driver

SaaS and API-First Retail Architecture

A major driver of the Virtual Try-On Platform Market is the industry-wide shift toward SaaS and API-first infrastructure. Retailers are rapidly moving away from custom-built AR modules and hardware-heavy setups, instead opting for cloud-native platforms that offer scalable virtual try-on services.

These platforms provide seamless integration via APIs and SDKs, enabling faster deployment across e-commerce websites, mobile apps, and omnichannel systems. This architectural shift allows VTO providers to serve a broader client base, including mid-sized and fast-scaling brands, without high setup costs, while also ensuring version control, real-time updates, and cross-device compatibility.

Mid-Market Brand Adoption in Asia and LATAM

Another powerful driver comes from increased adoption by Tier-2 and Tier-3 brands in emerging markets such as China, India, Brazil, and Indonesia. As VTO platforms become more affordable and user-friendly, mid-sized fashion, beauty, and optical brands are subscribing to off-the-shelf SaaS solutions instead of investing in in-house AR development.

These businesses are attracted by low-cost entry points, localized language support, and smartphone compatibility, which makes advanced try-on experiences accessible to a wider demographic. This growing long-tail demand is significantly expanding the global revenue pool for VTO platform providers.

Restraint

Lack of 3D Asset Standardization

One of the key restraints limiting market scalability is the absence of standardized protocols for 3D asset creation and management. Retailers and brands often provide product visuals in non-uniform forms, which require manual conversion, retopology, or optimization before integration into virtual try-on systems.

This increases implementation time and cost, especially when onboarding large catalogs in apparel, jewelry, or cosmetics. Without universal 3D modeling guidelines or industry-wide asset compatibility frameworks, VTO vendors must maintain large service teams, reducing platform-level automation and affecting onboarding efficiency for new clients.

Device Limitations in Emerging Markets

Despite strong smartphone penetration globally, many mid-tier devices in emerging markets lack the advanced camera systems, processing speeds, or AR framework support (like ARKit/ARCore) needed for high-quality try-on experiences. This creates significant disparities in rendering quality, avatar tracking, and facial/body alignment, particularly on low-end Android devices.

As a result, virtual try-on platforms are often forced to deliver simplified or static try-on experiences to accommodate hardware limitations, which reduces the immersive quality and risks weakening consumer confidence in the feature’s accuracy.

Trend

AI-Based Fit Prediction and Body Avatars

A key trend transforming the virtual try-on ecosystem is the integration of AI-based sizing and fit recommendation systems alongside 3D avatar creation. Rather than simply showing how a product looks, platforms are evolving to simulate how it fitsusing AI to estimate body measurements from photos, recommend SKUs by brand-specific sizing charts, and personalize fit for different body shapes.

This trend is especially strong in fashion and lingerie categories, where incorrect sizing is a primary reason for returns. Fit personalization is emerging as a core value proposition, making VTO platforms not just visual tools but performance drivers for online conversion.

Try-On Integration in Social Commerce and Creator Retail

Another emerging trend is the expansion of virtual try-on capabilities into social commerce platforms like TikTok, Douyin, Instagram, and Snapchat. These platforms are enabling influencers and creators to showcase products using embedded VTO tools directly within livestreams, stories, and shoppable posts.

This creates a new monetization model for virtual try-on providers, who are now servicing creator economies in addition to traditional retail clients. As younger consumers gravitate toward creator-led shopping, this integration of AR try-on into influencer marketing and affiliate commerce is reshaping how virtual try-on platforms are adopted and monetized.
Analysis of Global Virtual Try On Market by Key Countries

Global Virtual Try On Platform Market By Country

Countries CAGR (2025 to 2035)
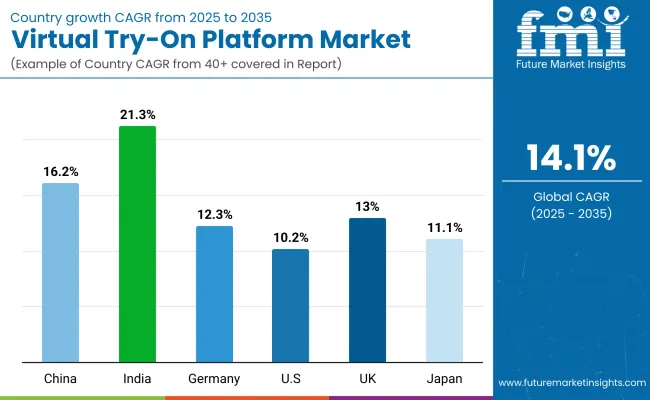
China 16.2%
India 21.3%
Germany 12.3%
USA 10.2%
UK 13.0%
Japan 11.1%

The Global Virtual Try-On Market shows a pronounced regional disparity in adoption speed, strongly influenced by smartphone penetration, AI infrastructure maturity, and the retail sector’s digital transforming efforts. Asia-Pacific emerges as the fastest-growing region, anchored by China at 16.2% CAGR and India at 21.3%. This acceleration is driven by large-scale retail digitization, aggressive e-commerce expansion, and government-backed mandates for AI and AR integration in consumer technology sectors.

China’s regulatory framework promoting AI-based retail transforming in fashion and beauty further accelerates adoption of virtual try-on solutions for real-time product engagement and conversion optimization. India’s trajectory reflects rising integration of AR-based try-on tools by apparel, eyewear, and beauty brands targeting Gen Z and mobile-first users, supporting both domestic demand and export-oriented D2C platforms. Europe maintains a strong growth profile, led by Germany at 12.3% and the UK at 13.0%, supported by stringent online consumer protection standards, omnichannel retail compliance, and sustainability reporting.

High adoption of cloud-native AR platforms and retailer investments in zero-return shopping experiences keep Europe ahead of North America, particularly in virtual try-on for personalization, size optimization, and eco-conscious shopping. North America shows moderate expansion, with the USA at 10.2% CAGR, reflecting maturity in digital commerce and slower mass-market AR adoption relative to Asia-Pacific. Growth in North America is more software and experience-driven, with increasing demand for AI-enhanced avatar personalization, SaaS-based VTO licensing, and integrations with social commerce platforms rather than pure device-based try-on solutions.

Sales Outlook for Virtual Try-On in the United States

Year USA Virtual Try On Market (USD Million)
2025 1670.29
2026 1862.83
2027 2077.56
2028 2317.04
2029 2584.13
2030 2882.00
2031 3214.21
2032 3584.71
2033 3997.92
2034 4458.76
2035 4972.73

The Virtual Try-On Market in the United States is projected to grow at a CAGR of 10.2%, led by sustained investment in beauty and cosmetics try-on platforms. AR-powered beauty tech is the dominant application, with 43.3% of the USA market in 2025, driven by brands adopting virtual makeup trials and skin analysis solutions. The market also benefits from partnerships between SaaS try-on providers and large e-commerce platforms. While the hardware base is mature, most growth is now software and integration-led, especially in personalized avatars and cross-platform sync.

  • Beauty & cosmetics is the top driver, commanding 43.3% of the application share.
  • Virtual try-on providers are bundling AR SaaS with e-commerce plug-ins.
  • Growth is shifting from hardware to personalized software-as-a-service layers.

Growth and Expansion Outlook for Virtual Try-On in the United Kingdom

The Virtual Try-On Market in the United Kingdom is expected to grow at a CAGR of 13.0%, fueled by innovation in omnichannel retail and AR-driven product visualizations. Eyewear and home décor brands are piloting hybrid try-on platforms that integrate in-store smart mirrors with cloud-based recommendation engines. In the apparel sector, UK retailers are using body scan-based fitting solutions to reduce returns and improve sizing accuracy. Consumer electronics retailers are integrating AR overlays to guide product usage and setup.

  • Eyewear and apparel segments are early adopters of virtual sizing and fit tools.
  • Smart mirrors and hybrid try-on systems are trending in UK stores.
  • High smartphone penetration supports strong growth in mobile try-on apps.

Growth and Expansion Outlook for Virtual Try-On in India

India is witnessing the fastest growth in the Virtual Try-On Market, with a forecasted CAGR of 21.3% through 2035. Beauty and fashion brands are rapidly scaling AR try-on features in tier-1 and tier-2 cities, driven by increasing smartphone usage and consumer comfort with digital shopping. Retailers are investing in AI-powered facial mapping and size prediction models to expand reach across regional languages and platforms. India’s booming e-commerce and D2C startup ecosystem is accelerating adoption of plug-and-play SaaS-based try-on solutions.

  • Tier-2 city expansion and vernacular UI support are driving demand.
  • Local beauty and fashion D2C brands are key adopters of try-on integrations.
  • SaaS-based platforms are preferred due to their affordability and scalability.

Sales Outlook for Virtual Try-On in China

Market Share 2025
China 17.1%
India 4.5%
Germany 6.2%
USA 28.3%
UK 5.2%
Japan 7.1%
Market Share 2035
China 20.5%
India 8.8%
Germany 6.5%
USA 22.5%
UK 5.8%
Japan 7.4%

The Virtual Try-On Market in China is expected to grow at a CAGR of 16.2%, supported by government push for retail digitization and dominance of mobile-based commerce. China holds a 17.1% global share in 2025, forecasted to rise to 20.5% by 2035, with AI/ML-based try-on technologies leading at 45.8% market share. Chinese tech firms are embedding virtual try-on into social shopping apps, especially for apparel and footwear. The domestic market also shows strong momentum in integrating try-on with facial recognition for cosmetics and optical categories.
  • AI/ML technology dominates, contributing 45.8% of China’s try-on market.
  • Leading Chinese apps combine social media with VTO shopping features.
  • Government policies on AR innovation and commerce digitization are key enablers.

Competitive Landscape of the Virtual Try-On Market

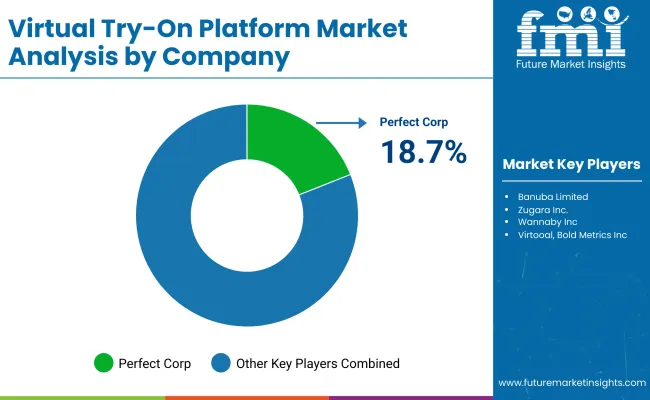
Global Virtual Try On Platform Market By Company

The Virtual Try-On Market is moderately fragmented, with a mix of global SaaS leaders, AR specialists, and niche-focused tech firms competing across apparel, beauty, eyewear, and home décor applications. Global frontrunner Perfect Corp. commands an 18.7% market share in 2025, establishing its dominance through AI-driven beauty tech, virtual makeup trials, and skin diagnostic integrations.

The company’s partnerships with e-commerce and smartphone OEMs have enabled large-scale deployment of cloud-based try-on solutions. Mid-sized innovators such as Vue.ai, 3DLOOK, and Banuba Limited are rapidly scaling through custom-fit solutions for fashion and AI-based avatar generation. Their strength lies in combining deep learning models with scalable SDKs for omnichannel retailers.

These players are also tapping into the growing demand for personalization and body scan accuracy in apparel sizing and fit prediction. Specialized providers like Zugara, Inc., MemoMi Labs Inc., and Virtooal focus on embedded AR experiences for optical retail and in-store augmented mirrors. Their competitive edge lies in seamless integration into existing retail infrastructure and API-based deployments for niche use cases like eyewear visualization and cosmetic color matching.

The competitive landscape is evolving from standalone AR apps toward integrated SaaS ecosystems that offer real-time analytics, AI personalization engines, and hybrid platform flexibility (cloud + in-store). Subscription-based revenue models and cross-platform interoperability are becoming key differentiators as the market moves toward enterprise-scale adoption.

Key Developments in Global Virtual Try On Market

  • On February 3, 2025, Perfect Corp. signed a collaboration with Meta’s Reality Labs to integrate their virtual try-on engine with Meta Quest’s immersive shopping use cases.
  • On March 14, 2024, 3DLOOK unveiled a white-label SDK solution for D2C fashion brands enabling embedded body scanning and virtual styling tools into their mobile apps.

Scope of the Report

Item Value
Quantitative Units USD 5,902.1 million
Application Segments Apparel & Fashion, Footwear, Eyewear, Beauty & Cosmetics, Jewelry & Watches, Furniture & Home Décor
Technology Augmented Reality (AR), Artificial Intelligence / Machine Learning (AI/ML), Computer Vision, 3D Modeling / Simulation, Virtual Reality (VR), Mixed Reality / Holography
Platform Delivery Mode Cloud-Based (SaaS Platforms), O n-Premise / In-Store Systems , Hybrid Deployment (Cloud + In-Store Integration)
Regions Covered North America, Europe, Asia-Pacific, Latin America, Middle East & Africa
Country Covered United States, Canada, Germany, France, United Kingdom, China, Japan, India, Brazil, South Africa
Key Companies Profiled Perfect Corp., Vue.ai, 3DLOOK, Banuba Limited, Zugara Inc., Wannaby Inc. ( Wanna ), Virtooal , Bold Metrics Inc., MemoMi Labs Inc., Metail Ltd., Tryon Technology Inc., BodyBlock AI, DeepAR , Styku Inc., AnthillAR Inc.
Additional Attributes Dollar sales by application and platform type, dominance of AR and SaaS delivery, expansion of D2C and e-commerce VTO solutions, sector-specific innovation in cosmetics and fashion, integration with AI/ML and face/body scanning, China and India as fastest-growing markets, strategic partnerships with retailers and marketplaces, cloud-native SDK/API availability and cross-device deployment trends.

Key Segments

By Application:

  • Apparel & Fashion
  • Footwear
  • Eyewear
  • Beauty & Cosmetics
  • Jewelry & Watches
  • Furniture & Home Décor

By Technology:

  • Augmented Reality (AR)
  • Artificial Intelligence / Machine Learning (AI/ML)
  • Computer Vision
  • 3D Modeling / Simulation
  • Virtual Reality (VR)
  • Mixed Reality / Holography

By Platform Delivery Mode:

  • Cloud-Based (SaaS Platforms)
  • On-Premise / In-Store Systems
  • Hybrid Deployment (Cloud + In-Store Integration)

By End User Type:

  • Retailers & Direct-to-Consumer (D2C) Brands
  • E-commerce Marketplaces
  • Specialty Retail Chains
  • Technology Developers
  • Omnichannel Enterprises

By Region:

  • South Asia & Pacific
  • North America
  • Latin America
  • Europe
  • East Asia
  • Middle East and Africa

Table of Content

  1. Executive Summary
    • Global Market Outlook
    • Demand-side Trends
    • Supply-side Trends
    • Technology Roadmap Analysis
    • Analysis and Recommendations
  2. Market Overview
    • Market Coverage / Taxonomy
    • Market Definition / Scope / Limitations
  3. Market Background
    • Market Dynamics
      • Drivers
      • Restraints
      • Opportunity
      • Trends
    • Scenario Forecast
      • Demand in Optimistic Scenario
      • Demand in Likely Scenario
      • Demand in Conservative Scenario
    • Opportunity Map Analysis
    • Product Life Cycle Analysis
    • Supply Chain Analysis
      • Supply Side Participants and their Roles
        • Producers
        • Mid-Level Participants (Traders/ Agents/ Brokers)
        • Wholesalers and Distributors
      • Value Added and Value Created at Node in the Supply Chain
      • List of Raw Material Suppliers
      • List of Existing and Potential Buyer’s
    • Investment Feasibility Matrix
    • Value Chain Analysis
      • Profit Margin Analysis
      • Wholesalers and Distributors
      • Retailers
    • PESTLE and Porter’s Analysis
    • Regulatory Landscape
      • By Key Regions
      • By Key Countries
    • Regional Parent Market Outlook
    • Production and Consumption Statistics
    • Import and Export Statistics
  4. Global Market Analysis 2020 to 2024 and Forecast, 2025 to 2035
    • Historical Market Size Value (USD Million) & Volume (Units) Analysis, 2020 to 2024
    • Current and Future Market Size Value (USD Million) & Volume (Units) Projections, 2025 to 2035
      • Y-o-Y Growth Trend Analysis
      • Absolute $ Opportunity Analysis
  5. Global Market Analysis 2020 to 2024 and Forecast 2025 to 2035, By Application
    • Introduction / Key Findings
    • Historical Market Size Value (USD Million) & Volume (Units) Analysis By Application, 2020 to 2024
    • Current and Future Market Size Value (USD Million) & Volume (Units) Analysis and Forecast By Application, 2025 to 2035
      • Apparel & Fashion
      • Footwear
      • Eyewear
      • Beauty & Cosmetics
      • Jewelry & Watches
      • Furniture & Home Décor
    • Y-o-Y Growth Trend Analysis By Application, 2020 to 2024
    • Absolute $ Opportunity Analysis By Application, 2025 to 2035
  6. Global Market Analysis 2020 to 2024 and Forecast 2025 to 2035, By Technology
    • Introduction / Key Findings
    • Historical Market Size Value (USD Million) & Volume (Units) Analysis By Technology, 2020 to 2024
    • Current and Future Market Size Value (USD Million) & Volume (Units) Analysis and Forecast By Technology, 2025 to 2035
      • Augmented Reality (AR)
      • Artificial Intelligence / Machine Learning (AI/ML)
      • Computer Vision
      • 3D Modeling / Simulation
      • Virtual Reality (VR)
      • Mixed Reality / Holography
    • Y-o-Y Growth Trend Analysis By Technology, 2020 to 2024
    • Absolute $ Opportunity Analysis By Technology, 2025 to 2035
  7. Global Market Analysis 2020 to 2024 and Forecast 2025 to 2035, By Platform Delivery Mode
    • Introduction / Key Findings
    • Historical Market Size Value (USD Million) & Volume (Units) Analysis By Platform Delivery Mode, 2020 to 2024
    • Current and Future Market Size Value (USD Million) & Volume (Units) Analysis and Forecast By Platform Delivery Mode, 2025 to 2035
      • Cloud-Based (SaaS Platforms)
      • On-Premise / In-Store Systems
      • Hybrid Deployment (Cloud + In-Store Integration)
    • Y-o-Y Growth Trend Analysis By Platform Delivery Mode, 2020 to 2024
    • Absolute $ Opportunity Analysis By Platform Delivery Mode, 2025 to 2035
  8. Global Market Analysis 2020 to 2024 and Forecast 2025 to 2035, By End User Type
    • Introduction / Key Findings
    • Historical Market Size Value (USD Million) & Volume (Units) Analysis By End User Type, 2020 to 2024
    • Current and Future Market Size Value (USD Million) & Volume (Units) Analysis and Forecast By End User Type, 2025 to 2035
      • Retailers & Direct-to-Consumer (D2C) Brands
      • E-commerce Marketplaces
      • Specialty Retail Chains
      • Technology Developers
      • Omnichannel Enterprises
    • Y-o-Y Growth Trend Analysis By End User Type, 2020 to 2024
    • Absolute $ Opportunity Analysis By End User Type, 2025 to 2035
  9. Global Market Analysis 2020 to 2024 and Forecast 2025 to 2035, By Region
    • Introduction
    • Historical Market Size Value (USD Million) & Volume (Units) Analysis By Region, 2020 to 2024
    • Current Market Size Value (USD Million) & Volume (Units) Analysis and Forecast By Region, 2025 to 2035
      • South Asia & Pacific
      • North America
      • Latin America
      • Europe
      • East Asia
      • Middle East and Africa
    • Market Attractiveness Analysis By Region
  10. South Asia & Pacific Market Analysis 2020 to 2024 and Forecast 2025 to 2035, By Country
    • Historical Market Size Value (USD Million) & Volume (Units) Trend Analysis By Market Taxonomy, 2020 to 2024
    • Market Size Value (USD Million) & Volume (Units) Forecast By Market Taxonomy, 2025 to 2035
      • By Country
        • India
        • Thailand
        • Malaysia
        • Indonesia
        • Singapore
        • Vietnam
        • Australia
        • New Zealand
        • Rest of South Asia
      • By Application
      • By Technology
      • By Platform Delivery Mode
      • By End User Type
    • Market Attractiveness Analysis
      • By Country
      • By Application
      • By Technology
      • By Platform Delivery Mode
      • By End User Type
    • Key Takeaways
  11. North America Market Analysis 2020 to 2024 and Forecast 2025 to 2035, By Country
    • Historical Market Size Value (USD Million) & Volume (Units) Trend Analysis By Market Taxonomy, 2020 to 2024
    • Market Size Value (USD Million) & Volume (Units) Forecast By Market Taxonomy, 2025 to 2035
      • By Country
        • USA
        • Canada
      • By Application
      • By Technology
      • By Platform Delivery Mode
      • By End User Type
    • Market Attractiveness Analysis
      • By Country
      • By Application
      • By Technology
      • By Platform Delivery Mode
      • By End User Type
    • Key Takeaways
  12. Latin America Market Analysis 2020 to 2024 and Forecast 2025 to 2035, By Country
    • Historical Market Size Value (USD Million) & Volume (Units) Trend Analysis By Market Taxonomy, 2020 to 2024
    • Market Size Value (USD Million) & Volume (Units) Forecast By Market Taxonomy, 2025 to 2035
      • By Country
        • Brazil
        • Mexico
        • Colombia
        • Rest of Latin America
      • By Application
      • By Technology
      • By Platform Delivery Mode
      • By End User Type
    • Market Attractiveness Analysis
      • By Country
      • By Application
      • By Technology
      • By Platform Delivery Mode
      • By End User Type
    • Key Takeaways
  13. Europe Market Analysis 2020 to 2024 and Forecast 2025 to 2035, By Country
    • Historical Market Size Value (USD Million) & Volume (Units) Trend Analysis By Market Taxonomy, 2020 to 2024
    • Market Size Value (USD Million) & Volume (Units) Forecast By Market Taxonomy, 2025 to 2035
      • By Country
        • Germany
        • UK
        • France
        • Italy
        • Spain
        • Belgium
        • Netherlands
        • Nordic
        • Switzerland
        • Russia
        • Poland
        • Rest of Europe
      • By Application
      • By Technology
      • By Platform Delivery Mode
      • By End User Type
    • Market Attractiveness Analysis
      • By Country
      • By Application
      • By Technology
      • By Platform Delivery Mode
      • By End User Type
    • Key Takeaways
  14. East Asia Market Analysis 2020 to 2024 and Forecast 2025 to 2035, By Country
    • Historical Market Size Value (USD Million) & Volume (Units) Trend Analysis By Market Taxonomy, 2020 to 2024
    • Market Size Value (USD Million) & Volume (Units) Forecast By Market Taxonomy, 2025 to 2035
      • By Country
        • China
        • Japan
        • South Korea
      • By Application
      • By Technology
      • By Platform Delivery Mode
      • By End User Type
    • Market Attractiveness Analysis
      • By Country
      • By Application
      • By Technology
      • By Platform Delivery Mode
      • By End User Type
    • Key Takeaways
  15. Middle East and Africa Market Analysis 2020 to 2024 and Forecast 2025 to 2035, By Country
    • Historical Market Size Value (USD Million) & Volume (Units) Trend Analysis By Market Taxonomy, 2020 to 2024
    • Market Size Value (USD Million) & Volume (Units) Forecast By Market Taxonomy, 2025 to 2035
      • By Country
        • Turkey
        • UAE
        • Saudi Arabia
        • Israel
        • Other GCC Countries
        • North Africa
        • South Africa
      • By Application
      • By Technology
      • By Platform Delivery Mode
      • By End User Type
    • Market Attractiveness Analysis
      • By Country
      • By Application
      • By Technology
      • By Platform Delivery Mode
      • By End User Type
    • Key Takeaways
  16. Key Countries Market Analysis
    • USA
      • Pricing Analysis
      • Market Share Analysis, 2024
        • By Application
        • By Technology
        • By Platform Delivery Mode
        • By End User Type
    • Canada
      • Pricing Analysis
      • Market Share Analysis, 2024
        • By Application
        • By Technology
        • By Platform Delivery Mode
        • By End User Type
    • Brazil
      • Pricing Analysis
      • Market Share Analysis, 2024
        • By Application
        • By Technology
        • By Platform Delivery Mode
        • By End User Type
    • Mexico
      • Pricing Analysis
      • Market Share Analysis, 2024
        • By Application
        • By Technology
        • By Platform Delivery Mode
        • By End User Type
    • Colombia
      • Pricing Analysis
      • Market Share Analysis, 2024
        • By Application
        • By Technology
        • By Platform Delivery Mode
        • By End User Type
    • Rest of Latin America
      • Pricing Analysis
      • Market Share Analysis, 2024
        • By Application
        • By Technology
        • By Platform Delivery Mode
        • By End User Type
    • Germany
      • Pricing Analysis
      • Market Share Analysis, 2024
        • By Application
        • By Technology
        • By Platform Delivery Mode
        • By End User Type
    • UK
      • Pricing Analysis
      • Market Share Analysis, 2024
        • By Application
        • By Technology
        • By Platform Delivery Mode
        • By End User Type
    • France
      • Pricing Analysis
      • Market Share Analysis, 2024
        • By Application
        • By Technology
        • By Platform Delivery Mode
        • By End User Type
    • Italy
      • Pricing Analysis
      • Market Share Analysis, 2024
        • By Application
        • By Technology
        • By Platform Delivery Mode
        • By End User Type
    • Spain
      • Pricing Analysis
      • Market Share Analysis, 2024
        • By Application
        • By Technology
        • By Platform Delivery Mode
        • By End User Type
    • Belgium
      • Pricing Analysis
      • Market Share Analysis, 2024
        • By Application
        • By Technology
        • By Platform Delivery Mode
        • By End User Type
    • Netherlands
      • Pricing Analysis
      • Market Share Analysis, 2024
        • By Application
        • By Technology
        • By Platform Delivery Mode
        • By End User Type
    • Nordic
      • Pricing Analysis
      • Market Share Analysis, 2024
        • By Application
        • By Technology
        • By Platform Delivery Mode
        • By End User Type
    • Switzerland
      • Pricing Analysis
      • Market Share Analysis, 2024
        • By Application
        • By Technology
        • By Platform Delivery Mode
        • By End User Type
    • Russia
      • Pricing Analysis
      • Market Share Analysis, 2024
        • By Application
        • By Technology
        • By Platform Delivery Mode
        • By End User Type
    • Poland
      • Pricing Analysis
      • Market Share Analysis, 2024
        • By Application
        • By Technology
        • By Platform Delivery Mode
        • By End User Type
    • Rest of Europe
      • Pricing Analysis
      • Market Share Analysis, 2024
        • By Application
        • By Technology
        • By Platform Delivery Mode
        • By End User Type
    • China
      • Pricing Analysis
      • Market Share Analysis, 2024
        • By Application
        • By Technology
        • By Platform Delivery Mode
        • By End User Type
    • Japan
      • Pricing Analysis
      • Market Share Analysis, 2024
        • By Application
        • By Technology
        • By Platform Delivery Mode
        • By End User Type
    • South Korea
      • Pricing Analysis
      • Market Share Analysis, 2024
        • By Application
        • By Technology
        • By Platform Delivery Mode
        • By End User Type
    • India
      • Pricing Analysis
      • Market Share Analysis, 2024
        • By Application
        • By Technology
        • By Platform Delivery Mode
        • By End User Type
    • Thailand
      • Pricing Analysis
      • Market Share Analysis, 2024
        • By Application
        • By Technology
        • By Platform Delivery Mode
        • By End User Type
    • Malaysia
      • Pricing Analysis
      • Market Share Analysis, 2024
        • By Application
        • By Technology
        • By Platform Delivery Mode
        • By End User Type
    • Indonesia
      • Pricing Analysis
      • Market Share Analysis, 2024
        • By Application
        • By Technology
        • By Platform Delivery Mode
        • By End User Type
    • Singapore
      • Pricing Analysis
      • Market Share Analysis, 2024
        • By Application
        • By Technology
        • By Platform Delivery Mode
        • By End User Type
    • Vietnam
      • Pricing Analysis
      • Market Share Analysis, 2024
        • By Application
        • By Technology
        • By Platform Delivery Mode
        • By End User Type
    • Australia
      • Pricing Analysis
      • Market Share Analysis, 2024
        • By Application
        • By Technology
        • By Platform Delivery Mode
        • By End User Type
    • New Zealand
      • Pricing Analysis
      • Market Share Analysis, 2024
        • By Application
        • By Technology
        • By Platform Delivery Mode
        • By End User Type
    • Rest of South Asia
      • Pricing Analysis
      • Market Share Analysis, 2024
        • By Application
        • By Technology
        • By Platform Delivery Mode
        • By End User Type
  17. Market Structure Analysis
    • Competition Dashboard
    • Competition Benchmarking
    • Market Share Analysis of Top Players
      • By Regional
      • By Application
      • By Technology
      • By Platform Delivery Mode
      • By End User Type
  18. Competition Analysis
    • Competition Deep Dive
      • Perfect Corp.
        • Overview
        • Product Portfolio
        • Profitability by Market Segments (Product/Age /Sales Channel/Region)
        • Sales Footprint
        • Strategy Overview
          • Marketing Strategy
          • Product Strategy
          • Channel Strategy
      • Vue.ai
        • Overview
        • Product Portfolio
        • Profitability by Market Segments (Product/Age /Sales Channel/Region)
        • Sales Footprint
        • Strategy Overview
          • Marketing Strategy
          • Product Strategy
          • Channel Strategy
      • 3DLOOK
        • Overview
        • Product Portfolio
        • Profitability by Market Segments (Product/Age /Sales Channel/Region)
        • Sales Footprint
        • Strategy Overview
          • Marketing Strategy
          • Product Strategy
          • Channel Strategy
      • Banuba Limited
        • Overview
        • Product Portfolio
        • Profitability by Market Segments (Product/Age /Sales Channel/Region)
        • Sales Footprint
        • Strategy Overview
          • Marketing Strategy
          • Product Strategy
          • Channel Strategy
      • Zugara, Inc.
        • Overview
        • Product Portfolio
        • Profitability by Market Segments (Product/Age /Sales Channel/Region)
        • Sales Footprint
        • Strategy Overview
          • Marketing Strategy
          • Product Strategy
          • Channel Strategy
      • Wannaby Inc. (also known as Wanna)
        • Overview
        • Product Portfolio
        • Profitability by Market Segments (Product/Age /Sales Channel/Region)
        • Sales Footprint
        • Strategy Overview
          • Marketing Strategy
          • Product Strategy
          • Channel Strategy
      • Virtooal
        • Overview
        • Product Portfolio
        • Profitability by Market Segments (Product/Age /Sales Channel/Region)
        • Sales Footprint
        • Strategy Overview
          • Marketing Strategy
          • Product Strategy
          • Channel Strategy
      • Bold Metrics, Inc.
        • Overview
        • Product Portfolio
        • Profitability by Market Segments (Product/Age /Sales Channel/Region)
        • Sales Footprint
        • Strategy Overview
          • Marketing Strategy
          • Product Strategy
          • Channel Strategy
      • MemoMi Labs Inc.
        • Overview
        • Product Portfolio
        • Profitability by Market Segments (Product/Age /Sales Channel/Region)
        • Sales Footprint
        • Strategy Overview
          • Marketing Strategy
          • Product Strategy
          • Channel Strategy
      • Metail Ltd.
        • Overview
        • Product Portfolio
        • Profitability by Market Segments (Product/Age /Sales Channel/Region)
        • Sales Footprint
        • Strategy Overview
          • Marketing Strategy
          • Product Strategy
          • Channel Strategy
      • Tryon Technology Inc.
        • Overview
        • Product Portfolio
        • Profitability by Market Segments (Product/Age /Sales Channel/Region)
        • Sales Footprint
        • Strategy Overview
          • Marketing Strategy
          • Product Strategy
          • Channel Strategy
      • BodyBlock AI
        • Overview
        • Product Portfolio
        • Profitability by Market Segments (Product/Age /Sales Channel/Region)
        • Sales Footprint
        • Strategy Overview
          • Marketing Strategy
          • Product Strategy
          • Channel Strategy
      • DeepAR
        • Overview
        • Product Portfolio
        • Profitability by Market Segments (Product/Age /Sales Channel/Region)
        • Sales Footprint
        • Strategy Overview
          • Marketing Strategy
          • Product Strategy
          • Channel Strategy
      • Styku, Inc.
        • Overview
        • Product Portfolio
        • Profitability by Market Segments (Product/Age /Sales Channel/Region)
        • Sales Footprint
        • Strategy Overview
          • Marketing Strategy
          • Product Strategy
          • Channel Strategy
      • AnthillAR Inc.
        • Overview
        • Product Portfolio
        • Profitability by Market Segments (Product/Age /Sales Channel/Region)
        • Sales Footprint
        • Strategy Overview
          • Marketing Strategy
          • Product Strategy
          • Channel Strategy
  19. Assumptions & Acronyms Used
  20. Research Methodology

List of Tables

  • Table 1: Global Market Value (USD Million) Forecast by Region, 2020-2035
  • Table 2: Global Market Volume (Units) Forecast by Region, 2020-2035
  • Table 3: Global Market Value (USD Million) Forecast by Application, 2020-2035
  • Table 4: Global Market Volume (Units) Forecast by Application, 2020-2035
  • Table 5: Global Market Value (USD Million) Forecast by Technology, 2020-2035
  • Table 6: Global Market Volume (Units) Forecast by Technology, 2020-2035
  • Table 7: Global Market Value (USD Million) Forecast by Platform Delivery Mode, 2020-2035
  • Table 8: Global Market Volume (Units) Forecast by Platform Delivery Mode, 2020-2035
  • Table 9: Global Market Value (USD Million) Forecast by End User Type, 2020-2035
  • Table 10: Global Market Volume (Units) Forecast by End User Type, 2020-2035
  • Table 11: South Asia & Pacific Market Value (USD Million) Forecast by Country, 2020-2035
  • Table 12: South Asia & Pacific Market Volume (Units) Forecast by Country, 2020-2035
  • Table 13: South Asia & Pacific Market Value (USD Million) Forecast by Application, 2020-2035
  • Table 14: South Asia & Pacific Market Volume (Units) Forecast by Application, 2020-2035
  • Table 15: South Asia & Pacific Market Value (USD Million) Forecast by Technology, 2020-2035
  • Table 16: South Asia & Pacific Market Volume (Units) Forecast by Technology, 2020-2035
  • Table 17: South Asia & Pacific Market Value (USD Million) Forecast by Platform Delivery Mode, 2020-2035
  • Table 18: South Asia & Pacific Market Volume (Units) Forecast by Platform Delivery Mode, 2020-2035
  • Table 19: South Asia & Pacific Market Value (USD Million) Forecast by End User Type, 2020-2035
  • Table 20: South Asia & Pacific Market Volume (Units) Forecast by End User Type, 2020-2035
  • Table 21: North America Market Value (USD Million) Forecast by Country, 2020-2035
  • Table 22: North America Market Volume (Units) Forecast by Country, 2020-2035
  • Table 23: North America Market Value (USD Million) Forecast by Application, 2020-2035
  • Table 24: North America Market Volume (Units) Forecast by Application, 2020-2035
  • Table 25: North America Market Value (USD Million) Forecast by Technology, 2020-2035
  • Table 26: North America Market Volume (Units) Forecast by Technology, 2020-2035
  • Table 27: North America Market Value (USD Million) Forecast by Platform Delivery Mode, 2020-2035
  • Table 28: North America Market Volume (Units) Forecast by Platform Delivery Mode, 2020-2035
  • Table 29: North America Market Value (USD Million) Forecast by End User Type, 2020-2035
  • Table 30: North America Market Volume (Units) Forecast by End User Type, 2020-2035
  • Table 31: Latin America Market Value (USD Million) Forecast by Country, 2020-2035
  • Table 32: Latin America Market Volume (Units) Forecast by Country, 2020-2035
  • Table 33: Latin America Market Value (USD Million) Forecast by Application, 2020-2035
  • Table 34: Latin America Market Volume (Units) Forecast by Application, 2020-2035
  • Table 35: Latin America Market Value (USD Million) Forecast by Technology, 2020-2035
  • Table 36: Latin America Market Volume (Units) Forecast by Technology, 2020-2035
  • Table 37: Latin America Market Value (USD Million) Forecast by Platform Delivery Mode, 2020-2035
  • Table 38: Latin America Market Volume (Units) Forecast by Platform Delivery Mode, 2020-2035
  • Table 39: Latin America Market Value (USD Million) Forecast by End User Type, 2020-2035
  • Table 40: Latin America Market Volume (Units) Forecast by End User Type, 2020-2035
  • Table 41: Europe Market Value (USD Million) Forecast by Country, 2020-2035
  • Table 42: Europe Market Volume (Units) Forecast by Country, 2020-2035
  • Table 43: Europe Market Value (USD Million) Forecast by Application, 2020-2035
  • Table 44: Europe Market Volume (Units) Forecast by Application, 2020-2035
  • Table 45: Europe Market Value (USD Million) Forecast by Technology, 2020-2035
  • Table 46: Europe Market Volume (Units) Forecast by Technology, 2020-2035
  • Table 47: Europe Market Value (USD Million) Forecast by Platform Delivery Mode, 2020-2035
  • Table 48: Europe Market Volume (Units) Forecast by Platform Delivery Mode, 2020-2035
  • Table 49: Europe Market Value (USD Million) Forecast by End User Type, 2020-2035
  • Table 50: Europe Market Volume (Units) Forecast by End User Type, 2020-2035
  • Table 51: East Asia Market Value (USD Million) Forecast by Country, 2020-2035
  • Table 52: East Asia Market Volume (Units) Forecast by Country, 2020-2035
  • Table 53: East Asia Market Value (USD Million) Forecast by Application, 2020-2035
  • Table 54: East Asia Market Volume (Units) Forecast by Application, 2020-2035
  • Table 55: East Asia Market Value (USD Million) Forecast by Technology, 2020-2035
  • Table 56: East Asia Market Volume (Units) Forecast by Technology, 2020-2035
  • Table 57: East Asia Market Value (USD Million) Forecast by Platform Delivery Mode, 2020-2035
  • Table 58: East Asia Market Volume (Units) Forecast by Platform Delivery Mode, 2020-2035
  • Table 59: East Asia Market Value (USD Million) Forecast by End User Type, 2020-2035
  • Table 60: East Asia Market Volume (Units) Forecast by End User Type, 2020-2035
  • Table 61: Middle East and Africa Market Value (USD Million) Forecast by Country, 2020-2035
  • Table 62: Middle East and Africa Market Volume (Units) Forecast by Country, 2020-2035
  • Table 63: Middle East and Africa Market Value (USD Million) Forecast by Application, 2020-2035
  • Table 64: Middle East and Africa Market Volume (Units) Forecast by Application, 2020-2035
  • Table 65: Middle East and Africa Market Value (USD Million) Forecast by Technology, 2020-2035
  • Table 66: Middle East and Africa Market Volume (Units) Forecast by Technology, 2020-2035
  • Table 67: Middle East and Africa Market Value (USD Million) Forecast by Platform Delivery Mode, 2020-2035
  • Table 68: Middle East and Africa Market Volume (Units) Forecast by Platform Delivery Mode, 2020-2035
  • Table 69: Middle East and Africa Market Value (USD Million) Forecast by End User Type, 2020-2035
  • Table 70: Middle East and Africa Market Volume (Units) Forecast by End User Type, 2020-2035

List of Figures

  • Figure 1: Global Market Value (USD Million) by Application, 2025-2035
  • Figure 2: Global Market Value (USD Million) by Technology, 2025-2035
  • Figure 3: Global Market Value (USD Million) by Platform Delivery Mode, 2025-2035
  • Figure 4: Global Market Value (USD Million) by End User Type, 2025-2035
  • Figure 5: Global Market Value (USD Million) by Region, 2025-2035
  • Figure 6: Global Market Value (USD Million) Analysis by Region, 2020-2035
  • Figure 7: Global Market Volume (Units) Analysis by Region, 2020-2035
  • Figure 8: Global Market Value Share (%) and BPS Analysis by Region, 2025-2035
  • Figure 9: Global Market Y-o-Y Growth (%) Projections by Region, 2025-2035
  • Figure 10: Global Market Value (USD Million) Analysis by Application, 2020-2035
  • Figure 11: Global Market Volume (Units) Analysis by Application, 2020-2035
  • Figure 12: Global Market Value Share (%) and BPS Analysis by Application, 2025-2035
  • Figure 13: Global Market Y-o-Y Growth (%) Projections by Application, 2025-2035
  • Figure 14: Global Market Value (USD Million) Analysis by Technology, 2020-2035
  • Figure 15: Global Market Volume (Units) Analysis by Technology, 2020-2035
  • Figure 16: Global Market Value Share (%) and BPS Analysis by Technology, 2025-2035
  • Figure 17: Global Market Y-o-Y Growth (%) Projections by Technology, 2025-2035
  • Figure 18: Global Market Value (USD Million) Analysis by Platform Delivery Mode, 2020-2035
  • Figure 19: Global Market Volume (Units) Analysis by Platform Delivery Mode, 2020-2035
  • Figure 20: Global Market Value Share (%) and BPS Analysis by Platform Delivery Mode, 2025-2035
  • Figure 21: Global Market Y-o-Y Growth (%) Projections by Platform Delivery Mode, 2025-2035
  • Figure 22: Global Market Value (USD Million) Analysis by End User Type, 2020-2035
  • Figure 23: Global Market Volume (Units) Analysis by End User Type, 2020-2035
  • Figure 24: Global Market Value Share (%) and BPS Analysis by End User Type, 2025-2035
  • Figure 25: Global Market Y-o-Y Growth (%) Projections by End User Type, 2025-2035
  • Figure 26: Global Market Attractiveness by Application, 2025-2035
  • Figure 27: Global Market Attractiveness by Technology, 2025-2035
  • Figure 28: Global Market Attractiveness by Platform Delivery Mode, 2025-2035
  • Figure 29: Global Market Attractiveness by End User Type, 2025-2035
  • Figure 30: Global Market Attractiveness by Region, 2025-2035
  • Figure 31: South Asia & Pacific Market Value (USD Million) by Application, 2025-2035
  • Figure 32: South Asia & Pacific Market Value (USD Million) by Technology, 2025-2035
  • Figure 33: South Asia & Pacific Market Value (USD Million) by Platform Delivery Mode, 2025-2035
  • Figure 34: South Asia & Pacific Market Value (USD Million) by End User Type, 2025-2035
  • Figure 35: South Asia & Pacific Market Value (USD Million) by Country, 2025-2035
  • Figure 36: South Asia & Pacific Market Value (USD Million) Analysis by Country, 2020-2035
  • Figure 37: South Asia & Pacific Market Volume (Units) Analysis by Country, 2020-2035
  • Figure 38: South Asia & Pacific Market Value Share (%) and BPS Analysis by Country, 2025-2035
  • Figure 39: South Asia & Pacific Market Y-o-Y Growth (%) Projections by Country, 2025-2035
  • Figure 40: South Asia & Pacific Market Value (USD Million) Analysis by Application, 2020-2035
  • Figure 41: South Asia & Pacific Market Volume (Units) Analysis by Application, 2020-2035
  • Figure 42: South Asia & Pacific Market Value Share (%) and BPS Analysis by Application, 2025-2035
  • Figure 43: South Asia & Pacific Market Y-o-Y Growth (%) Projections by Application, 2025-2035
  • Figure 44: South Asia & Pacific Market Value (USD Million) Analysis by Technology, 2020-2035
  • Figure 45: South Asia & Pacific Market Volume (Units) Analysis by Technology, 2020-2035
  • Figure 46: South Asia & Pacific Market Value Share (%) and BPS Analysis by Technology, 2025-2035
  • Figure 47: South Asia & Pacific Market Y-o-Y Growth (%) Projections by Technology, 2025-2035
  • Figure 48: South Asia & Pacific Market Value (USD Million) Analysis by Platform Delivery Mode, 2020-2035
  • Figure 49: South Asia & Pacific Market Volume (Units) Analysis by Platform Delivery Mode, 2020-2035
  • Figure 50: South Asia & Pacific Market Value Share (%) and BPS Analysis by Platform Delivery Mode, 2025-2035
  • Figure 51: South Asia & Pacific Market Y-o-Y Growth (%) Projections by Platform Delivery Mode, 2025-2035
  • Figure 52: South Asia & Pacific Market Value (USD Million) Analysis by End User Type, 2020-2035
  • Figure 53: South Asia & Pacific Market Volume (Units) Analysis by End User Type, 2020-2035
  • Figure 54: South Asia & Pacific Market Value Share (%) and BPS Analysis by End User Type, 2025-2035
  • Figure 55: South Asia & Pacific Market Y-o-Y Growth (%) Projections by End User Type, 2025-2035
  • Figure 56: South Asia & Pacific Market Attractiveness by Application, 2025-2035
  • Figure 57: South Asia & Pacific Market Attractiveness by Technology, 2025-2035
  • Figure 58: South Asia & Pacific Market Attractiveness by Platform Delivery Mode, 2025-2035
  • Figure 59: South Asia & Pacific Market Attractiveness by End User Type, 2025-2035
  • Figure 60: South Asia & Pacific Market Attractiveness by Country, 2025-2035
  • Figure 61: North America Market Value (USD Million) by Application, 2025-2035
  • Figure 62: North America Market Value (USD Million) by Technology, 2025-2035
  • Figure 63: North America Market Value (USD Million) by Platform Delivery Mode, 2025-2035
  • Figure 64: North America Market Value (USD Million) by End User Type, 2025-2035
  • Figure 65: North America Market Value (USD Million) by Country, 2025-2035
  • Figure 66: North America Market Value (USD Million) Analysis by Country, 2020-2035
  • Figure 67: North America Market Volume (Units) Analysis by Country, 2020-2035
  • Figure 68: North America Market Value Share (%) and BPS Analysis by Country, 2025-2035
  • Figure 69: North America Market Y-o-Y Growth (%) Projections by Country, 2025-2035
  • Figure 70: North America Market Value (USD Million) Analysis by Application, 2020-2035
  • Figure 71: North America Market Volume (Units) Analysis by Application, 2020-2035
  • Figure 72: North America Market Value Share (%) and BPS Analysis by Application, 2025-2035
  • Figure 73: North America Market Y-o-Y Growth (%) Projections by Application, 2025-2035
  • Figure 74: North America Market Value (USD Million) Analysis by Technology, 2020-2035
  • Figure 75: North America Market Volume (Units) Analysis by Technology, 2020-2035
  • Figure 76: North America Market Value Share (%) and BPS Analysis by Technology, 2025-2035
  • Figure 77: North America Market Y-o-Y Growth (%) Projections by Technology, 2025-2035
  • Figure 78: North America Market Value (USD Million) Analysis by Platform Delivery Mode, 2020-2035
  • Figure 79: North America Market Volume (Units) Analysis by Platform Delivery Mode, 2020-2035
  • Figure 80: North America Market Value Share (%) and BPS Analysis by Platform Delivery Mode, 2025-2035
  • Figure 81: North America Market Y-o-Y Growth (%) Projections by Platform Delivery Mode, 2025-2035
  • Figure 82: North America Market Value (USD Million) Analysis by End User Type, 2020-2035
  • Figure 83: North America Market Volume (Units) Analysis by End User Type, 2020-2035
  • Figure 84: North America Market Value Share (%) and BPS Analysis by End User Type, 2025-2035
  • Figure 85: North America Market Y-o-Y Growth (%) Projections by End User Type, 2025-2035
  • Figure 86: North America Market Attractiveness by Application, 2025-2035
  • Figure 87: North America Market Attractiveness by Technology, 2025-2035
  • Figure 88: North America Market Attractiveness by Platform Delivery Mode, 2025-2035
  • Figure 89: North America Market Attractiveness by End User Type, 2025-2035
  • Figure 90: North America Market Attractiveness by Country, 2025-2035
  • Figure 91: Latin America Market Value (USD Million) by Application, 2025-2035
  • Figure 92: Latin America Market Value (USD Million) by Technology, 2025-2035
  • Figure 93: Latin America Market Value (USD Million) by Platform Delivery Mode, 2025-2035
  • Figure 94: Latin America Market Value (USD Million) by End User Type, 2025-2035
  • Figure 95: Latin America Market Value (USD Million) by Country, 2025-2035
  • Figure 96: Latin America Market Value (USD Million) Analysis by Country, 2020-2035
  • Figure 97: Latin America Market Volume (Units) Analysis by Country, 2020-2035
  • Figure 98: Latin America Market Value Share (%) and BPS Analysis by Country, 2025-2035
  • Figure 99: Latin America Market Y-o-Y Growth (%) Projections by Country, 2025-2035
  • Figure 100: Latin America Market Value (USD Million) Analysis by Application, 2020-2035
  • Figure 101: Latin America Market Volume (Units) Analysis by Application, 2020-2035
  • Figure 102: Latin America Market Value Share (%) and BPS Analysis by Application, 2025-2035
  • Figure 103: Latin America Market Y-o-Y Growth (%) Projections by Application, 2025-2035
  • Figure 104: Latin America Market Value (USD Million) Analysis by Technology, 2020-2035
  • Figure 105: Latin America Market Volume (Units) Analysis by Technology, 2020-2035
  • Figure 106: Latin America Market Value Share (%) and BPS Analysis by Technology, 2025-2035
  • Figure 107: Latin America Market Y-o-Y Growth (%) Projections by Technology, 2025-2035
  • Figure 108: Latin America Market Value (USD Million) Analysis by Platform Delivery Mode, 2020-2035
  • Figure 109: Latin America Market Volume (Units) Analysis by Platform Delivery Mode, 2020-2035
  • Figure 110: Latin America Market Value Share (%) and BPS Analysis by Platform Delivery Mode, 2025-2035
  • Figure 111: Latin America Market Y-o-Y Growth (%) Projections by Platform Delivery Mode, 2025-2035
  • Figure 112: Latin America Market Value (USD Million) Analysis by End User Type, 2020-2035
  • Figure 113: Latin America Market Volume (Units) Analysis by End User Type, 2020-2035
  • Figure 114: Latin America Market Value Share (%) and BPS Analysis by End User Type, 2025-2035
  • Figure 115: Latin America Market Y-o-Y Growth (%) Projections by End User Type, 2025-2035
  • Figure 116: Latin America Market Attractiveness by Application, 2025-2035
  • Figure 117: Latin America Market Attractiveness by Technology, 2025-2035
  • Figure 118: Latin America Market Attractiveness by Platform Delivery Mode, 2025-2035
  • Figure 119: Latin America Market Attractiveness by End User Type, 2025-2035
  • Figure 120: Latin America Market Attractiveness by Country, 2025-2035
  • Figure 121: Europe Market Value (USD Million) by Application, 2025-2035
  • Figure 122: Europe Market Value (USD Million) by Technology, 2025-2035
  • Figure 123: Europe Market Value (USD Million) by Platform Delivery Mode, 2025-2035
  • Figure 124: Europe Market Value (USD Million) by End User Type, 2025-2035
  • Figure 125: Europe Market Value (USD Million) by Country, 2025-2035
  • Figure 126: Europe Market Value (USD Million) Analysis by Country, 2020-2035
  • Figure 127: Europe Market Volume (Units) Analysis by Country, 2020-2035
  • Figure 128: Europe Market Value Share (%) and BPS Analysis by Country, 2025-2035
  • Figure 129: Europe Market Y-o-Y Growth (%) Projections by Country, 2025-2035
  • Figure 130: Europe Market Value (USD Million) Analysis by Application, 2020-2035
  • Figure 131: Europe Market Volume (Units) Analysis by Application, 2020-2035
  • Figure 132: Europe Market Value Share (%) and BPS Analysis by Application, 2025-2035
  • Figure 133: Europe Market Y-o-Y Growth (%) Projections by Application, 2025-2035
  • Figure 134: Europe Market Value (USD Million) Analysis by Technology, 2020-2035
  • Figure 135: Europe Market Volume (Units) Analysis by Technology, 2020-2035
  • Figure 136: Europe Market Value Share (%) and BPS Analysis by Technology, 2025-2035
  • Figure 137: Europe Market Y-o-Y Growth (%) Projections by Technology, 2025-2035
  • Figure 138: Europe Market Value (USD Million) Analysis by Platform Delivery Mode, 2020-2035
  • Figure 139: Europe Market Volume (Units) Analysis by Platform Delivery Mode, 2020-2035
  • Figure 140: Europe Market Value Share (%) and BPS Analysis by Platform Delivery Mode, 2025-2035
  • Figure 141: Europe Market Y-o-Y Growth (%) Projections by Platform Delivery Mode, 2025-2035
  • Figure 142: Europe Market Value (USD Million) Analysis by End User Type, 2020-2035
  • Figure 143: Europe Market Volume (Units) Analysis by End User Type, 2020-2035
  • Figure 144: Europe Market Value Share (%) and BPS Analysis by End User Type, 2025-2035
  • Figure 145: Europe Market Y-o-Y Growth (%) Projections by End User Type, 2025-2035
  • Figure 146: Europe Market Attractiveness by Application, 2025-2035
  • Figure 147: Europe Market Attractiveness by Technology, 2025-2035
  • Figure 148: Europe Market Attractiveness by Platform Delivery Mode, 2025-2035
  • Figure 149: Europe Market Attractiveness by End User Type, 2025-2035
  • Figure 150: Europe Market Attractiveness by Country, 2025-2035
  • Figure 151: East Asia Market Value (USD Million) by Application, 2025-2035
  • Figure 152: East Asia Market Value (USD Million) by Technology, 2025-2035
  • Figure 153: East Asia Market Value (USD Million) by Platform Delivery Mode, 2025-2035
  • Figure 154: East Asia Market Value (USD Million) by End User Type, 2025-2035
  • Figure 155: East Asia Market Value (USD Million) by Country, 2025-2035
  • Figure 156: East Asia Market Value (USD Million) Analysis by Country, 2020-2035
  • Figure 157: East Asia Market Volume (Units) Analysis by Country, 2020-2035
  • Figure 158: East Asia Market Value Share (%) and BPS Analysis by Country, 2025-2035
  • Figure 159: East Asia Market Y-o-Y Growth (%) Projections by Country, 2025-2035
  • Figure 160: East Asia Market Value (USD Million) Analysis by Application, 2020-2035
  • Figure 161: East Asia Market Volume (Units) Analysis by Application, 2020-2035
  • Figure 162: East Asia Market Value Share (%) and BPS Analysis by Application, 2025-2035
  • Figure 163: East Asia Market Y-o-Y Growth (%) Projections by Application, 2025-2035
  • Figure 164: East Asia Market Value (USD Million) Analysis by Technology, 2020-2035
  • Figure 165: East Asia Market Volume (Units) Analysis by Technology, 2020-2035
  • Figure 166: East Asia Market Value Share (%) and BPS Analysis by Technology, 2025-2035
  • Figure 167: East Asia Market Y-o-Y Growth (%) Projections by Technology, 2025-2035
  • Figure 168: East Asia Market Value (USD Million) Analysis by Platform Delivery Mode, 2020-2035
  • Figure 169: East Asia Market Volume (Units) Analysis by Platform Delivery Mode, 2020-2035
  • Figure 170: East Asia Market Value Share (%) and BPS Analysis by Platform Delivery Mode, 2025-2035
  • Figure 171: East Asia Market Y-o-Y Growth (%) Projections by Platform Delivery Mode, 2025-2035
  • Figure 172: East Asia Market Value (USD Million) Analysis by End User Type, 2020-2035
  • Figure 173: East Asia Market Volume (Units) Analysis by End User Type, 2020-2035
  • Figure 174: East Asia Market Value Share (%) and BPS Analysis by End User Type, 2025-2035
  • Figure 175: East Asia Market Y-o-Y Growth (%) Projections by End User Type, 2025-2035
  • Figure 176: East Asia Market Attractiveness by Application, 2025-2035
  • Figure 177: East Asia Market Attractiveness by Technology, 2025-2035
  • Figure 178: East Asia Market Attractiveness by Platform Delivery Mode, 2025-2035
  • Figure 179: East Asia Market Attractiveness by End User Type, 2025-2035
  • Figure 180: East Asia Market Attractiveness by Country, 2025-2035
  • Figure 181: Middle East and Africa Market Value (USD Million) by Application, 2025-2035
  • Figure 182: Middle East and Africa Market Value (USD Million) by Technology, 2025-2035
  • Figure 183: Middle East and Africa Market Value (USD Million) by Platform Delivery Mode, 2025-2035
  • Figure 184: Middle East and Africa Market Value (USD Million) by End User Type, 2025-2035
  • Figure 185: Middle East and Africa Market Value (USD Million) by Country, 2025-2035
  • Figure 186: Middle East and Africa Market Value (USD Million) Analysis by Country, 2020-2035
  • Figure 187: Middle East and Africa Market Volume (Units) Analysis by Country, 2020-2035
  • Figure 188: Middle East and Africa Market Value Share (%) and BPS Analysis by Country, 2025-2035
  • Figure 189: Middle East and Africa Market Y-o-Y Growth (%) Projections by Country, 2025-2035
  • Figure 190: Middle East and Africa Market Value (USD Million) Analysis by Application, 2020-2035
  • Figure 191: Middle East and Africa Market Volume (Units) Analysis by Application, 2020-2035
  • Figure 192: Middle East and Africa Market Value Share (%) and BPS Analysis by Application, 2025-2035
  • Figure 193: Middle East and Africa Market Y-o-Y Growth (%) Projections by Application, 2025-2035
  • Figure 194: Middle East and Africa Market Value (USD Million) Analysis by Technology, 2020-2035
  • Figure 195: Middle East and Africa Market Volume (Units) Analysis by Technology, 2020-2035
  • Figure 196: Middle East and Africa Market Value Share (%) and BPS Analysis by Technology, 2025-2035
  • Figure 197: Middle East and Africa Market Y-o-Y Growth (%) Projections by Technology, 2025-2035
  • Figure 198: Middle East and Africa Market Value (USD Million) Analysis by Platform Delivery Mode, 2020-2035
  • Figure 199: Middle East and Africa Market Volume (Units) Analysis by Platform Delivery Mode, 2020-2035
  • Figure 200: Middle East and Africa Market Value Share (%) and BPS Analysis by Platform Delivery Mode, 2025-2035
  • Figure 201: Middle East and Africa Market Y-o-Y Growth (%) Projections by Platform Delivery Mode, 2025-2035
  • Figure 202: Middle East and Africa Market Value (USD Million) Analysis by End User Type, 2020-2035
  • Figure 203: Middle East and Africa Market Volume (Units) Analysis by End User Type, 2020-2035
  • Figure 204: Middle East and Africa Market Value Share (%) and BPS Analysis by End User Type, 2025-2035
  • Figure 205: Middle East and Africa Market Y-o-Y Growth (%) Projections by End User Type, 2025-2035
  • Figure 206: Middle East and Africa Market Attractiveness by Application, 2025-2035
  • Figure 207: Middle East and Africa Market Attractiveness by Technology, 2025-2035
  • Figure 208: Middle East and Africa Market Attractiveness by Platform Delivery Mode, 2025-2035
  • Figure 209: Middle East and Africa Market Attractiveness by End User Type, 2025-2035
  • Figure 210: Middle East and Africa Market Attractiveness by Country, 2025-2035

Frequently Asked Questions

How big is the Virtual Try-On Market in 2025?

The global Virtual Try-On Market is estimated to be valued at USD 5,902.1 million in 2025.

What will be the size of Virtual Try-On Market in 2035?

The market size for the Virtual Try-On Market is projected to reach USD 22,101.0 million by 2035.

How much will be the Virtual Try-On Market growth between 2025 and 2035?

The Virtual Try-On Market is expected to grow at a 14.1% CAGR between 2025 and 2035.

What are the key product types in the Virtual Try-On Market?

The key product types in the Virtual Try-On Market are AR-based virtual try-on tools, AI/ML-driven size and fit solutions, and face/body scanning applications integrated via SaaS or hybrid platforms.

Which technology segment will contribute significant share in the Virtual Try-On Market in 2025?

In terms of technology, the Augmented Reality (AR) segment will command 63.4% share in the Virtual Try-On Market in 2025.

Explore Similar Insights

Future Market Insights

Virtual Try-On Platform Market