Virtual Pipeline Market Size and Share Forecast Outlook 2025 to 2035

The virtual pipeline market is estimated to be valued at USD 2.6 billion in 2025 and is projected to reach USD 4.5 billion by 2035, registering a compound annual growth rate (CAGR) of 5.8% over the forecast period. The growth contribution index highlights that volume accounts for the largest share of incremental growth, particularly in the early to mid-phase of the forecast period. Increasing deployment of virtual pipelines for natural gas delivery in regions lacking fixed infrastructure underpins this trend.

Demand rises as industries, remote communities, and power generation facilities adopt these systems to secure a consistent and flexible energy supply. Technological progress in transport and storage solutions further supports volume expansion by reducing logistical constraints. Price growth, while a secondary contributor, plays a crucial role in enhancing the overall market value. Customization of virtual pipeline systems, integration of monitoring technologies, and adherence to stricter safety and regulatory standards push average transaction values upward.

Over time, premium service contracts and advanced equipment integration contribute a greater share to growth. By the end of the forecast window, the multiplication factor of 1.73x illustrates that both volume adoption and value upgrades complement each other, with volume providing the foundation while pricing innovation sustains the long-term revenue trajectory.
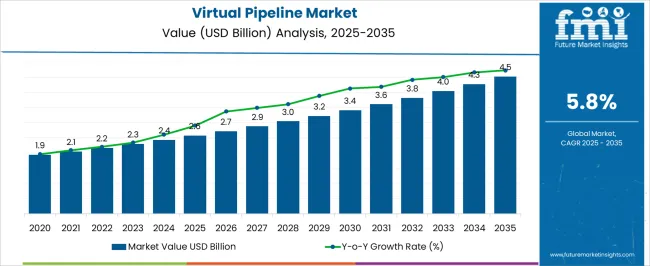
Quick Stats for Virtual Pipeline Market

  • Virtual Pipeline Market Value (2025): USD 2.6 billion
  • Virtual Pipeline Market Forecast Value (2035): USD 4.5 billion
  • Virtual Pipeline Market Forecast CAGR: 5.8%
  • Leading Segment in Virtual Pipeline Market in 2025: CNG (42.7%)
  • Key Growth Regions in Virtual Pipeline Market: North America, Asia-Pacific, Europe
  • Top Key Players in Virtual Pipeline Market: GasGrows Solutions Private Limited, Kinder Morgan, NG Advantage LLC., Snam SPA, Stabilis Solutions, Inc., FIBA Technologies, Inc., Hexagon Agility, Petroliam Nasional Berhad (PETRONAS), Gas Malaysia Virtual Pipeline Sdn. Bhd., Air Products and Chemicals, Inc., Galileo Technologies S.A., Xpress Natural Gas, CNG Services Limited, Aggreko, Gáslink - Gás Natural, S.A.

Virtual Pipeline Market Market Value Analysis

Virtual Pipeline Market Key Takeaways

Metric Value
Virtual Pipeline Market Estimated Value in (2025 E) USD 2.6 billion
Virtual Pipeline Market Forecast Value in (2035 F) USD 4.5 billion
Forecast CAGR (2025 to 2035) 5.8%

The virtual pipeline market is driven by five primary parent markets with specific shares. Natural gas distribution leads with 40%, where virtual pipelines transport gas to regions without fixed pipeline infrastructure. Power generation contributes 25%, supplying gas to remote plants for electricity production. Industrial manufacturing accounts for 15%, where factories and processing units require consistent natural gas supply. Transportation fuels represent 10%, supporting LNG and CNG distribution for vehicles.

Residential and commercial applications hold 10%, providing clean energy solutions to communities in off-grid locations. Together, these segments define demand for virtual pipelines and drive technological and logistical advancements. Recent developments in the virtual pipeline market focus on efficiency, safety, and sustainability. Companies are introducing advanced cryogenic tanks, composite cylinders, and optimized transport modules to improve capacity and reduce losses. Digital monitoring and IoT-enabled tracking systems are being deployed for real-time logistics and safety management. Expansion of LNG and CNG demand in transportation and power sectors is accelerating the adoption of virtual pipelines. Partnerships between energy providers and logistics firms are strengthening supply chains. Growing emphasis on cleaner fuels and the need to serve remote areas are positioning virtual pipelines as a critical solution in global energy distribution.

Why is the Virtual Pipeline Market Growing?

The virtual pipeline market is gaining traction as an alternative to conventional gas distribution networks, addressing infrastructure limitations and offering flexibility in fuel delivery across remote and underserved regions. The system’s ability to transport compressed or liquefied natural gas without reliance on physical pipelines has positioned it as a critical solution in regions with challenging terrain or limited grid access.

Growing environmental concerns and the global push for cleaner energy sources are accelerating demand for gas-based virtual pipeline solutions, especially in sectors transitioning away from diesel and coal. The market outlook remains positive, driven by rising investments in decentralized energy systems, favorable regulatory frameworks, and the expanding role of natural gas in energy transition strategies.

As logistical innovations reduce transportation costs and improve delivery reliability, virtual pipelines are expected to play an increasingly strategic role in gas distribution networks worldwide.

Segmental Analysis

The virtual pipeline market is segmented by fuel, mode of transportation, end use, and geographic regions. By fuel, virtual pipeline market is divided into CNG, LNG, and Others. In terms of mode of transportation, virtual pipeline market is classified into Truck, Rail, Ship, and Barge. Based on end use, virtual pipeline market is segmented into Commercial, Industrial, and Transportation. Regionally, the virtual pipeline industry is classified into North America, Latin America, Western Europe, Eastern Europe, Balkan & Baltic Countries, Russia & Belarus, Central Asia, East Asia, South Asia & Pacific, and the Middle East & Africa.
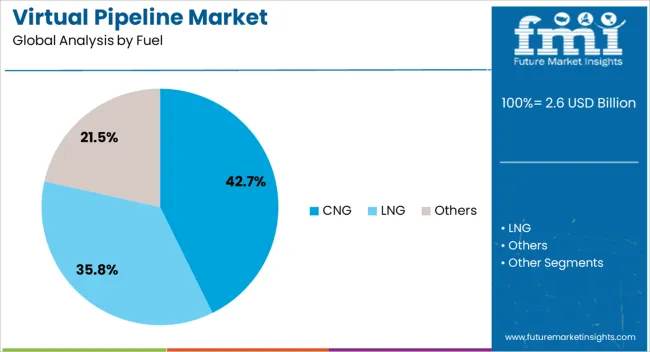
Insights into the CNG Fuel Segment

Virtual Pipeline Market Analysis By Fuel

The CNG segment dominates the fuel category with a 43% market share, driven by its cost-effectiveness, reduced carbon emissions, and broad applicability across power generation, transportation, and industrial use cases. Compressed Natural Gas is widely favored for its compatibility with existing combustion technologies and its superior energy-to-emission ratio compared to other fossil fuels.

The segment has gained momentum due to increased government incentives supporting clean fuel adoption, alongside rising demand for mobile energy solutions in remote regions. Virtual pipeline operators are leveraging CNG’s transportability to reach off-grid areas, ensuring reliable energy access without the need for extensive pipeline infrastructure.

Continued technological advancements in compression, storage, and safety systems are expected to reinforce CNG’s leadership in the virtual pipeline fuel landscape.
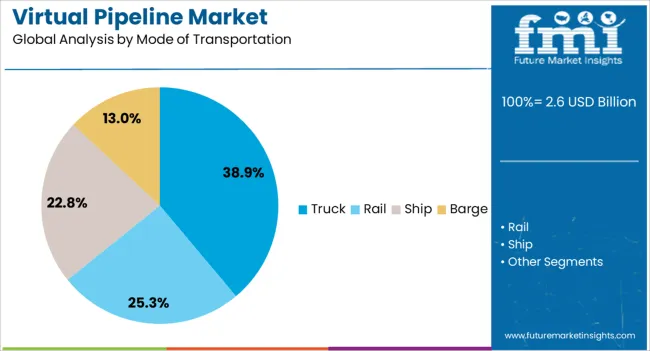
Insights into the Truck Mode of Transportation Segment

Virtual Pipeline Market Analysis By Mode Of Transportation

The truck segment accounts for 39% of the virtual pipeline market under mode of transportation, owing to its operational flexibility, scalability, and ability to serve remote end-user locations efficiently. Trucks provide a reliable and cost-effective method for moving natural gas between compression stations and off-grid demand centers, bypassing the high capital expenditure of fixed pipeline infrastructure.

This segment benefits from continuous enhancements in trailer design, storage capacity, and multi-modal integration, which have significantly improved the economics and safety of gas transport. The deployment of truck-based virtual pipelines is especially prominent in areas with intermittent or seasonal energy demands, where fixed infrastructure would be underutilized.

As the energy logistics ecosystem evolves, the truck segment is expected to retain its dominance, supported by route optimization technologies and increasing fleet investments by virtual pipeline service providers.
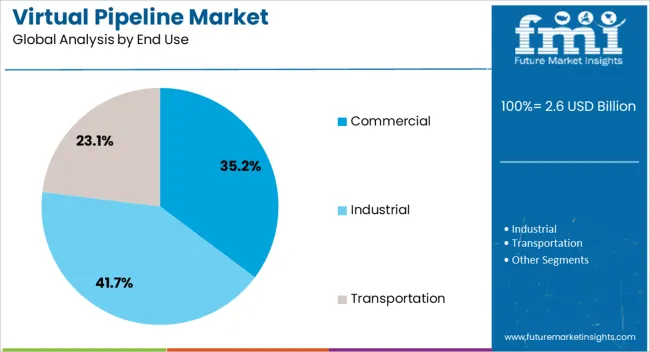
Insights into the Commercial End Use Segment

Virtual Pipeline Market Analysis By End Use

The commercial segment leads the end use category with a 35% share, reflecting its strong reliance on stable, low-emission energy sources to power operations across various sectors including retail, hospitality, and public infrastructure. Virtual pipelines offer commercial users a dependable and scalable gas supply solution without the complexity of connecting to physical pipeline grids, making them particularly valuable in expanding suburban or semi-urban regions.

The ability to secure predictable fuel deliveries helps businesses reduce operational risks, meet sustainability targets, and lower energy costs. Adoption within this segment is further driven by policy incentives, rising fuel price volatility, and the need for backup or supplementary energy in grid-constrained zones.

As commercial energy strategies increasingly prioritize flexibility and resilience, virtual pipelines are expected to become a standard component in gas procurement plans across multiple industries.

What are the Drivers, Restraints, and Key Trends of the Virtual Pipeline Market?

The virtual pipeline market is expanding as shippers and utilities seek flexible alternatives to fixed pipeline infrastructure for transporting natural gas, LNG, hydrogen, LPG, and specialty gases. Virtual pipeline solutions use road tankers, ISO cryogenic containers, tube trailers, rail tank cars, and small scale LNG carriers to move gaseous and cryogenic fuels between production sites, terminals, and end users. The model enables rapid deployment for remote industrial sites, island grids, mining operations, and seasonal demand peaks. Integration with bunkering, CNG stations, and hydrogen refueling networks enhances energy security and supply resilience while supporting decarbonization initiatives through bio and renewable gas carriers.

Drivers Accelerating Adoption Through Supply Flexibility And Energy Security

Primary drivers for the virtual pipeline market include the need for rapid supply solutions where fixed pipelines are uneconomical, lengthy permitting timelines, and rising demand from industrial heat, power generation, and transport sectors. Remote mining camps, islands, and distributed power plants rely on delivered LNG and CNG to replace diesel, lowering fuel costs and emissions. Growth in LNG small scale infrastructure, increasing investment in hydrogen pilot projects, and expansion of gas bunkering for maritime fuel strengthen demand. Regulatory pushes for lower carbon fuels and incentives for energy resilience encourage utilities and private offtakers to adopt virtual pipelines, enabling seasonal balancing, emergency supply, and flexible sourcing from global LNG spot markets.

Opportunities Emerging From Hydrogen Logistics And Small Scale LNG Networks

Opportunities for virtual pipeline providers arise from hydrogen distribution, small scale LNG rollouts, and mobile refueling services. As green hydrogen production scales at electrolyzer hubs, road and rail delivery offers interim logistics prior to pipeline build out, enabling industrial users to access renewable hydrogen. Small scale LNG plants and satellite liquefaction projects support localized gasification networks for power, industry, and bunkering, creating demand for ISO tank leasing, cryogenic trailers, and truck mounted vaporizers. Integration with renewable biogas producers and cluster electrification projects creates pathways for blended fuels. Service providers that offer turnkey solutions including storage, regasification, scheduling, and emissions compliant transport can capture new contracts with utilities, shipping companies, and large industrial customers.

Trends Shaping Market Through Digital Logistics, Modular Infrastructure, And Regulation

Key trends include digital freight scheduling, telematics for cryogenic assets, and modular liquefaction and regasification units that reduce time to market. Asset trackers, remote telemetry, and predictive maintenance improve uptime for ISO tanks and tankers, while digital contracting platforms streamline short term capacity bookings. Modular small scale liquefiers and mobile vaporizers enable seasonal or temporary deployments for festivals, construction camps, and disaster response. Policy frameworks for hydrogen blending, emissions reporting, and fuel quality standards are influencing equipment specifications and routing strategies. Cross modal solutions that combine road, rail, and coastal shipping reduce unit costs and expand coverage, enabling more competitive delivered gas prices versus liquid fuels in underserved regions.

Restraints Limiting Growth Due To Cost, Safety, And Regulatory Complexity

Despite advantages, virtual pipeline expansion faces restraints including higher unit transport cost compared with mass pipeline networks for very large continuous flows, stringent safety and handling requirements for cryogenic and high-pressure gases, and complex cross-border regulations. Capital and operating expenses for cryogenic trailers, ISO tanks, and specialized rail cars are significant, while maintenance and certification add recurring costs. Permitting for storage and regasification in populated areas can delay projects, and variability in local fuel standards complicates the interoperability of these facilities. Insurance and liability for hazardous cargo, plus the need for trained personnel for transfer operations, increase project complexity.
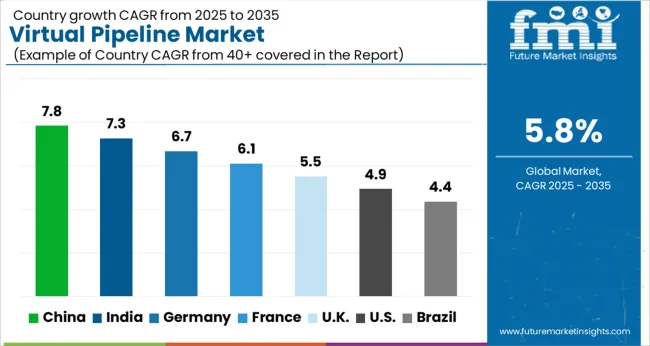
Analysis of Virtual Pipeline Market By Key Countries

Virtual Pipeline Market Cagr Analysis By Country

Country CAGR
China 7.8%
India 7.3%
Germany 6.7%
France 6.1%
UK 5.5%
USA 4.9%
Brazil 4.4%

The virtual pipeline market is projected to grow at a CAGR of 5.8% through 2035, with increasing adoption of natural gas transport solutions where conventional pipelines are not feasible. China records the highest growth at 7.8%, a 1.34× multiple of the global average, driven by large-scale energy diversification and LNG distribution projects. India follows at 7.3%, a 1.26× multiple, supported by expanding energy access initiatives and infrastructure gaps addressed by containerized gas delivery. Germany stands at 6.7%, 1.15× of the benchmark, with OECD-backed regulations promoting cleaner energy distribution and reduced dependency on fixed pipeline infrastructure. The United Kingdom posts 5.5%, slightly below the global trend, shaped by investments in flexible transport systems for industrial gas supply. The United States records 4.9%, a 0.84× multiple, where market expansion is moderated by a well-established pipeline network yet benefits from demand in remote and temporary sites. BRICS countries emerge as strong drivers, while OECD regions enhance the market with technological standards and regulatory frameworks. This report includes insights on 40+ countries; the top markets are shown here for reference.

Demand Forecast for Virtual Pipeline Market in China

The virtual pipeline market in China is expected to expand at a CAGR of 7.8%, driven by rising natural gas consumption and the need to transport it to regions without fixed pipeline infrastructure. Mobile storage units, LNG tankers, and ISO containers are widely deployed to bridge the gap between production facilities and end-use sites. Investment in clean energy and government-backed programs supporting wider gas distribution are reinforcing adoption. Domestic logistics providers and international equipment manufacturers are collaborating on efficient, cost-effective solutions. Coastal regions and industrial clusters are leading demand for LNG-based virtual pipelines, while investments in digital monitoring and fleet optimization are enhancing reliability and safety.

  • China accounted for 42% of Asia Pacific virtual pipeline deployments in 2024
  • LNG-based transport operations increased 15% year on year
  • Industrial end-use represented 46% of total demand

Analysis of Virtual Pipeline Market in India

The virtual pipeline market in India is forecast to grow at a CAGR of 7.3%, supported by expansion of city gas distribution networks and demand for natural gas in remote regions. LNG and CNG are transported using cryogenic tankers and specialized ISO containers to supplement limited physical pipeline infrastructure. Government initiatives promoting gas-based economies and clean fuel adoption are strengthening the role of virtual pipelines in bridging supply gaps. Energy companies are investing in dedicated virtual pipeline fleets to serve industrial clusters, power plants, and transport hubs. Startups are entering the market with digital tracking systems to enhance operational transparency and scheduling efficiency.
  • India represented 36% of South Asian virtual pipeline deployments in 2024
  • CNG transport services expanded 14% year on year
  • Power generation sector accounted for 33% of total usage

Virtual Pipeline Market Outlook in Germany

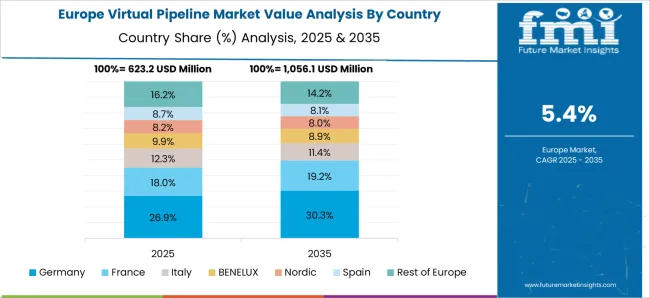
Virtual Pipeline Market Europe Country Market Share Analysis, 2025 & 2035

The virtual pipeline market in Germany is projected to expand at a CAGR of 6.7%, supported by LNG distribution to industrial customers and municipalities not connected to national grids. Infrastructure investments are directed toward LNG fueling stations and containerized transport solutions that complement existing pipeline networks. Companies are emphasizing safety compliance, digital fleet monitoring, and low-emission transport vehicles. The focus on energy diversification and reduced reliance on imported pipeline gas is increasing deployment of mobile distribution systems. Collaboration between logistics firms, energy suppliers, and technology providers is enabling more efficient delivery of LNG and CNG to remote or high-demand sites.

  • Germany accounted for 27% of European virtual pipeline demand in 2024
  • LNG fueling station integration grew 12% year on year
  • Industrial users represented 41% of market consumption

Future Outlook for Virtual Pipeline Market in the United Kingdom

The virtual pipeline market in the United Kingdom is set to grow at a CAGR of 5.5%, shaped by the need to ensure energy availability in regions without direct pipeline connectivity. LNG and CNG deliveries are facilitated by road-based fleets and ISO containers, with applications across industrial facilities, utilities, and transport fueling stations. Companies are focusing on safety standards, cryogenic handling systems, and vehicle efficiency to optimize operations. Demand is particularly strong in Scotland and rural areas where pipeline infrastructure is limited. Strategic investments are being directed toward hybrid fleets and digital systems that track energy delivery and usage in real time.
  • United Kingdom represented 22% of Western European virtual pipeline installations in 2024
  • CNG delivery services expanded 10% year on year
  • Transport fueling applications accounted for 29% of market demand

Growth Analysis of Virtual Pipeline Market in the United States

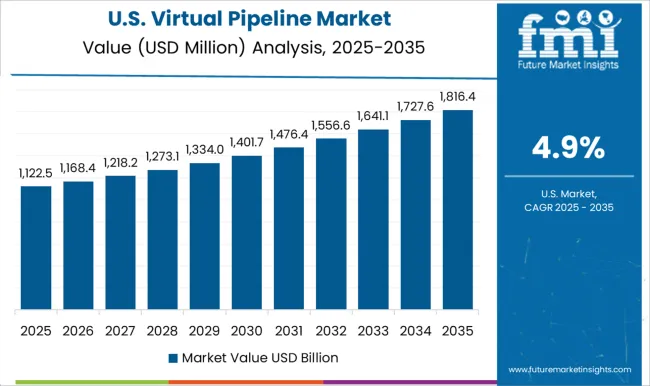
Virtual Pipeline Market Country Value Analysis

The virtual pipeline market in the United States is forecast to grow at a CAGR of 4.9%, supported by LNG and CNG distribution across regions lacking full pipeline coverage. Rising demand from industrial hubs, utilities, and transportation is driving deployment of mobile storage and cryogenic transport fleets. Federal and state-level clean energy programs are promoting wider adoption of gas-based alternatives to coal and oil. Companies are investing in digital scheduling platforms, advanced ISO containers, and specialized transport vehicles to improve cost efficiency and safety. Expansion of LNG fueling infrastructure and long-haul trucking fleets further strengthens growth prospects in the US.
  • United States contributed 35% of North American virtual pipeline demand in 2024
  • LNG delivery services increased 11% year on year
  • Utilities sector represented 37% of total consumption

Competitive Landscape of Virtual Pipeline Market

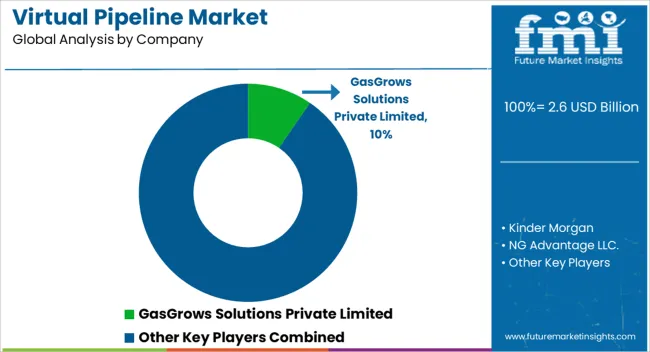
Virtual Pipeline Market Analysis By Company

Competition in the virtual pipeline sector revolves around expanding natural gas accessibility through modular, transportable solutions that bypass the need for traditional infrastructure. GasGrows Solutions Private Limited is strengthening its role in flexible energy delivery by supporting industries with mobile gas supply systems. Kinder Morgan, a global name in energy infrastructure, has extended its capabilities into virtual pipeline solutions to optimize natural gas distribution across underserved regions. NG Advantage LLC specializes in virtual pipeline logistics, delivering compressed natural gas (CNG) to commercial and industrial clients that lack direct pipeline connections.

Snam SPA, a European energy leader, has been innovating in clean energy distribution with scalable virtual pipeline technologies that complement its pipeline network. Stabilis Solutions, Inc. focuses on liquefied natural gas (LNG) distribution, offering customized solutions for industries and remote communities. FIBA Technologies, Inc. provides high-pressure gas storage and transportation systems essential to the safe operation of virtual pipelines. Hexagon Agility has emerged as a key player with advanced composite cylinder systems designed for efficient CNG and LNG transport. Petroliam Nasional Berhad (PETRONAS) and Gas Malaysia Virtual Pipeline Sdn. Bhd. have built regional capabilities in Asia, extending gas accessibility to off-grid areas. Air Products and Chemicals, Inc. contributes with advanced cryogenic technologies for LNG handling, while Galileo Technologies S.A. delivers modular compression and transport systems enabling greater flexibility. Xpress Natural Gas operates large-scale CNG logistics in North America, supported by CNG Services Limited in Europe. Aggreko integrates temporary power solutions with virtual gas supply, and Gáslink - Gás Natural, S.A. enhances natural gas accessibility across Portugal, completing a competitive landscape focused on efficient and sustainable energy transport.

Key Players in the Virtual Pipeline Market

  • GasGrows Solutions Private Limited
  • Kinder Morgan
  • NG Advantage LLC.
  • Snam SPA
  • Stabilis Solutions, Inc.
  • FIBA Technologies, Inc.
  • Hexagon Agility
  • Petroliam Nasional Berhad (PETRONAS)
  • Gas Malaysia Virtual Pipeline Sdn. Bhd.
  • Air Products and Chemicals, Inc.
  • Galileo Technologies S.A.
  • Xpress Natural Gas
  • CNG Services Limited
  • Aggreko
  • Gáslink - Gás Natural, S.A.

Scope of the Report

Item Value
Quantitative Units USD 2.6 Billion
Fuel CNG, LNG, and Others
Mode of Transportation Truck, Rail, Ship, and Barge
End Use Commercial, Industrial, and Transportation
Regions Covered North America, Europe, Asia-Pacific, Latin America, Middle East & Africa
Country Covered United States, Canada, Germany, France, United Kingdom, China, Japan, India, Brazil, South Africa
Key Companies Profiled GasGrows Solutions Private Limited, Kinder Morgan, NG Advantage LLC., Snam SPA, Stabilis Solutions, Inc., FIBA Technologies, Inc., Hexagon Agility, Petroliam Nasional Berhad (PETRONAS), Gas Malaysia Virtual Pipeline Sdn. Bhd., Air Products and Chemicals, Inc., Galileo Technologies S.A., Xpress Natural Gas, CNG Services Limited, Aggreko, and Gáslink - Gás Natural, S.A.
Additional Attributes Dollar sales by pipeline type and end use, demand dynamics across natural gas, LNG, and energy distribution, regional trends in remote and distributed supply, innovation in transport, storage, and monitoring technologies, environmental impact of emissions and energy use, and emerging use cases in peak shaving, emergency supply, and off-grid energy solutions.

Virtual Pipeline Market by Segments

Fuel:

  • CNG
  • LNG
  • Others

Mode of Transportation:

  • Truck
  • Rail
  • Ship
  • Barge

End Use:

  • Commercial
  • Industrial
  • Transportation

Region:

  • North America
    • USA
    • Canada
    • Mexico
  • Latin America
    • Brazil
    • Chile
    • Rest of Latin America
  • Western Europe
    • Germany
    • UK
    • Italy
    • Spain
    • France
    • Nordic
    • BENELUX
    • Rest of Western Europe
  • Eastern Europe
    • Russia
    • Poland
    • Hungary
    • Balkan & Baltic
    • Rest of Eastern Europe
  • East Asia
    • China
    • Japan
    • South Korea
  • South Asia and Pacific
    • India
    • ASEAN
    • Australia & New Zealand
    • Rest of South Asia and Pacific
  • Middle East & Africa
    • Kingdom of Saudi Arabia
    • Other GCC Countries
    • Turkiye
    • South Africa
    • Other African Union
    • Rest of Middle East & Africa

Table of Content

  1. Executive Summary
    • Global Market Outlook
    • Demand-side Trends
    • Supply-side Trends
    • Technology Roadmap Analysis
    • Analysis and Recommendations
  2. Market Overview
    • Market Coverage / Taxonomy
    • Market Definition / Scope / Limitations
  3. Market Background
    • Market Dynamics
      • Drivers
      • Restraints
      • Opportunity
      • Trends
    • Scenario Forecast
      • Demand in Optimistic Scenario
      • Demand in Likely Scenario
      • Demand in Conservative Scenario
    • Opportunity Map Analysis
    • Product Life Cycle Analysis
    • Supply Chain Analysis
    • Investment Feasibility Matrix
    • Value Chain Analysis
    • PESTLE and Porter’s Analysis
    • Regulatory Landscape
    • Regional Parent Market Outlook
    • Production and Consumption Statistics
    • Import and Export Statistics
  4. Global Virtual Pipeline Market Analysis 2020-2024 and Forecast, 2025-2035
    • Historical Market Size Value (USD Mn) Analysis, 2020-2024
    • Current and Future Market Size Value (USD Mn) Projections, 2025-2035
      • Y-o-Y Growth Trend Analysis
      • Absolute $ Opportunity Analysis
  5. Global Virtual Pipeline Market Pricing Analysis 2020-2024 and Forecast 2025-2035
  6. Global Virtual Pipeline Market Analysis 2020-2024 and Forecast 2025-2035, By Fuel
    • Introduction / Key Findings
    • Historical Market Size Value (USD Mn) Analysis By Fuel , 2020-2024
    • Current and Future Market Size Value (USD Mn) Analysis and Forecast By Fuel , 2025-2035
      • CNG
      • LNG
      • Others
    • Y-o-Y Growth Trend Analysis By Fuel , 2020-2024
    • Absolute $ Opportunity Analysis By Fuel , 2025-2035
  7. Global Virtual Pipeline Market Analysis 2020-2024 and Forecast 2025-2035, By Mode of Transportation
    • Introduction / Key Findings
    • Historical Market Size Value (USD Mn) Analysis By Mode of Transportation, 2020-2024
    • Current and Future Market Size Value (USD Mn) Analysis and Forecast By Mode of Transportation, 2025-2035
      • Truck
      • Rail
      • Ship
      • Barge
    • Y-o-Y Growth Trend Analysis By Mode of Transportation, 2020-2024
    • Absolute $ Opportunity Analysis By Mode of Transportation, 2025-2035
  8. Global Virtual Pipeline Market Analysis 2020-2024 and Forecast 2025-2035, By End Use
    • Introduction / Key Findings
    • Historical Market Size Value (USD Mn) Analysis By End Use, 2020-2024
    • Current and Future Market Size Value (USD Mn) Analysis and Forecast By End Use, 2025-2035
      • Commercial
      • Industrial
      • Transportation
    • Y-o-Y Growth Trend Analysis By End Use, 2020-2024
    • Absolute $ Opportunity Analysis By End Use, 2025-2035
  9. Global Virtual Pipeline Market Analysis 2020-2024 and Forecast 2025-2035, By Region
    • Introduction
    • Historical Market Size Value (USD Mn) Analysis By Region, 2020-2024
    • Current Market Size Value (USD Mn) Analysis and Forecast By Region, 2025-2035
      • North America
      • Latin America
      • Western Europe
      • Eastern Europe
      • East Asia
      • South Asia and Pacific
      • Middle East & Africa
    • Market Attractiveness Analysis By Region
  10. North America Virtual Pipeline Market Analysis 2020-2024 and Forecast 2025-2035, By Country
    • Historical Market Size Value (USD Mn) Trend Analysis By Market Taxonomy, 2020-2024
    • Market Size Value (USD Mn) Forecast By Market Taxonomy, 2025-2035
      • By Country
        • USA
        • Canada
        • Mexico
      • By Fuel
      • By Mode of Transportation
      • By End Use
    • Market Attractiveness Analysis
      • By Country
      • By Fuel
      • By Mode of Transportation
      • By End Use
    • Key Takeaways
  11. Latin America Virtual Pipeline Market Analysis 2020-2024 and Forecast 2025-2035, By Country
    • Historical Market Size Value (USD Mn) Trend Analysis By Market Taxonomy, 2020-2024
    • Market Size Value (USD Mn) Forecast By Market Taxonomy, 2025-2035
      • By Country
        • Brazil
        • Chile
        • Rest of Latin America
      • By Fuel
      • By Mode of Transportation
      • By End Use
    • Market Attractiveness Analysis
      • By Country
      • By Fuel
      • By Mode of Transportation
      • By End Use
    • Key Takeaways
  12. Western Europe Virtual Pipeline Market Analysis 2020-2024 and Forecast 2025-2035, By Country
    • Historical Market Size Value (USD Mn) Trend Analysis By Market Taxonomy, 2020-2024
    • Market Size Value (USD Mn) Forecast By Market Taxonomy, 2025-2035
      • By Country
        • Germany
        • UK
        • Italy
        • Spain
        • France
        • Nordic
        • BENELUX
        • Rest of Western Europe
      • By Fuel
      • By Mode of Transportation
      • By End Use
    • Market Attractiveness Analysis
      • By Country
      • By Fuel
      • By Mode of Transportation
      • By End Use
    • Key Takeaways
  13. Eastern Europe Virtual Pipeline Market Analysis 2020-2024 and Forecast 2025-2035, By Country
    • Historical Market Size Value (USD Mn) Trend Analysis By Market Taxonomy, 2020-2024
    • Market Size Value (USD Mn) Forecast By Market Taxonomy, 2025-2035
      • By Country
        • Russia
        • Poland
        • Hungary
        • Balkan & Baltic
        • Rest of Eastern Europe
      • By Fuel
      • By Mode of Transportation
      • By End Use
    • Market Attractiveness Analysis
      • By Country
      • By Fuel
      • By Mode of Transportation
      • By End Use
    • Key Takeaways
  14. East Asia Virtual Pipeline Market Analysis 2020-2024 and Forecast 2025-2035, By Country
    • Historical Market Size Value (USD Mn) Trend Analysis By Market Taxonomy, 2020-2024
    • Market Size Value (USD Mn) Forecast By Market Taxonomy, 2025-2035
      • By Country
        • China
        • Japan
        • South Korea
      • By Fuel
      • By Mode of Transportation
      • By End Use
    • Market Attractiveness Analysis
      • By Country
      • By Fuel
      • By Mode of Transportation
      • By End Use
    • Key Takeaways
  15. South Asia and Pacific Virtual Pipeline Market Analysis 2020-2024 and Forecast 2025-2035, By Country
    • Historical Market Size Value (USD Mn) Trend Analysis By Market Taxonomy, 2020-2024
    • Market Size Value (USD Mn) Forecast By Market Taxonomy, 2025-2035
      • By Country
        • India
        • ASEAN
        • Australia & New Zealand
        • Rest of South Asia and Pacific
      • By Fuel
      • By Mode of Transportation
      • By End Use
    • Market Attractiveness Analysis
      • By Country
      • By Fuel
      • By Mode of Transportation
      • By End Use
    • Key Takeaways
  16. Middle East & Africa Virtual Pipeline Market Analysis 2020-2024 and Forecast 2025-2035, By Country
    • Historical Market Size Value (USD Mn) Trend Analysis By Market Taxonomy, 2020-2024
    • Market Size Value (USD Mn) Forecast By Market Taxonomy, 2025-2035
      • By Country
        • Kingdom of Saudi Arabia
        • Other GCC Countries
        • Turkiye
        • South Africa
        • Other African Union
        • Rest of Middle East & Africa
      • By Fuel
      • By Mode of Transportation
      • By End Use
    • Market Attractiveness Analysis
      • By Country
      • By Fuel
      • By Mode of Transportation
      • By End Use
    • Key Takeaways
  17. Key Countries Virtual Pipeline Market Analysis
    • USA
      • Pricing Analysis
      • Market Share Analysis, 2024
        • By Fuel
        • By Mode of Transportation
        • By End Use
    • Canada
      • Pricing Analysis
      • Market Share Analysis, 2024
        • By Fuel
        • By Mode of Transportation
        • By End Use
    • Mexico
      • Pricing Analysis
      • Market Share Analysis, 2024
        • By Fuel
        • By Mode of Transportation
        • By End Use
    • Brazil
      • Pricing Analysis
      • Market Share Analysis, 2024
        • By Fuel
        • By Mode of Transportation
        • By End Use
    • Chile
      • Pricing Analysis
      • Market Share Analysis, 2024
        • By Fuel
        • By Mode of Transportation
        • By End Use
    • Germany
      • Pricing Analysis
      • Market Share Analysis, 2024
        • By Fuel
        • By Mode of Transportation
        • By End Use
    • UK
      • Pricing Analysis
      • Market Share Analysis, 2024
        • By Fuel
        • By Mode of Transportation
        • By End Use
    • Italy
      • Pricing Analysis
      • Market Share Analysis, 2024
        • By Fuel
        • By Mode of Transportation
        • By End Use
    • Spain
      • Pricing Analysis
      • Market Share Analysis, 2024
        • By Fuel
        • By Mode of Transportation
        • By End Use
    • France
      • Pricing Analysis
      • Market Share Analysis, 2024
        • By Fuel
        • By Mode of Transportation
        • By End Use
    • India
      • Pricing Analysis
      • Market Share Analysis, 2024
        • By Fuel
        • By Mode of Transportation
        • By End Use
    • ASEAN
      • Pricing Analysis
      • Market Share Analysis, 2024
        • By Fuel
        • By Mode of Transportation
        • By End Use
    • Australia & New Zealand
      • Pricing Analysis
      • Market Share Analysis, 2024
        • By Fuel
        • By Mode of Transportation
        • By End Use
    • China
      • Pricing Analysis
      • Market Share Analysis, 2024
        • By Fuel
        • By Mode of Transportation
        • By End Use
    • Japan
      • Pricing Analysis
      • Market Share Analysis, 2024
        • By Fuel
        • By Mode of Transportation
        • By End Use
    • South Korea
      • Pricing Analysis
      • Market Share Analysis, 2024
        • By Fuel
        • By Mode of Transportation
        • By End Use
    • Russia
      • Pricing Analysis
      • Market Share Analysis, 2024
        • By Fuel
        • By Mode of Transportation
        • By End Use
    • Poland
      • Pricing Analysis
      • Market Share Analysis, 2024
        • By Fuel
        • By Mode of Transportation
        • By End Use
    • Hungary
      • Pricing Analysis
      • Market Share Analysis, 2024
        • By Fuel
        • By Mode of Transportation
        • By End Use
    • Kingdom of Saudi Arabia
      • Pricing Analysis
      • Market Share Analysis, 2024
        • By Fuel
        • By Mode of Transportation
        • By End Use
    • Turkiye
      • Pricing Analysis
      • Market Share Analysis, 2024
        • By Fuel
        • By Mode of Transportation
        • By End Use
    • South Africa
      • Pricing Analysis
      • Market Share Analysis, 2024
        • By Fuel
        • By Mode of Transportation
        • By End Use
  18. Market Structure Analysis
    • Competition Dashboard
    • Competition Benchmarking
    • Market Share Analysis of Top Players
      • By Regional
      • By Fuel
      • By Mode of Transportation
      • By End Use
  19. Competition Analysis
    • Competition Deep Dive
      • GasGrows Solutions Private Limited
        • Overview
        • Product Portfolio
        • Profitability by Market Segments (Product/Age /Sales Channel/Region)
        • Sales Footprint
        • Strategy Overview
          • Marketing Strategy
          • Product Strategy
          • Channel Strategy
      • Kinder Morgan
      • NG Advantage LLC.
      • Snam SPA
      • Stabilis Solutions, Inc.
      • FIBA Technologies, Inc.
      • Hexagon Agility
      • Petroliam Nasional Berhad (PETRONAS)
      • Gas Malaysia Virtual Pipeline Sdn. Bhd.
      • Air Products and Chemicals, Inc.
      • Galileo Technologies S.A.
      • Xpress Natural Gas
      • CNG Services Limited
      • Aggreko
      • Gáslink - Gás Natural, S.A.
  20. Assumptions & Acronyms Used
  21. Research Methodology

List of Tables

  • Table 1: Global Virtual Pipeline Market Value (USD Mn) Forecast by Region, 2020-2035
  • Table 2: Global Virtual Pipeline Market Value (USD Mn) Forecast by Fuel , 2020-2035
  • Table 3: Global Virtual Pipeline Market Value (USD Mn) Forecast by Mode of Transportation, 2020-2035
  • Table 4: Global Virtual Pipeline Market Value (USD Mn) Forecast by End Use, 2020-2035
  • Table 5: North America Virtual Pipeline Market Value (USD Mn) Forecast by Country, 2020-2035
  • Table 6: North America Virtual Pipeline Market Value (USD Mn) Forecast by Fuel , 2020-2035
  • Table 7: North America Virtual Pipeline Market Value (USD Mn) Forecast by Mode of Transportation, 2020-2035
  • Table 8: North America Virtual Pipeline Market Value (USD Mn) Forecast by End Use, 2020-2035
  • Table 9: Latin America Virtual Pipeline Market Value (USD Mn) Forecast by Country, 2020-2035
  • Table 10: Latin America Virtual Pipeline Market Value (USD Mn) Forecast by Fuel , 2020-2035
  • Table 11: Latin America Virtual Pipeline Market Value (USD Mn) Forecast by Mode of Transportation, 2020-2035
  • Table 12: Latin America Virtual Pipeline Market Value (USD Mn) Forecast by End Use, 2020-2035
  • Table 13: Western Europe Virtual Pipeline Market Value (USD Mn) Forecast by Country, 2020-2035
  • Table 14: Western Europe Virtual Pipeline Market Value (USD Mn) Forecast by Fuel , 2020-2035
  • Table 15: Western Europe Virtual Pipeline Market Value (USD Mn) Forecast by Mode of Transportation, 2020-2035
  • Table 16: Western Europe Virtual Pipeline Market Value (USD Mn) Forecast by End Use, 2020-2035
  • Table 17: Eastern Europe Virtual Pipeline Market Value (USD Mn) Forecast by Country, 2020-2035
  • Table 18: Eastern Europe Virtual Pipeline Market Value (USD Mn) Forecast by Fuel , 2020-2035
  • Table 19: Eastern Europe Virtual Pipeline Market Value (USD Mn) Forecast by Mode of Transportation, 2020-2035
  • Table 20: Eastern Europe Virtual Pipeline Market Value (USD Mn) Forecast by End Use, 2020-2035
  • Table 21: East Asia Virtual Pipeline Market Value (USD Mn) Forecast by Country, 2020-2035
  • Table 22: East Asia Virtual Pipeline Market Value (USD Mn) Forecast by Fuel , 2020-2035
  • Table 23: East Asia Virtual Pipeline Market Value (USD Mn) Forecast by Mode of Transportation, 2020-2035
  • Table 24: East Asia Virtual Pipeline Market Value (USD Mn) Forecast by End Use, 2020-2035
  • Table 25: South Asia and Pacific Virtual Pipeline Market Value (USD Mn) Forecast by Country, 2020-2035
  • Table 26: South Asia and Pacific Virtual Pipeline Market Value (USD Mn) Forecast by Fuel , 2020-2035
  • Table 27: South Asia and Pacific Virtual Pipeline Market Value (USD Mn) Forecast by Mode of Transportation, 2020-2035
  • Table 28: South Asia and Pacific Virtual Pipeline Market Value (USD Mn) Forecast by End Use, 2020-2035
  • Table 29: Middle East & Africa Virtual Pipeline Market Value (USD Mn) Forecast by Country, 2020-2035
  • Table 30: Middle East & Africa Virtual Pipeline Market Value (USD Mn) Forecast by Fuel , 2020-2035
  • Table 31: Middle East & Africa Virtual Pipeline Market Value (USD Mn) Forecast by Mode of Transportation, 2020-2035
  • Table 32: Middle East & Africa Virtual Pipeline Market Value (USD Mn) Forecast by End Use, 2020-2035

List of Figures

  • Figure 1: Global Virtual Pipeline Market Pricing Analysis
  • Figure 2: Global Virtual Pipeline Market Value (USD Mn) Forecast 2020–2035
  • Figure 3: Global Virtual Pipeline Market Value Share and BPS Analysis by Fuel , 2025 and 2035
  • Figure 4: Global Virtual Pipeline Market Y-o-Y Growth Comparison by Fuel , 2025–2035
  • Figure 5: Global Virtual Pipeline Market Attractiveness Analysis by Fuel
  • Figure 6: Global Virtual Pipeline Market Value Share and BPS Analysis by Mode of Transportation, 2025 and 2035
  • Figure 7: Global Virtual Pipeline Market Y-o-Y Growth Comparison by Mode of Transportation, 2025–2035
  • Figure 8: Global Virtual Pipeline Market Attractiveness Analysis by Mode of Transportation
  • Figure 9: Global Virtual Pipeline Market Value Share and BPS Analysis by End Use, 2025 and 2035
  • Figure 10: Global Virtual Pipeline Market Y-o-Y Growth Comparison by End Use, 2025–2035
  • Figure 11: Global Virtual Pipeline Market Attractiveness Analysis by End Use
  • Figure 12: Global Virtual Pipeline Market Value (USD Mn) Share and BPS Analysis by Region, 2025 and 2035
  • Figure 13: Global Virtual Pipeline Market Y-o-Y Growth Comparison by Region, 2025–2035
  • Figure 14: Global Virtual Pipeline Market Attractiveness Analysis by Region
  • Figure 15: North America Virtual Pipeline Market Incremental Dollar Opportunity, 2025–2035
  • Figure 16: Latin America Virtual Pipeline Market Incremental Dollar Opportunity, 2025–2035
  • Figure 17: Western Europe Virtual Pipeline Market Incremental Dollar Opportunity, 2025–2035
  • Figure 18: Eastern Europe Virtual Pipeline Market Incremental Dollar Opportunity, 2025–2035
  • Figure 19: East Asia Virtual Pipeline Market Incremental Dollar Opportunity, 2025–2035
  • Figure 20: South Asia and Pacific Virtual Pipeline Market Incremental Dollar Opportunity, 2025–2035
  • Figure 21: Middle East & Africa Virtual Pipeline Market Incremental Dollar Opportunity, 2025–2035
  • Figure 22: North America Virtual Pipeline Market Value Share and BPS Analysis by Country, 2025 and 2035
  • Figure 23: North America Virtual Pipeline Market Value Share and BPS Analysis by Fuel , 2025 and 2035
  • Figure 24: North America Virtual Pipeline Market Y-o-Y Growth Comparison by Fuel , 2025–2035
  • Figure 25: North America Virtual Pipeline Market Attractiveness Analysis by Fuel
  • Figure 26: North America Virtual Pipeline Market Value Share and BPS Analysis by Mode of Transportation, 2025 and 2035
  • Figure 27: North America Virtual Pipeline Market Y-o-Y Growth Comparison by Mode of Transportation, 2025–2035
  • Figure 28: North America Virtual Pipeline Market Attractiveness Analysis by Mode of Transportation
  • Figure 29: North America Virtual Pipeline Market Value Share and BPS Analysis by End Use, 2025 and 2035
  • Figure 30: North America Virtual Pipeline Market Y-o-Y Growth Comparison by End Use, 2025–2035
  • Figure 31: North America Virtual Pipeline Market Attractiveness Analysis by End Use
  • Figure 32: Latin America Virtual Pipeline Market Value Share and BPS Analysis by Country, 2025 and 2035
  • Figure 33: Latin America Virtual Pipeline Market Value Share and BPS Analysis by Fuel , 2025 and 2035
  • Figure 34: Latin America Virtual Pipeline Market Y-o-Y Growth Comparison by Fuel , 2025–2035
  • Figure 35: Latin America Virtual Pipeline Market Attractiveness Analysis by Fuel
  • Figure 36: Latin America Virtual Pipeline Market Value Share and BPS Analysis by Mode of Transportation, 2025 and 2035
  • Figure 37: Latin America Virtual Pipeline Market Y-o-Y Growth Comparison by Mode of Transportation, 2025–2035
  • Figure 38: Latin America Virtual Pipeline Market Attractiveness Analysis by Mode of Transportation
  • Figure 39: Latin America Virtual Pipeline Market Value Share and BPS Analysis by End Use, 2025 and 2035
  • Figure 40: Latin America Virtual Pipeline Market Y-o-Y Growth Comparison by End Use, 2025–2035
  • Figure 41: Latin America Virtual Pipeline Market Attractiveness Analysis by End Use
  • Figure 42: Western Europe Virtual Pipeline Market Value Share and BPS Analysis by Country, 2025 and 2035
  • Figure 43: Western Europe Virtual Pipeline Market Value Share and BPS Analysis by Fuel , 2025 and 2035
  • Figure 44: Western Europe Virtual Pipeline Market Y-o-Y Growth Comparison by Fuel , 2025–2035
  • Figure 45: Western Europe Virtual Pipeline Market Attractiveness Analysis by Fuel
  • Figure 46: Western Europe Virtual Pipeline Market Value Share and BPS Analysis by Mode of Transportation, 2025 and 2035
  • Figure 47: Western Europe Virtual Pipeline Market Y-o-Y Growth Comparison by Mode of Transportation, 2025–2035
  • Figure 48: Western Europe Virtual Pipeline Market Attractiveness Analysis by Mode of Transportation
  • Figure 49: Western Europe Virtual Pipeline Market Value Share and BPS Analysis by End Use, 2025 and 2035
  • Figure 50: Western Europe Virtual Pipeline Market Y-o-Y Growth Comparison by End Use, 2025–2035
  • Figure 51: Western Europe Virtual Pipeline Market Attractiveness Analysis by End Use
  • Figure 52: Eastern Europe Virtual Pipeline Market Value Share and BPS Analysis by Country, 2025 and 2035
  • Figure 53: Eastern Europe Virtual Pipeline Market Value Share and BPS Analysis by Fuel , 2025 and 2035
  • Figure 54: Eastern Europe Virtual Pipeline Market Y-o-Y Growth Comparison by Fuel , 2025–2035
  • Figure 55: Eastern Europe Virtual Pipeline Market Attractiveness Analysis by Fuel
  • Figure 56: Eastern Europe Virtual Pipeline Market Value Share and BPS Analysis by Mode of Transportation, 2025 and 2035
  • Figure 57: Eastern Europe Virtual Pipeline Market Y-o-Y Growth Comparison by Mode of Transportation, 2025–2035
  • Figure 58: Eastern Europe Virtual Pipeline Market Attractiveness Analysis by Mode of Transportation
  • Figure 59: Eastern Europe Virtual Pipeline Market Value Share and BPS Analysis by End Use, 2025 and 2035
  • Figure 60: Eastern Europe Virtual Pipeline Market Y-o-Y Growth Comparison by End Use, 2025–2035
  • Figure 61: Eastern Europe Virtual Pipeline Market Attractiveness Analysis by End Use
  • Figure 62: East Asia Virtual Pipeline Market Value Share and BPS Analysis by Country, 2025 and 2035
  • Figure 63: East Asia Virtual Pipeline Market Value Share and BPS Analysis by Fuel , 2025 and 2035
  • Figure 64: East Asia Virtual Pipeline Market Y-o-Y Growth Comparison by Fuel , 2025–2035
  • Figure 65: East Asia Virtual Pipeline Market Attractiveness Analysis by Fuel
  • Figure 66: East Asia Virtual Pipeline Market Value Share and BPS Analysis by Mode of Transportation, 2025 and 2035
  • Figure 67: East Asia Virtual Pipeline Market Y-o-Y Growth Comparison by Mode of Transportation, 2025–2035
  • Figure 68: East Asia Virtual Pipeline Market Attractiveness Analysis by Mode of Transportation
  • Figure 69: East Asia Virtual Pipeline Market Value Share and BPS Analysis by End Use, 2025 and 2035
  • Figure 70: East Asia Virtual Pipeline Market Y-o-Y Growth Comparison by End Use, 2025–2035
  • Figure 71: East Asia Virtual Pipeline Market Attractiveness Analysis by End Use
  • Figure 72: South Asia and Pacific Virtual Pipeline Market Value Share and BPS Analysis by Country, 2025 and 2035
  • Figure 73: South Asia and Pacific Virtual Pipeline Market Value Share and BPS Analysis by Fuel , 2025 and 2035
  • Figure 74: South Asia and Pacific Virtual Pipeline Market Y-o-Y Growth Comparison by Fuel , 2025–2035
  • Figure 75: South Asia and Pacific Virtual Pipeline Market Attractiveness Analysis by Fuel
  • Figure 76: South Asia and Pacific Virtual Pipeline Market Value Share and BPS Analysis by Mode of Transportation, 2025 and 2035
  • Figure 77: South Asia and Pacific Virtual Pipeline Market Y-o-Y Growth Comparison by Mode of Transportation, 2025–2035
  • Figure 78: South Asia and Pacific Virtual Pipeline Market Attractiveness Analysis by Mode of Transportation
  • Figure 79: South Asia and Pacific Virtual Pipeline Market Value Share and BPS Analysis by End Use, 2025 and 2035
  • Figure 80: South Asia and Pacific Virtual Pipeline Market Y-o-Y Growth Comparison by End Use, 2025–2035
  • Figure 81: South Asia and Pacific Virtual Pipeline Market Attractiveness Analysis by End Use
  • Figure 82: Middle East & Africa Virtual Pipeline Market Value Share and BPS Analysis by Country, 2025 and 2035
  • Figure 83: Middle East & Africa Virtual Pipeline Market Value Share and BPS Analysis by Fuel , 2025 and 2035
  • Figure 84: Middle East & Africa Virtual Pipeline Market Y-o-Y Growth Comparison by Fuel , 2025–2035
  • Figure 85: Middle East & Africa Virtual Pipeline Market Attractiveness Analysis by Fuel
  • Figure 86: Middle East & Africa Virtual Pipeline Market Value Share and BPS Analysis by Mode of Transportation, 2025 and 2035
  • Figure 87: Middle East & Africa Virtual Pipeline Market Y-o-Y Growth Comparison by Mode of Transportation, 2025–2035
  • Figure 88: Middle East & Africa Virtual Pipeline Market Attractiveness Analysis by Mode of Transportation
  • Figure 89: Middle East & Africa Virtual Pipeline Market Value Share and BPS Analysis by End Use, 2025 and 2035
  • Figure 90: Middle East & Africa Virtual Pipeline Market Y-o-Y Growth Comparison by End Use, 2025–2035
  • Figure 91: Middle East & Africa Virtual Pipeline Market Attractiveness Analysis by End Use
  • Figure 92: Global Virtual Pipeline Market – Tier Structure Analysis
  • Figure 93: Global Virtual Pipeline Market – Company Share Analysis

Frequently Asked Questions

How big is the virtual pipeline market in 2025?

The global virtual pipeline market is estimated to be valued at USD 2.6 billion in 2025.

What will be the size of virtual pipeline market in 2035?

The market size for the virtual pipeline market is projected to reach USD 4.5 billion by 2035.

How much will be the virtual pipeline market growth between 2025 and 2035?

The virtual pipeline market is expected to grow at a 5.8% CAGR between 2025 and 2035.

What are the key product types in the virtual pipeline market?

The key product types in virtual pipeline market are cng, lng and others.

Which mode of transportation segment to contribute significant share in the virtual pipeline market in 2025?

In terms of mode of transportation, truck segment to command 38.9% share in the virtual pipeline market in 2025.

Explore Similar Insights

Future Market Insights

Virtual Pipeline Market

Chat With

MaRIA

Hi There, I am MaRIA, Your Market Research Intelligence Assistant. How may I help you?