The virtual land NFT market is projected to grow from USD 1.1 billion in 2025 to USD 20.9 billion by 2035, reflecting an impressive 34.5% CAGR. Growth is driven by the rising interest in metaverse platforms and virtual real estate. The metaverse & virtual goods segment leads with 30% of the market share. China, India, and Germany are key growth regions, with China leading at a 46.6% CAGR. Major players include Decentraland, The Sandbox, and Somnium Space. The virtual land NFT market is expected to grow to USD 4.7 billion, driven by gaming and real estate in virtual worlds. Between 2030 and 2035, it will expand to USD 20.9 billion, driven by the mass adoption of virtual environments for business and social interaction.
The primary market leads with 60% of the share, driven by initial sales of virtual land NFTs. Key drivers include blockchain technology, metaverse adoption, and increasing institutional interest. However, the virtual land NFT market faces challenges such as price volatility, regulatory uncertainty, and environmental concerns regarding blockchain. Competitive trends include innovations in NFT platforms, gaming worlds, and virtual asset monetization.
Quick Stats of the Virtual Land NFT Market
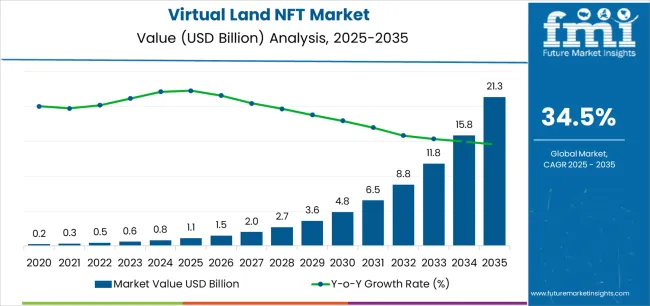
From 2025 to 2030, the market is projected to grow from USD 1.1 billion to USD 4.7 billion, a rise of USD 3.6 billion. This period will see increased investment in virtual worlds, particularly in gaming and metaverse real estate, as companies and individuals look to capitalize on emerging digital property markets. As the concept of virtual land becomes more mainstream, more platforms will emerge, offering a wider variety of assets and experiences to users, which will drive significant growth during this phase.
Between 2030 and 2035, the market is expected to expand from USD 4.7 billion to USD 20.9 billion, adding USD 16.2 billion. This rapid growth will be propelled by the mass adoption of virtual environments for business, entertainment, and social interaction. As virtual land becomes an integral part of the digital economy, its value will rise exponentially. Increased interest from institutional investors, coupled with advancements in AR/VR technologies, will further fuel the demand for virtual real estate, ensuring that the market will continue to grow at a remarkable pace through 2035.
| Metric | Value |
|---|---|
| Market Value (2025) | USD 1.1 billion |
| Market Forecast Value (2035) | USD 20.9 billion |
| Forecast CAGR (2025-2035) | 34.5% |
The virtual land NFT market is growing rapidly due to the increasing adoption of the metaverse and virtual worlds where users can buy, sell, and develop NFT-based virtual land. As the metaverse continues to expand, virtual real estate has become an attractive investment class, with buyers seeking ownership of exclusive digital assets. The rise in gaming, digital art, and entertainment has also contributed to the growth, as virtual land is essential for creating immersive experiences.
Additionally, blockchain technology ensures secure ownership of digital assets, which boosts investor confidence. The demand for NFTs in virtual environments is growing as more platforms offer virtual goods, and the growing interest from both retail investors and institutional players is accelerating market expansion.
Moreover, virtual land can generate revenue through leasing, advertising, and hosting events, making it a profitable asset in the digital economy. As the NFT market continues to mature, and with an increasing number of metaverse platforms emerging, the growth of the virtual land NFT market is expected to continue, as users seek to stake their claim in these digital worlds.
The virtual land NFT market is primarily divided into classification and application. By classification, the market includes metaverse & virtual goods, digital art & collectibles, games & virtual worlds, music & entertainment, sports & fan economy, social & identity authentication, and practical NFT. The metaverse & virtual goods segment holds the largest share, accounting for 30% of the market. By application, the market is split between the primary market and the secondary market, with the primary market representing the largest share at 60%. Regions such as China, India, and Germany lead the charge in terms of NFT adoption and virtual land investments.
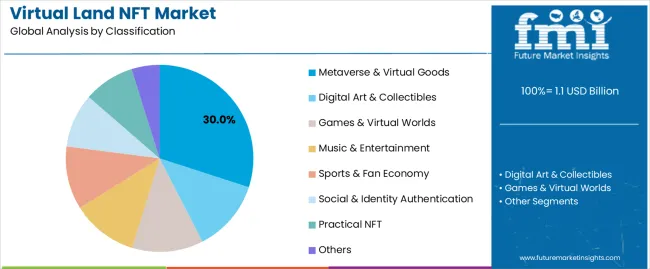
The metaverse & virtual goods segment is the dominant segment in the virtual land NFT market, holding approximately 30% of the market share. The growing interest in the metaverse and virtual reality platforms has driven a significant demand for NFT-based virtual land in virtual worlds like Decentraland, The Sandbox, and Somnium Space. These platforms allow users to buy, sell, and develop virtual real estate, making them attractive to investors, developers, and digital entrepreneurs looking to stake their claim in the emerging digital economy. The concept of virtual land as digital assets is expanding, with creators building interactive experiences, virtual stores, and entertainment venues, further driving demand. The virtual land in the metaverse provides new opportunities for revenue generation, including virtual businesses, advertising, and hosting events. As more people engage with the metaverse, the demand for NFTs representing virtual land and virtual assets is expected to grow, solidifying the segment's position as the market leader.
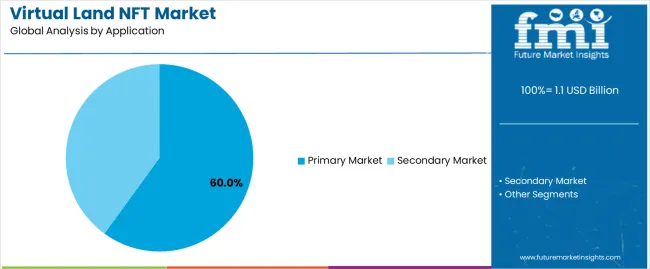
The primary market leads the virtual land NFT market, accounting for 60% of the market share. This segment involves the initial sale of virtual land NFTs directly from metaverse platforms to end consumers. The appeal of purchasing virtual land at initial sale prices has been growing as more users and investors see the potential for long-term value appreciation. Primary market sales are typically where investors first acquire digital land in NFT marketplaces such as Earth 2 and The Sandbox. The primary market allows early investors to acquire virtual land before it’s resold at a potentially higher price on the secondary market, creating opportunities for speculation and value growth. Additionally, virtual land purchased in the primary market can be developed into digital experiences or sold for profit, driving significant demand in the primary market. As the metaverse continues to evolve and grow, the primary market will remain a crucial entry point for virtual land NFT investments, fueling its market dominance.
The virtual land NFT market is growing due to increasing interest in the metaverse and virtual real estate. Platforms like Decentraland and The Sandbox are seeing significant demand for virtual land, driven by the ability to monetize digital assets through NFTs. The growing adoption of NFT technology across industries such as gaming, entertainment, and virtual goods is fueling this growth. Retail investors and institutional interest in digital assets also play a key role in driving market expansion. As blockchain technology and the metaverse continue to gain traction, the demand for virtual land and NFT-based assets is expected to rise sharply.
What are the key drivers of the virtual land NFT market?
The primary drivers of the virtual land NFT market include the growing adoption of blockchain technology, the metaverse’s rise, and the increasing demand for digital real estate. NFTs are revolutionizing how virtual assets are owned, traded, and monetized, leading to the rapid growth of virtual land marketplaces. The gamification of virtual worlds allows users to purchase, trade, and develop virtual properties, driving demand for NFT-based land. Additionally, institutional investment in NFT platforms and the growing popularity of digital art has expanded the market. As the metaverse continues to develop and gain mainstream acceptance, virtual land NFTs are expected to become increasingly valuable as part of the broader digital economy.
What are the key restraints in the virtual land NFT market?
Despite strong growth, the virtual land NFT market faces several challenges. Price volatility in the NFT market can lead to uncertainty for both investors and platform developers, making it difficult to predict the value of virtual land over time. Additionally, regulatory uncertainty surrounding NFTs and digital assets may deter potential investors due to concerns about taxation, intellectual property rights, and market regulation. The environmental impact of blockchain networks, particularly those using proof-of-work systems, has raised concerns about the sustainability of NFT platforms. These challenges could hinder broader adoption and limit market growth.
What are the key trends in the virtual land NFT market?
Key trends shaping the virtual land NFT market include the rise of metaverse platforms that allow users to buy, sell, and develop virtual land. Virtual real estate in the metaverse is becoming increasingly valuable as businesses, developers, and artists seek to claim a stake in these digital worlds. Additionally, gaming is a major driver, with virtual land becoming integral to the game economy. The rise of eco-friendly blockchain solutions is also gaining traction as the demand for energy-efficient NFTs grows. Finally, cross-platform interoperability between different metaverse projects is creating more opportunities for NFT landowners to profit from their digital assets by expanding beyond a single platform.
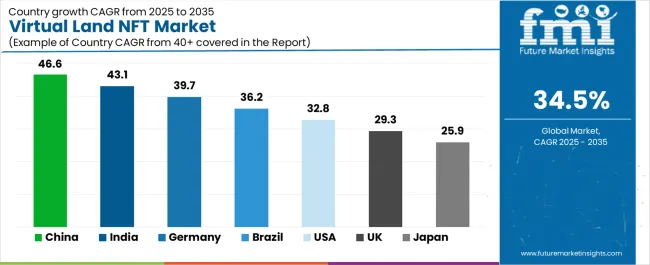
The virtual land NFT market is experiencing significant growth globally, with regions such as China, India, and Germany showing the highest growth rates due to their rapidly evolving blockchain ecosystems and increasing interest in digital assets like virtual land. Countries such as the USA and UK are also contributing to the market's expansion, primarily driven by institutional investment and metaverse adoption. China and India lead the way in terms of NFT adoption due to their large digital consumer bases and emerging virtual economies. Other regions like Brazil, Japan, and Germany are growing steadily, driven by the increasing integration of NFTs into gaming and digital art sectors.
| Country | CAGR (%) |
|---|---|
| China | 46.6 |
| India | 43.1 |
| Germany | 39.7 |
| Brazil | 36.2 |
| USA | 32.8 |
| UK | 29.3 |
| Japan | 25.9 |
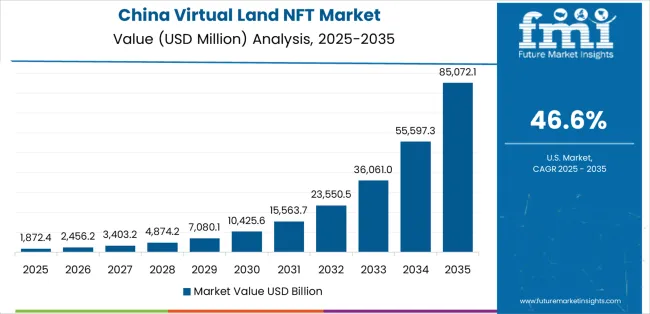
China is leading the virtual land NFT market with an impressive CAGR of 46.6%. The country’s growth is driven by its digital economy, rapid adoption of blockchain technologies, and a large base of tech-savvy consumers. As China continues to invest heavily in digital infrastructure, the demand for virtual land in metaverse platforms is increasing. NFT-based virtual real estate is gaining popularity as consumers and investors seek to claim digital spaces in the metaverse for business, entertainment, and personal use.
Platforms like Decentraland and The Sandbox are seeing significant participation from Chinese investors, eager to capitalize on the growing demand for digital property. The rise of gaming and virtual collectibles is also contributing to the growing demand for NFTs and virtual land. Moreover, China’s commitment to blockchain innovation and NFT development has spurred the growth of NFT platforms catering to virtual real estate. Despite regulatory challenges, the virtual land NFT market in China continues to thrive, with increasing institutional interest and a growing ecosystem around virtual property ownership. This rapid adoption and investment in virtual land are expected to continue as China consolidates its position as a global leader in the NFT space.
India is projected to grow at a CAGR of 43.1% in the virtual land NFT market, driven by a burgeoning interest in blockchain technology, NFTs, and digital real estate. With a large population of tech-savvy millennials and a strong entrepreneurial spirit, India is rapidly adopting NFT platforms that offer access to virtual land and digital assets. The country’s expanding gaming industry and increasing interest in virtual worlds are key factors contributing to the demand for NFT-based virtual real estate.
As platforms like Decentraland and The Sandbox gain popularity in India, more individuals and businesses are looking to purchase, develop, and monetize virtual land. Additionally, the growth of NFT marketplaces in India has made it easier for Indian investors and creators to participate in the NFT space, buying and selling virtual land and digital goods. The rise of blockchain-enabled ecosystems has facilitated this growth, offering an avenue for real estate investments in the digital world. As crypto adoption increases in India, more users are expected to invest in NFTs and virtual land as part of a broader digital asset portfolio. This trend positions India as one of the most promising markets for virtual land NFTs in the coming years.
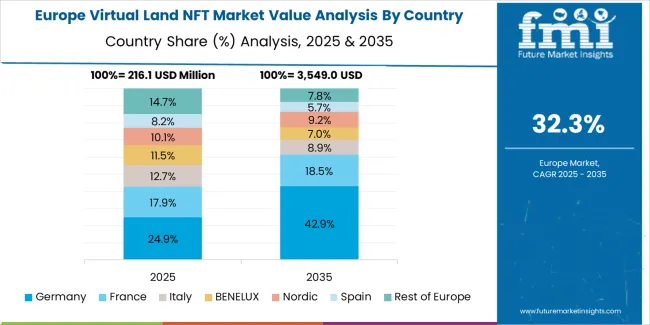
Germany is experiencing substantial growth in the virtual land NFT market, projected at a CAGR of 39.7%. The country’s well-established blockchain infrastructure and strong commitment to technology-driven industries are key factors supporting this growth. Germany has always been a hub for digital innovation, and the adoption of NFTs in the gaming and virtual real estate sectors has been growing rapidly. The demand for NFT-based virtual land is particularly high in gaming platforms, where developers are incorporating virtual real estate as part of their game economies.
Germany’s strong presence in digital art and virtual goods markets further contributes to the expansion of virtual land in the metaverse. As more German investors look to diversify their portfolios with NFTs, virtual land is becoming a popular choice for long-term investment. The rise of eco-friendly blockchain solutions is also supporting Germany’s growth in the virtual land NFT market, with more platforms focusing on reducing the environmental impact of blockchain transactions. As Germany’s blockchain technology continues to evolve, it will play a significant role in expanding the virtual land NFT market and driving adoption in Europe.
Brazil is expected to grow at a CAGR of 36.2% in the virtual land NFT market, as the country’s growing digital economy increasingly embraces NFT technology and virtual real estate. The rise of blockchain platforms and NFT marketplaces in Brazil is enabling retail investors to participate in the metaverse by purchasing and developing virtual land in popular NFT platforms. Brazil’s gaming culture and the growing adoption of digital art are also key drivers of demand for virtual land NFTs.
Brazilian creators and developers are increasingly using virtual land to build and monetize digital spaces, from virtual galleries to interactive gaming environments. Additionally, the country’s increasing access to blockchain education and crypto investments is expanding the potential market for virtual real estate. As Brazil’s NFT ecosystem continues to evolve, its strong social media presence and growing crypto adoption will further contribute to the increasing demand for NFT-based virtual land in the coming years. This makes Brazil a significant player in the global virtual land NFT market, with growing opportunities for investors, creators, and developers.
The USA is projected to grow at a CAGR of 32.8% in the virtual land NFT market, driven by its advanced blockchain infrastructure and institutional interest in NFTs and digital assets. As the leading market for NFT platforms, the USA has become a global hub for NFT-based virtual land, with significant investments pouring into platforms like Decentraland, The Sandbox, and Somnium Space. The country’s large consumer base and growing gaming industry have contributed to the increased demand for virtual real estate, particularly as the metaverse continues to expand. Additionally, USA companies and investors are taking a leading role in integrating NFTs into virtual worlds, creating interactive spaces that can be bought, sold, and developed. The NFT market in the USA has witnessed significant growth, as digital land is increasingly seen as a lucrative asset class. As blockchain adoption increases and NFT applications in virtual economies gain traction, the USA is expected to maintain its position as a key player in the global virtual land NFT market.
The UK is experiencing growth in the virtual land NFT market, projected at a CAGR of 29.3%, driven by its strong digital art community, interest in gaming, and growing focus on blockchain technology. The UK has become a major player in the NFT space, with several NFT marketplaces focused on virtual real estate and digital assets. UK investors are increasingly participating in the metaverse through NFT platforms, buying and developing virtual land for personal, commercial, and investment purposes. The increasing popularity of NFT-based art and gaming in the UK has also played a key role in the expansion of the virtual land NFT market. As blockchain innovation continues to progress, and more industries embrace NFTs in digital economies, the UK will likely continue to contribute to the overall growth of the NFT market, making it one of the most important regions for virtual land NFTs in Europe.
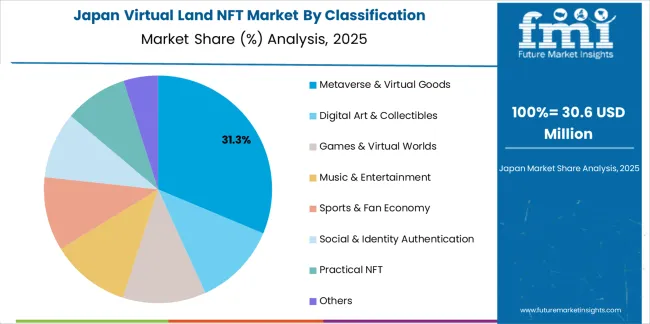
Japan is expected to grow at a CAGR of 25.9% in the virtual land NFT market, driven by its strong gaming culture, interest in digital collectibles, and the rise of blockchain technology. As one of the largest gaming markets globally, Japan has become a key player in the NFT gaming space, with virtual land playing a central role in many blockchain-based games and virtual worlds. The growing adoption of NFTs in Japan’s entertainment and gaming industries is fueling demand for virtual real estate on platforms like Decentraland and The Sandbox. The country's focus on innovative technology and digital assets has also attracted major investors looking to capitalize on the emerging metaverse economy. As Japan's interest in NFTs and blockchain continues to grow, it is expected to play a significant role in the virtual land NFT market as more consumers and creators embrace NFT-based virtual properties.
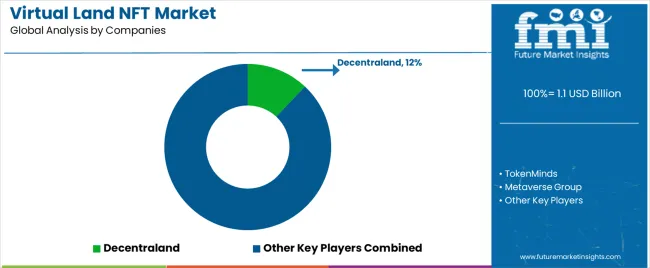
The virtual land NFT market is competitive, with major players like Decentraland, The Sandbox, and Somnium Space leading the charge in terms of market share. Decentraland holds a dominant position, providing users with a platform to buy, sell, and develop virtual land in a metaverse environment, while The Sandbox offers similar opportunities for game developers and investors. Other platforms like Earth 2, Voxels, and Metaverse Group are also competing by offering unique virtual worlds and experiences. These platforms focus on creating immersive virtual environments that allow users to monetize and develop their digital assets.
The market is also seeing the rise of regional players and niche platforms. Companies such as Gamium, LandVault, and Polygonal Mind are introducing innovative approaches to virtual land acquisition, development, and NFT trading. These platforms often focus on gamification and creating interactive experiences to drive engagement. As demand for virtual real estate continues to grow, blockchain-based solutions are gaining prominence, allowing users to invest in virtual properties that can appreciate in value. As competition intensifies, platforms that offer a seamless user experience, strong community engagement, and innovative features will continue to dominate the virtual land NFT market.
| Items | Details |
|---|---|
| Quantitative Units | USD Billion |
| Regions Covered | China, India, Germany, Brazil, USA, UK, Japan |
| Classification | Metaverse & Virtual Goods, Digital Art & Collectibles, Games & Virtual Worlds, Music & Entertainment, Sports & Fan Economy, Social & Identity Authentication, Practical NFT, Others |
| Application | Primary Market, Secondary Market |
| Key Companies Profiled | Decentraland, TokenMinds, Metaverse Group, Polygonal Mind, Twin Atlas, Gamium, LandVault, Somnium Space, Earth 2, Voxels, The Sandbox, HYTOPIA, HELIX, WorldWide Webb, NetVRK, Treeverse, Pixels |
| Additional Attributes | The market analysis includes dollar sales by classification and application categories. It also covers regional adoption trends across major markets such as China, India, Germany, and the USA The competitive landscape highlights key players in the virtual land NFT ecosystem, focusing on innovations in metaverse platforms, virtual goods, and gaming worlds. Trends in the growing demand for virtual land in metaverse environments, along with developments in primary and secondary markets, are explored. |
The global virtual land NFT market is estimated to be valued at USD 1.1 billion in 2025.
The market size for the virtual land NFT market is projected to reach USD 21.3 billion by 2035.
The virtual land NFT market is expected to grow at a 34.5% CAGR between 2025 and 2035.
The key product types in virtual land NFT market are metaverse & virtual goods, digital art & collectibles, games & virtual worlds, music & entertainment, sports & fan economy, social & identity authentication, practical NFT and others.
In terms of application, primary market segment to command 60.0% share in the virtual land NFT market in 2025.


Our Research Products

The "Full Research Suite" delivers actionable market intel, deep dives on markets or technologies, so clients act faster, cut risk, and unlock growth.

The Leaderboard benchmarks and ranks top vendors, classifying them as Established Leaders, Leading Challengers, or Disruptors & Challengers.

Locates where complements amplify value and substitutes erode it, forecasting net impact by horizon

We deliver granular, decision-grade intel: market sizing, 5-year forecasts, pricing, adoption, usage, revenue, and operational KPIs—plus competitor tracking, regulation, and value chains—across 60 countries broadly.

Spot the shifts before they hit your P&L. We track inflection points, adoption curves, pricing moves, and ecosystem plays to show where demand is heading, why it is changing, and what to do next across high-growth markets and disruptive tech

Real-time reads of user behavior. We track shifting priorities, perceptions of today’s and next-gen services, and provider experience, then pace how fast tech moves from trial to adoption, blending buyer, consumer, and channel inputs with social signals (#WhySwitch, #UX).

Partner with our analyst team to build a custom report designed around your business priorities. From analysing market trends to assessing competitors or crafting bespoke datasets, we tailor insights to your needs.
Supplier Intelligence
Discovery & Profiling
Capacity & Footprint
Performance & Risk
Compliance & Governance
Commercial Readiness
Who Supplies Whom
Scorecards & Shortlists
Playbooks & Docs
Category Intelligence
Definition & Scope
Demand & Use Cases
Cost Drivers
Market Structure
Supply Chain Map
Trade & Policy
Operating Norms
Deliverables
Buyer Intelligence
Account Basics
Spend & Scope
Procurement Model
Vendor Requirements
Terms & Policies
Entry Strategy
Pain Points & Triggers
Outputs
Pricing Analysis
Benchmarks
Trends
Should-Cost
Indexation
Landed Cost
Commercial Terms
Deliverables
Brand Analysis
Positioning & Value Prop
Share & Presence
Customer Evidence
Go-to-Market
Digital & Reputation
Compliance & Trust
KPIs & Gaps
Outputs
Full Research Suite comprises of:
Market outlook & trends analysis
Interviews & case studies
Strategic recommendations
Vendor profiles & capabilities analysis
5-year forecasts
8 regions and 60+ country-level data splits
Market segment data splits
12 months of continuous data updates
DELIVERED AS:
PDF EXCEL ONLINE
Virtual Pipeline Market Size and Share Forecast Outlook 2025 to 2035
Virtual Customer Premises Equipment Market Size and Share Forecast Outlook 2025 to 2035
Virtual Infrastructure Manager Market Size and Share Forecast Outlook 2025 to 2035
Virtual Companion Care Market Size and Share Forecast Outlook 2025 to 2035
Virtualized Radio Access Network Market Size and Share Forecast Outlook 2025 to 2035
Virtual Workspace Solutions Market Size and Share Forecast Outlook 2025 to 2035
Virtual Prototype Market Size and Share Forecast Outlook 2025 to 2035
Virtual Assistant Services Market Size and Share Forecast Outlook 2025 to 2035
Virtual Power Plant (VPP) and V2G Orchestration Market Analysis - Size, Share, and Forecast Outlook 2025 to 2035
Virtual Power Plant Market Size and Share Forecast Outlook 2025 to 2035
Virtual Machines Market by Type, by Enterprise Size, by Industry & Region Forecast till 2035
Virtual Extensible LAN (VXLAN) Market Size and Share Forecast Outlook 2025 to 2035
Virtual Private Cloud Market Size and Share Forecast Outlook 2025 to 2035
Virtual PLC and Soft PLC Market Size and Share Forecast Outlook 2025 to 2035
Virtual Private Network VPN Market Size and Share Forecast Outlook 2025 to 2035
Virtualized Evolved Packet Core (vEPC) Market Size and Share Forecast Outlook 2025 to 2035
Virtual Cards Market Size and Share Forecast Outlook 2025 to 2035
Virtual Try-On Platform Market Analysis Size and Share Forecast Outlook 2025 to 2035
Virtual Private Server Market Size and Share Forecast Outlook 2025 to 2035
Virtual Client Computing Market Size and Share Forecast Outlook 2025 to 2035

Thank you!
You will receive an email from our Business Development Manager. Please be sure to check your SPAM/JUNK folder too.
Chat With
MaRIA