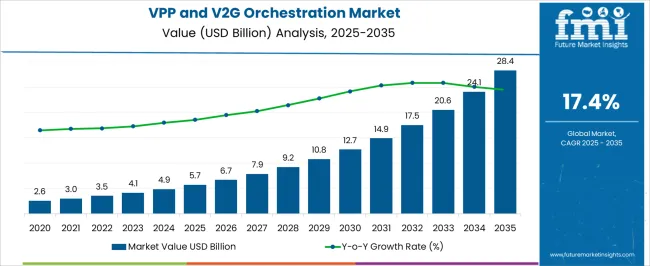
A valuation of USD 5.7 Billion is projected for the virtual power plant and V2G orchestration market in 2025, with expansion expected to reach USD 28.4 Billion by 2035. This growth reflects an absolute increase of USD 22.7 Billion across the decade, representing a compound annual growth rate (CAGR) of 17.4%. The trajectory signals a nearly five-fold enlargement in overall market size within the forecast horizon.
During the initial phase from 2025 to 2030, the market is forecast to advance from USD 5.7 Billion to USD 13 Billion, adding USD 7.3 Billion, equal to about 32% of the total decade expansion. This stage is anticipated to be shaped by regulatory enablement of distributed energy resource (DER) aggregation and increasing deployment of vehicle-to-grid capabilities. Aggregation and orchestration software, commanding a 46% share in 2025, is positioned to anchor growth momentum, while distributed solar plus storage maintains leadership with a 52% share.
In the latter half from 2030 to 2035, acceleration is expected as valuations rise from USD 13 Billion to USD 28.4 Billion, adding USD 15.4 Billion or 68% of total growth. This period is projected to be reinforced by widespread commercial and industrial facility adoption and mature vehicle-to-grid deployment. Energy storage optimization platforms and grid integration interfaces are anticipated to strengthen their contribution, supported by utility procurement and balancing market participation growing above market average.
| Metric | Value |
|---|---|
| Market Estimated Value in (2025E) | USD 5.7 Billion |
| Market Forecast Value in (2035F) | USD 28.4 Billion |
| Forecast CAGR (2025 to 2035) | 17.4% |
Between 2020 and 2024, the market expanded steadily, supported by pilot programs and early regulatory frameworks enabling DER participation in electricity markets. During this period, technology providers dominated, controlling the majority of industry revenues by leveraging software platforms and grid integration capabilities. Differentiation was largely based on aggregation algorithms, real-time optimization, and regulatory compliance, while vehicle-to-grid applications remained in demonstration phases, contributing minimally to total value.
Demand is forecast to reach USD 5.7 Billion in 2025, and the revenue structure is expected to shift as commercial applications and V2G deployment accelerate. Traditional energy companies are projected to face rising competition from technology specialists offering cloud-based orchestration platforms with advanced analytics positioning. Leading incumbents are anticipated to pivot toward integrated models by combining hardware provision, software orchestration, and market participation services to retain relevance. Emerging participants focusing on artificial intelligence-driven optimization and blockchain-enabled peer-to-peer trading are forecast to gain share, particularly in markets where regulatory sandboxes enable innovation testing.
Growth in the Virtual Power Plant and V2G Orchestration Market is being supported by grid modernization requirements and distributed energy resource proliferation across residential, commercial and industrial sectors. Regulatory frameworks enabling DER aggregation in wholesale markets are being translated into increased participation by virtual power plants in ancillary services and capacity markets.
A shift toward electrification and renewable energy integration is being reinforced by utility procurement of flexible grid services, encouraging development of sophisticated orchestration platforms. Demand for grid stability solutions, particularly during peak periods and renewable intermittency, is accelerating adoption of vehicle-to-grid technologies and demand response coordination. Electric vehicle proliferation sectors are integrating bidirectional charging capabilities for grid balancing benefits, further supporting momentum. Technological advances in artificial intelligence and machine learning are enabling greater precision in resource coordination and market participation, ensuring long-term viability of virtual power plant business models.
The market has been segmented across technology layer, resource type, and end use categories. Each segment reflects diverse deployment pathways and operational priorities driving demand across grid operators, commercial facilities, and residential prosumers. Technology layer segmentation highlights the growing prominence of aggregation and orchestration software, while energy storage optimization platforms and grid integration interfaces serve specialized applications. By resource type, distributed solar plus storage systems remain widely utilized for their reliability, though EV fleets and flexible demand loads are advancing quickly due to enhanced grid service capabilities. End use applications span utilities and grid operators, commercial and industrial facilities, and residential prosumers, each representing unique value propositions.
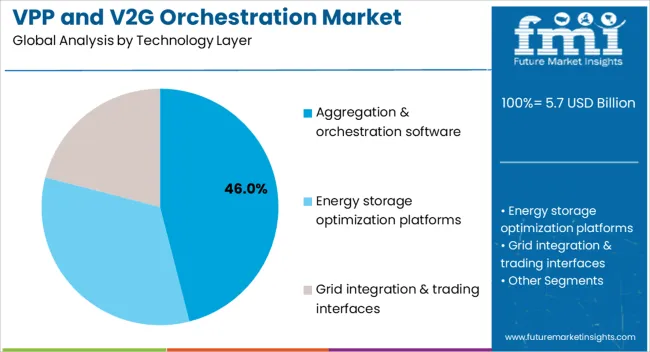
| Technology Layer | Market Value Share, 2025 |
|---|---|
| Aggregation & Orchestration Software | 46% |
| Energy Storage Optimization Platforms | 32% |
| Grid Integration & Trading Interfaces | 22% |
Aggregation and orchestration software is projected to dominate with a 46% share of the market in 2025, outpacing other technology layers due to its central role in coordinating distributed resources and optimizing market participation. Growth will be driven by utility demand for scalable platforms capable of managing thousands of distributed assets while meeting grid reliability requirements. A CAGR of 18.2% is anticipated for aggregation software through 2035, making it the leading growth engine of the category. Energy storage optimization platforms, while capturing 32% share, are expected to grow at 17.1% CAGR. Grid integration interfaces will maintain 22% share with steady 16.5% growth as standardization and interoperability requirements mature across markets.
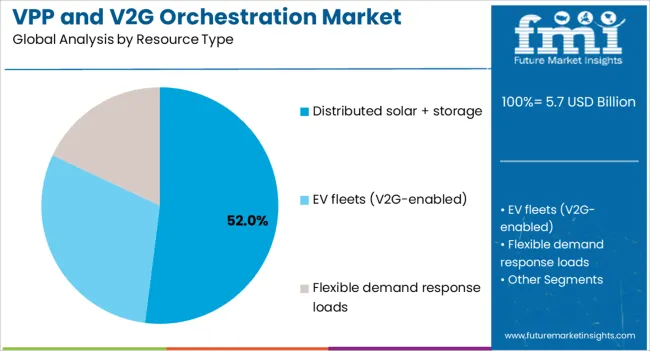
| Resource Type | Market Value Share, 2025 |
|---|---|
| Distributed Solar + Storage | 52% |
| EV Fleets (V2G-enabled) | 29% |
| Flexible Demand Response Loads | 19% |
Distributed solar plus storage systems are forecast to maintain leadership with a 52% market share in 2025, favored for their predictable generation profiles and energy storage capabilities that provide grid services. Their established deployment base and proven reliability make them preferred assets for virtual power plant operators seeking consistent revenue streams. While distributed solar plus storage dominates, EV fleets are projected to record the fastest CAGR of 19.3%, driven by expanding electric vehicle adoption and bidirectional charging infrastructure deployment. Flexible demand response loads will continue to serve specialized applications at 19% share, yet growth will remain moderate at 15.8% CAGR as industrial and commercial facilities implement automated demand management systems.
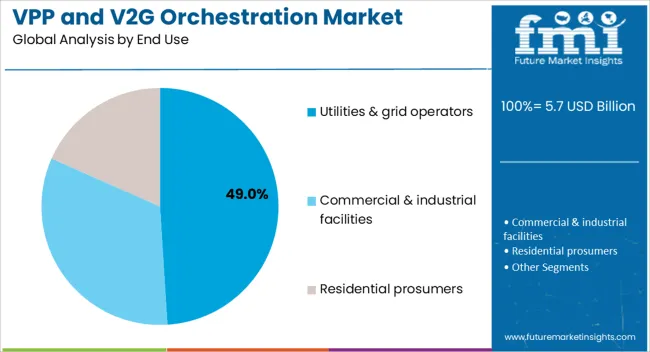
| End Use | Market Value Share, 2025 |
|---|---|
| Utilities & Grid Operators | 49% |
| Commercial & Industrial Facilities | 33% |
| Residential Prosumers | 18% |
The utilities and grid operators segment is anticipated to lead with a 49% share in 2025, supported by continuous demand for grid balancing services, frequency regulation, and capacity market participation. Procurement of virtual power plant services will sustain demand, reinforced by regulatory requirements for renewable integration and grid modernization initiatives. Commercial and industrial facilities are expected to post faster growth at a CAGR of 18.5%, particularly within energy-intensive industries seeking demand optimization and grid service revenue opportunities. Residential prosumers, though smaller at 18% share, are projected to expand at 17.9%, making them a significant growth contributor as distributed solar installations and home battery systems become more widespread.
Regulatory advancement, technology maturation, and grid modernization requirements are reshaping the Virtual Power Plant and V2G Orchestration Market. While demand response participation and renewable integration support expansion, technical complexity, market design limitations, and cybersecurity concerns introduce barriers that companies must strategically navigate through 2035.
The Virtual Power Plant and V2G Orchestration Market is being reinforced by expanding opportunities for distributed resources to participate in wholesale electricity markets and ancillary services. Grid operators increasingly require flexible resources capable of providing frequency regulation, voltage support, and capacity reserves as renewable energy penetration increases. Virtual power plants aggregate small-scale resources to meet minimum participation thresholds in these markets, creating new revenue streams for asset owners while providing grid operators with cost-effective alternatives to traditional generation and infrastructure investments. Regulatory frameworks such as FERC Order 2222 in the United States are eliminating barriers to DER participation, while similar initiatives in Europe and Asia are creating standardized market access procedures.
Market growth is being constrained by technical complexity associated with integrating diverse distributed resources under unified control systems. Different asset types, communication protocols, and control interfaces require sophisticated software platforms capable of real-time coordination while maintaining grid reliability and security. Interoperability standards remain fragmented across regions and technology vendors, creating integration challenges that increase deployment costs and limit scalability. Cybersecurity requirements add additional complexity as virtual power plants become attractive targets for malicious actors seeking to disrupt electricity supply. These technical barriers require significant investment in platform development, testing, and certification, potentially slowing market expansion among smaller participants lacking technical expertise and financial resources.
| Country | CAGR |
| Germany | 19.6% |
| USA | 18.7% |
| UK | 18.1% |
| France | 17.5% |
| Japan | 16.8% |
| South Korea | 16.1% |
| Australia | 15.4% |
A varied country trajectory is observed for the virtual power plant and V2G orchestration market, reflecting regulatory frameworks, grid modernization priorities, and distributed energy resource deployment levels. European leadership is projected to be anchored by Germany (19.6% CAGR) and the UK (18.1%), where balancing market integration and flexibility procurement schemes are accelerating virtual power plant deployment under supportive policy frameworks. France (17.5% CAGR) is anticipated to advance through demand response program expansion and renewable integration requirements.
The United States (18.7% CAGR) is expected to show strong momentum following FERC Order 2222 implementation, enabling DER aggregation in wholesale markets while state-level initiatives support pilot program scaling. In Asia, Japan (16.8% CAGR) will benefit from post-Fukushima distributed energy adoption and vehicle-to-grid demonstration projects, while South Korea (16.1% CAGR) is positioned for growth through utility-scale V2G integration and electric vehicle penetration. Australia (15.4% CAGR) represents a unique market driven by high rooftop solar penetration and state-backed virtual power plant initiatives addressing grid stability challenges.
The virtual power plant and V2G orchestration market in Germany is forecasted to grow from USD 0.97 billion in 2025 to USD 6.11 billion by 2035, reflecting a CAGR of 19.6%. Growth momentum is expected to remain strong, with annual increases ranging from 17% to 21%, demonstrating resilience across deployment phases.
Expansion is being driven by EU balancing market integration requirements and regulatory frameworks enabling distributed resource participation in capacity and ancillary service markets. Germany's renewable energy transition creates substantial demand for grid flexibility services, positioning virtual power plants as critical infrastructure for managing wind and solar variability. The country's advanced demand response programs and industrial facility participation provide a strong foundation for commercial and industrial segment growth.
Electric vehicle adoption and vehicle-to-grid infrastructure development are anticipated to accelerate through government incentives and utility procurement programs. Energy storage deployment, particularly behind-the-meter systems, will strengthen virtual power plant resource pools while providing additional revenue opportunities through market participation. By 2035, Germany is projected to maintain European leadership in virtual power plant deployment, supported by regulatory clarity and grid operator procurement strategies.
The virtual power plant and V2G orchestration market in the United States is expected to advance at a CAGR of 18.7% between 2025 and 2035. Market development is projected to accelerate following FERC Order 2222 implementation, which enables distributed energy resource aggregation to participate in wholesale electricity markets. State-level initiatives supporting demand response and grid modernization programs will reinforce adoption across utility territories.
California, Texas, and Northeast regional markets are anticipated to lead deployment due to established renewable energy targets and grid operator experience with demand response programs. Commercial and industrial facilities will drive early adoption through energy cost optimization and grid service revenue opportunities. Electric vehicle penetration and bidirectional charging infrastructure development will enable vehicle-to-grid capabilities, particularly in urban areas with aggressive electrification policies.
Utility procurement of virtual power plant services will expand as grid operators seek alternatives to traditional generation and transmission investments. Technology platform development and standardization efforts will improve interoperability while reducing deployment costs. Regional transmission organizations will play a critical role in establishing market rules and participation procedures for distributed resources.
The virtual power plant and V2G orchestration market in the UK is projected to record a CAGR of 18.1% over 2025 to 2035. Growth is expected to be driven by National Grid ESO flexibility procurement schemes and regulatory frameworks enabling distributed resource participation in balancing markets. The UK's commitment to carbon neutrality by 2050 creates substantial demand for grid flexibility services as renewable energy deployment accelerates.
Electric vehicle adoption rates among the highest globally will support vehicle-to-grid technology deployment, with government incentives encouraging bidirectional charging infrastructure installation. Commercial and industrial facilities will increasingly participate in demand response programs, leveraging automated systems to optimize energy costs while providing grid services. Residential prosumer adoption will expand through solar plus storage system deployment and time-of-use tariff structures.
Energy suppliers will integrate virtual power plant capabilities into customer offerings, creating new business models beyond traditional electricity retail. Distribution network operators will procure virtual power plant services to manage local network constraints and defer infrastructure investments. Scotland and Wales renewable energy projects will require sophisticated balancing solutions, supporting virtual power plant platform development.
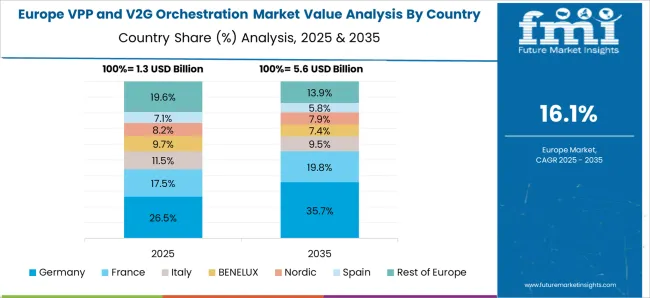
The virtual power plant and V2G orchestration market in France is forecasted to expand at a CAGR of 17.5% through 2025-2035. Market development is expected to be supported by strong demand response policy frameworks and industrial facility participation in grid balancing services. France's nuclear generation base requires flexible resources to manage load variations and renewable integration challenges.
Demand response programs targeting commercial and industrial customers will expand through RTE (grid operator) procurement initiatives and capacity market mechanisms. Electric vehicle deployment through government incentives will enable vehicle-to-grid pilot projects, particularly in urban areas with aggressive electrification targets. Energy storage system deployment will accelerate through regulatory support and utility procurement programs.
French utilities will develop virtual power plant capabilities to optimize generation portfolios while providing customers with additional value propositions. Industrial facilities with cogeneration systems and flexible loads will participate in ancillary service markets through aggregation platforms. Regional renewable energy development, particularly solar deployment, will create additional demand for grid flexibility services requiring sophisticated coordination platforms.
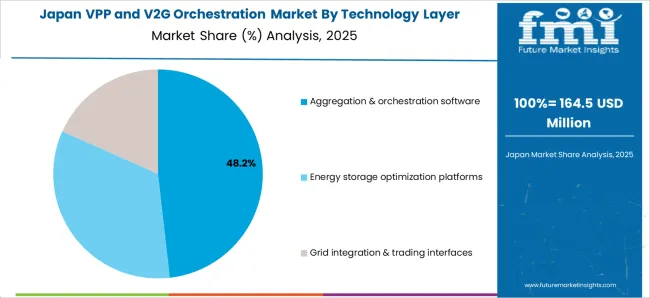
The virtual power plant and V2G orchestration market in Japan is projected at steady expansion through 2025 to 2035, with vehicle-to-grid technology development leading deployment initiatives. Post-Fukushima distributed energy resource adoption provides a strong foundation for virtual power plant growth, particularly in regions seeking energy security improvements.
Nissan-led vehicle-to-grid pilot projects demonstrate technology feasibility while establishing commercial deployment pathways for electric vehicle integration. TEPCO and regional utilities are developing virtual power plant capabilities to manage renewable integration challenges and improve grid flexibility. Industrial facilities will participate in demand response programs through automated systems capable of rapid load adjustments during peak periods.
Residential solar deployment combined with battery storage systems will create substantial distributed resource pools suitable for virtual power plant aggregation. Government initiatives supporting renewable energy expansion and grid modernization will accelerate technology adoption across utility territories. Japan's advanced manufacturing base provides opportunities for technology development and export market creation.
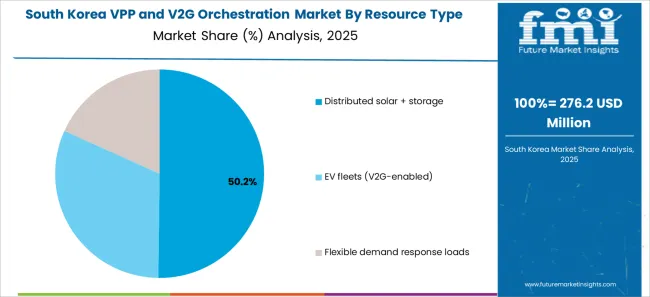
The Virtual Power Plant and V2G Orchestration Market in South Korea is expected to advance steadily between 2025 and 2035, supported by KEPCO-driven development initiatives and expanding electric vehicle penetration. Government policies supporting renewable energy deployment and grid modernization create favorable conditions for virtual power plant technology adoption.
Electric vehicle manufacturing leadership through Hyundai and Kia provides domestic technology advantages for vehicle-to-grid system development. KEPCO's smart grid initiatives will integrate distributed resources through advanced control systems and market mechanisms. Industrial facilities will participate in demand response programs to optimize energy costs while providing grid services during peak periods.
Residential solar deployment remains limited but government incentives may accelerate adoption, creating additional distributed resource opportunities for virtual power plant aggregation. Commercial building automation systems will enable sophisticated demand management capabilities supporting grid balancing requirements. Korea's advanced telecommunications infrastructure provides a strong foundation for virtual power plant communication and control systems.
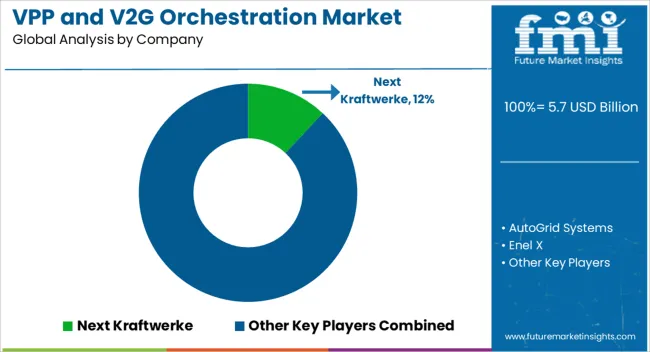
The Virtual Power Plant and V2G Orchestration Market is moderately fragmented, with technology specialists, established utilities, and emerging platform providers competing across diverse market segments. Technology leaders such as Next Kraftwerke, AutoGrid Systems, and Enel X hold significant market positions, supported by proven software platforms, extensive customer bases, and regulatory compliance capabilities. Their strategies emphasize artificial intelligence-driven optimization, multi-resource aggregation capabilities, and wholesale market participation services.
Established energy companies including Tesla, Sonnen GmbH, and ABB are leveraging hardware manufacturing capabilities and customer relationships to develop integrated virtual power plant offerings. Their approaches focus on combining energy storage systems, solar installations, and electric vehicle charging infrastructure under unified control platforms. Siemens, ENGIE, Shell Energy, and EDF Group are building virtual power plant capabilities through acquisitions and partnerships while leveraging existing utility customer relationships.
Specialized providers such as Nuvve Holding Corp. focus on vehicle-to-grid applications, developing bidirectional charging technology and grid integration software for electric vehicle fleets. Regional players concentrate on local market knowledge, regulatory compliance, and utility partnership development to establish competitive positions in specific geographical markets.
Competitive differentiation is shifting toward platform capabilities, artificial intelligence algorithms, and market access rather than individual technology components. Value creation increasingly relies on real-time optimization performance, revenue generation capabilities, and customer acquisition costs rather than hardware provision alone.
| Item | Value |
|---|---|
| Quantitative Units | Billion |
| Technology Layer | Aggregation & Orchestration Software, Energy Storage Optimization Platforms, Grid Integration & Trading Interfaces |
| Resource Type | Distributed Solar + Storage, EV Fleets (V2G-enabled), Flexible Demand Response Loads |
| End Use | Utilities & Grid Operators, Commercial & Industrial Facilities, Residential Prosumers |
| Regions Covered | North America, Europe, East Asia, South Asia & Pacific, Latin America, Middle East & Africa |
| Country Covered | Germany, United States, United Kingdom, France, Japan, South Korea, Australia |
| Key Companies Profiled | Next Kraftwerke, AutoGrid Systems, Enel X, Tesla (Autobidder/VPP), Sonnen GmbH, Nuvve Holding Corp., ABB, Siemens, ENGIE, Shell Energy, EDF Group |
| Additional Attributes | Dollar sales by solution type and deployment model, regional adoption trends, competitive landscape, buyer preferences for cloud-based versus on-premises platforms, integration with renewable energy, smart grid, and EV infrastructure, innovations in real-time energy optimization, demand-response management, predictive analytics, cybersecurity, and interoperability for scalable, flexible, and sustainable grid operations |
The global virtual power plant (VPP) and V2G orchestration market is estimated to be valued at USD 5.7 billion in 2025.
The market size for the virtual power plant (VPP) and V2G orchestration market is projected to reach USD 28.4 billion by 2035.
The virtual power plant (VPP) and V2G orchestration market is expected to grow at a 17.4% CAGR between 2025 and 2035.
The key product types in virtual power plant (VPP) and V2G orchestration market are aggregation & orchestration software, energy storage optimization platforms and grid integration & trading interfaces.
In terms of resource type, distributed solar + storage segment to command 52.0% share in the virtual power plant (VPP) and V2G orchestration market in 2025.


Full Research Suite comprises of:
Market outlook & trends analysis
Interviews & case studies
Strategic recommendations
Vendor profiles & capabilities analysis
5-year forecasts
8 regions and 60+ country-level data splits
Market segment data splits
12 months of continuous data updates
DELIVERED AS:
PDF EXCEL ONLINE
Virtual Pipeline Market Size and Share Forecast Outlook 2025 to 2035
Virtual Customer Premises Equipment Market Size and Share Forecast Outlook 2025 to 2035
Virtual Infrastructure Manager Market Size and Share Forecast Outlook 2025 to 2035
Virtual Companion Care Market Size and Share Forecast Outlook 2025 to 2035
Virtualized Radio Access Network Market Size and Share Forecast Outlook 2025 to 2035
Virtual Workspace Solutions Market Size and Share Forecast Outlook 2025 to 2035
Virtual Prototype Market Size and Share Forecast Outlook 2025 to 2035
Virtual Assistant Services Market Size and Share Forecast Outlook 2025 to 2035
Virtual Machines Market by Type, by Enterprise Size, by Industry & Region Forecast till 2035
Virtual Extensible LAN (VXLAN) Market Size and Share Forecast Outlook 2025 to 2035
Virtual Private Cloud Market Size and Share Forecast Outlook 2025 to 2035
Virtual Private Network VPN Market Size and Share Forecast Outlook 2025 to 2035
Virtualized Evolved Packet Core (vEPC) Market Size and Share Forecast Outlook 2025 to 2035
Virtual Cards Market Size and Share Forecast Outlook 2025 to 2035
Virtual Try-On Platform Market Analysis Size and Share Forecast Outlook 2025 to 2035
Virtual Private Server Market Size and Share Forecast Outlook 2025 to 2035
Virtual Client Computing Market Size and Share Forecast Outlook 2025 to 2035
Virtual Event Platforms Market Trends - Growth & Forecast 2025 to 2035
Virtual Dispersive Networking (VDN) Market Growth – Trends & Forecast 2025 to 2035
Virtual Retinal Display Market Insights - Trends & Forecast 2025 to 2035

Thank you!
You will receive an email from our Business Development Manager. Please be sure to check your SPAM/JUNK folder too.
Chat With
MaRIA