The LNG Virtual Pipeline Market is estimated to be valued at USD 1.6 billion in 2025 and is projected to reach USD 2.6 billion by 2035, registering a compound annual growth rate (CAGR) of 5.4% over the forecast period. From 2025 to 2030, the market is expected to increase gradually from USD 1.6 billion to USD 2.0 billion, indicating steady growth as virtual pipeline solutions gain traction in regions lacking traditional pipeline infrastructure. Year-on-year analysis shows incremental growth, with values remaining at USD 1.6 billion in 2026, followed by USD 1.7 billion in 2027 and USD 1.8 billion in 2028, reflecting expanding adoption in remote and off-grid areas.
By 2029, the market is forecasted to reach USD 1.9 billion and further climb to USD 2.0 billion in 2030. Growth is expected to be influenced by the need for flexible LNG transportation methods, cost-efficient distribution models, and the rising role of LNG as a transitional fuel in energy diversification strategies. The deployment of ISO-certified containers and advanced cryogenic storage solutions is anticipated to enhance operational reliability. These factors position LNG virtual pipelines as a critical component in bridging energy access gaps while supporting clean energy goals across emerging and underserved markets globally.
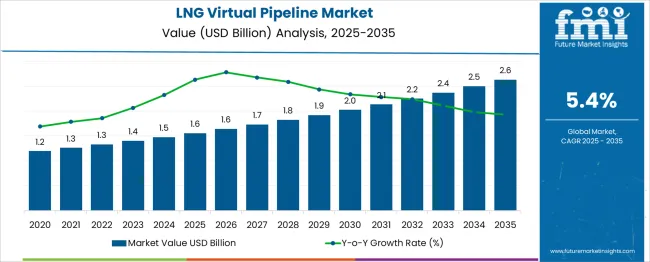
| Metric | Value |
|---|---|
| LNG Virtual Pipeline Market Estimated Value in (2025E) | USD 1.6 billion |
| LNG Virtual Pipeline Market Forecast Value in (2035F) | USD 2.6 billion |
| Forecast CAGR (2025 to 2035) | 5.4% |
The LNG virtual pipeline market occupies a specialized yet increasingly strategic position across several energy and logistics segments. In the liquefied natural gas (LNG) market, its share is around 3-4%, as large-scale LNG shipping and terminals dominate the segment. Within the natural gas distribution market, it accounts for approximately 2-3%, since pipeline networks remain the primary mode of delivery. In the energy transportation and logistics market, its contribution is about 4-5%, reflecting the role of virtual pipelines in delivering LNG to remote areas without fixed infrastructure.
The off-grid energy solutions market sees a higher share of 8-10%, as virtual pipelines provide an efficient alternative to meet energy demand in isolated regions and industrial clusters. Within the oil & gas midstream infrastructure market, its share stands at 1-2%, given the dominance of conventional pipeline and storage infrastructure.
Growth is fueled by increasing demand for flexible, cost-effective LNG transportation in regions lacking permanent pipelines, particularly for power generation, mining, and small-scale industrial users. Advances in cryogenic tank technology, modular transportation systems, and digital monitoring platforms are enhancing operational efficiency. As governments and companies aim to reduce emissions and expand natural gas accessibility, the LNG virtual pipeline market is positioned to play a pivotal role in bridging supply gaps in the global energy transition.
The LNG virtual pipeline market is advancing steadily as demand for flexible, decentralized energy supply solutions increases across industries and regions without direct pipeline access. Growth is being fueled by the rising need for cleaner alternatives to diesel and heavy fuel oil, along with regulatory pressures to reduce carbon emissions.
Companies are investing in virtual pipeline systems to reach remote or underserved areas, enabling wider adoption of LNG as a transitional fuel. Technological advancements in storage and regasification systems, combined with improvements in safety and cost efficiency, are strengthening market dynamics.
Future opportunities are expected to emerge from growing industrialization in off-grid locations, supportive government policies, and the integration of digital monitoring systems that enhance reliability and optimize logistics. The ability to deliver LNG without the constraints of fixed pipelines is paving the path for further penetration into industrial and power generation sectors.
Mode of transport, end use, and geographic regions segment the LNG virtual pipeline market. By mode of transport, the LNG virtual pipeline market is divided into Truck, Rail, Ship, and Barge. In terms of end use, the LNG virtual pipeline market is classified into Industrial, Commercial, and Transportation. Regionally, the LNG virtual pipeline industry is classified into North America, Latin America, Western Europe, Eastern Europe, Balkan & Baltic Countries, Russia & Belarus, Central Asia, East Asia, South Asia & Pacific, and the Middle East & Africa.
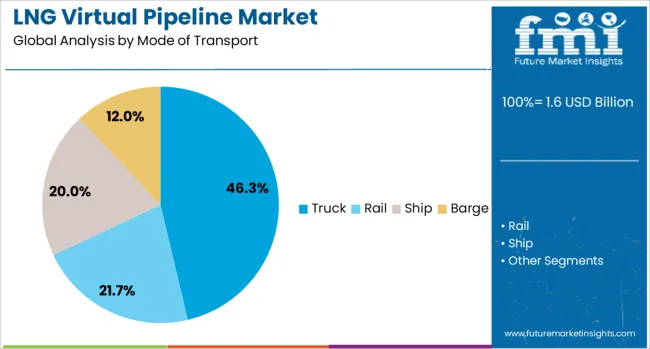
When segmented by mode of transport, the truck segment is expected to hold 46.3% of the total market revenue in 2025, making it the leading mode of transport. This leadership is being driven by its unmatched flexibility, allowing LNG to be delivered directly to end users in areas lacking permanent pipeline infrastructure.
Trucks have been increasingly utilized due to their lower capital requirements compared to rail or ships and their ability to operate effectively across varied terrains and distances. The widespread availability of road networks, combined with advancements in cryogenic tank technology, has enhanced the reliability and efficiency of truck-based LNG transport.
Operational agility and quicker deployment timelines compared to alternative modes have further contributed to this segment’s prominence. The ability to adapt routes and respond rapidly to changing demand patterns has ensured that trucks remain the preferred choice for many LNG virtual pipeline operators.
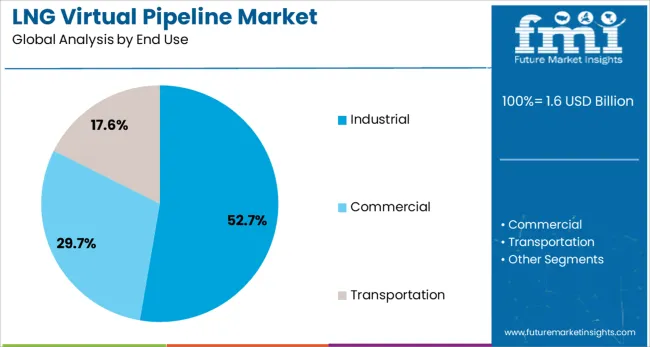
Segmenting by end use shows that the industrial sector is projected to account for 52.7% of the market revenue in 2025, establishing it as the dominant end use segment. This dominance is being reinforced by the sector’s significant energy requirements and its transition away from higher-emission fuels to meet environmental compliance goals.
Industries such as manufacturing, mining, and processing have increasingly adopted LNG delivered via virtual pipelines to reduce operational costs while lowering carbon footprints. The ability of LNG to provide a reliable, scalable, and cleaner energy source has made it particularly attractive to industrial users operating in remote locations without pipeline connectivity.
Investments in on-site regasification and storage systems have enabled seamless integration of LNG into industrial operations, further strengthening this segment’s leadership. Regulatory mandates to curtail emissions and improve energy efficiency have also supported sustained adoption within the industrial domain.
The LNG virtual pipeline market is gaining traction as a flexible alternative to fixed infrastructure in areas lacking pipeline access. In 2024, usage increased in remote power generation, industrial sites, and emergency supply operations. By 2025, higher global natural gas demand and infrastructure investments will support broader adoption. Providers offering modular liquefaction and transport solutions capable of deploying LNG supply via truck, rail, or barge are well positioned to meet diverse energy access needs.
Challenges in delivering natural gas to areas without pipeline infrastructure, such as remote industrial zones, islands, or temporary installations, have positioned virtual pipelines as a powerful alternative. In 2024, delivery to mining sites, construction camps, and isolated communities accelerated reliance on LNG trucking and barge solutions. By 2025, energy networks in underserved regions and peak-shaving applications will further adopt virtual LNG delivery to avoid high pipeline investment. These dynamics show that geographic flexibility and logistical adaptability, not conventional infrastructure, are influencing market choices. Suppliers delivering scalable LNG transport and small-scale terminal systems are gaining preference across utilities, industrial operations, and remote power users.
Use of virtual pipelines for peak demand management is emerging as a substantial opportunity for delivery providers. In 2024, industrial facilities and utilities deployed LNG-based peak shaving during periods of high gas usage to avoid supply constraints. By 2025, flexible on-demand LNG delivery via mobile units will be integrated into power and manufacturing workflows as backup energy sources. This evolution indicates that episodic supply use cases are opening commercial value. Vendors offering on-demand LNG virtual pipeline services with turnkey delivery, modular liquefaction, and rapid dispatch capabilities are poised to benefit across sectors requiring load balancing and emergency fuel support.
In 2024 and 2025 it was observed that capital-intensive infrastructure demands posed a restraint on virtual pipeline deployment. Establishing mobile LNG transport chains requires investment in cryogenic tanks, specialized compression units, and certified delivery platforms. Equipment financing becomes prohibitive for operators in developing regions and small-scale industrial users. Moreover, regulatory requirements for safety certification and hazardous material handling add compliance costs. These financial pressures were reported to delay project rollouts in remote industrial zones. Unless lower-cost deployment frameworks or financing mechanisms emerge, system accessibility remains constrained.
During 2024 and 2025, it was noted that the adoption of small-scale modular LNG transport systems was accelerating. Mobile units capable of delivering less than 50,000 GGE were deployed in off-grid power generation, mining camps, and industrial sites without pipeline access. These compact setups enabled temporary and peak-demand supply applications, especially in parts of Asia-Pacific and North America. The rise in flexible delivery models and shorter lead times highlighted modular units as cost-effective alternatives for targeted energy supply. That modular deployment model offers a clear opportunity for providers to capture demand in underserved and dynamic industrial environments.
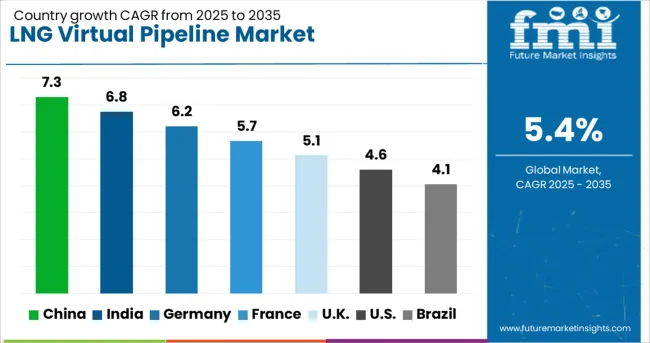
| Countries | CAGR |
|---|---|
| China | 7.3% |
| India | 6.8% |
| Germany | 6.2% |
| France | 5.7% |
| UK | 5.1% |
| USA | 4.6% |
| Brazil | 4.1% |
The global LNG virtual pipeline market is projected to grow at a CAGR of 5.4% from 2025 to 2035. China leads with 7.3%, followed by India at 6.8% and Germany at 6.2%. France records 5.7%, while the United Kingdom posts 5.1%. Growth is driven by rising demand for flexible LNG transportation, cost-effective energy distribution to off-grid areas, and government initiatives promoting cleaner fuel alternatives. China and India dominate adoption due to rapid industrial growth and energy infrastructure development, while Germany focuses on LNG as a transition fuel. France and the UK emphasize integrating LNG virtual pipelines into decarbonization strategies.
The LNG virtual pipeline market in China is forecast to grow at 7.3%, supported by strong industrial energy requirements and an extensive off-grid infrastructure network. High-capacity cryogenic trailers dominate LNG delivery to remote regions and manufacturing clusters. Manufacturers focus on improving insulation and enhancing storage technologies for long-distance transport. Government-backed clean energy policies and rapid expansion of city gas networks strengthen adoption.
The LNG virtual pipeline market in India is projected to grow at 6.8%, fueled by the government’s push for natural gas adoption and expansion of LNG-based transport infrastructure. Modular LNG containers dominate for flexible delivery to industrial clusters and rural power plants. Manufacturers develop cost-efficient, scalable storage and transfer solutions to meet diverse user requirements. Rising LNG demand in transport fleets further accelerates virtual pipeline implementation.
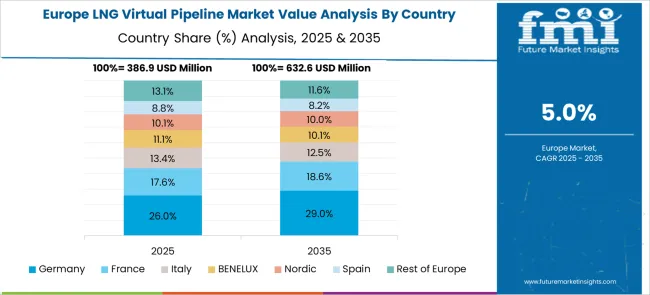
The LNG virtual pipeline market in Germany is expected to grow at 6.2%, driven by the need for low-carbon fuel alternatives in industrial and transport sectors. Cryogenic ISO containers dominate for LNG supply to decentralized energy hubs. Manufacturers integrate IoT-enabled tracking systems to monitor LNG delivery and optimize routes. Increasing focus on renewable-LNG hybrid solutions supports the country’s clean energy goals.
The LNG virtual pipeline market in France is projected to grow at 5.7%, supported by policies promoting energy diversification and emission reductions. Portable LNG transportation units dominate deployment for remote energy distribution and maritime applications. Manufacturers invest in lightweight composite materials to reduce transport costs. Strategic alliances with logistics companies enhance LNG availability for small-scale consumers.
The LNG virtual pipeline market in the UK is forecast to grow at 5.1%, driven by the shift toward cleaner fuels for industrial users and energy security goals. Small-scale LNG carriers dominate deliveries to off-grid power plants and manufacturing units. Manufacturers deploy advanced safety systems for cryogenic handling and compliance with UK energy regulations. Growth of LNG bunkering in maritime transport adds new revenue streams.
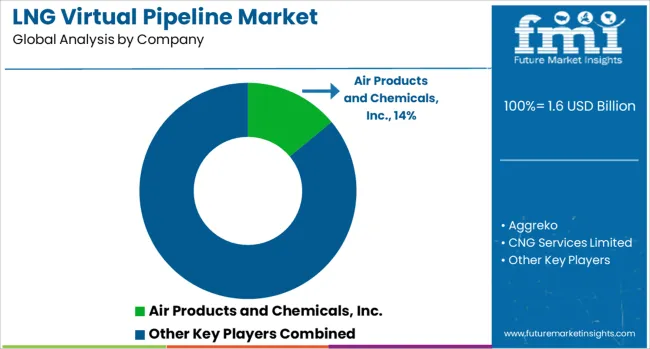
The LNG virtual pipeline market is moderately consolidated, with Air Products and Chemicals, Inc. recognized as a leading player due to its advanced cryogenic technology, robust engineering capabilities, and extensive experience in LNG logistics. The company offers integrated solutions for LNG transport and storage, making it a preferred partner for industrial and off-grid applications.
Key players include Aggreko, CNG Services Limited, FIBA Technologies, Inc., Galileo Technologies S.A., GasGrows Solutions Private Limited, Gas Malaysia Virtual Pipeline Sdn. Bhd., Gáslink - Gás Natural, S.A., Hexagon Agility, Kinder Morgan, NG Advantage LLC, Petroliam Nasional Berhad (PETRONAS), Stabilis Solutions, Inc., Snam SPA, and Xpress Natural Gas.
These companies provide modular LNG delivery systems, portable cryogenic storage, and regasification units to support sectors such as power generation, transportation, and remote energy supply. Market growth is being driven by rising LNG demand as a cleaner energy source, increasing adoption of decentralized energy systems, and the need for flexible distribution infrastructure in areas without pipeline connectivity.
Companies are investing in IoT-enabled monitoring solutions, advanced cryogenic tank designs, and scalable modular units to improve efficiency and reduce operational costs. Emerging trends include the integration of renewable energy hybrid systems and the development of small-scale LNG liquefaction for localized supply. Asia-Pacific and North America remain the fastest-growing markets due to strong industrialization and government initiatives promoting natural gas adoption.
| Item | Value |
|---|---|
| Quantitative Units | USD 1.6 Billion |
| Mode of Transport | Truck, Rail, Ship, and Barge |
| End Use | Industrial, Commercial, and Transportation |
| Regions Covered | North America, Europe, Asia-Pacific, Latin America, Middle East & Africa |
| Country Covered | United States, Canada, Germany, France, United Kingdom, China, Japan, India, Brazil, South Africa |
| Key Companies Profiled | Air Products and Chemicals, Inc., Aggreko, CNG Services Limited, FIBA Technologies, Inc., Galileo Technologies S.A., GasGrows Solutions Private Limited, Gas Malaysia Virtual Pipeline Sdn. Bhd., Gáslink - Gás Natural, S.A., Hexagon Agility, Kinder Morgan, NG Advantage LLC., Petroliam Nasional Berhad (PETRONAS), Stabilis Solutions, Inc., Snam SPA, and Xpress Natural Gas |
| Additional Attributes | Dollar sales by transport mode (truck, rail, barge), Dollar sales by end-use sector (power generation, industrial, oil & gas), regional demand trends, competitive landscape, buyer preference for flexibility over fixed pipelines, integration with modular regasification, innovations in small-scale LNG delivery systems. |
The global lng virtual pipeline market is estimated to be valued at USD 1.6 billion in 2025.
The market size for the lng virtual pipeline market is projected to reach USD 2.6 billion by 2035.
The lng virtual pipeline market is expected to grow at a 5.4% CAGR between 2025 and 2035.
The key product types in lng virtual pipeline market are truck, rail, ship and barge.
In terms of end use, industrial segment to command 52.7% share in the lng virtual pipeline market in 2025.


Our Research Products

The "Full Research Suite" delivers actionable market intel, deep dives on markets or technologies, so clients act faster, cut risk, and unlock growth.

The Leaderboard benchmarks and ranks top vendors, classifying them as Established Leaders, Leading Challengers, or Disruptors & Challengers.

Locates where complements amplify value and substitutes erode it, forecasting net impact by horizon

We deliver granular, decision-grade intel: market sizing, 5-year forecasts, pricing, adoption, usage, revenue, and operational KPIs—plus competitor tracking, regulation, and value chains—across 60 countries broadly.

Spot the shifts before they hit your P&L. We track inflection points, adoption curves, pricing moves, and ecosystem plays to show where demand is heading, why it is changing, and what to do next across high-growth markets and disruptive tech

Real-time reads of user behavior. We track shifting priorities, perceptions of today’s and next-gen services, and provider experience, then pace how fast tech moves from trial to adoption, blending buyer, consumer, and channel inputs with social signals (#WhySwitch, #UX).

Partner with our analyst team to build a custom report designed around your business priorities. From analysing market trends to assessing competitors or crafting bespoke datasets, we tailor insights to your needs.
Supplier Intelligence
Discovery & Profiling
Capacity & Footprint
Performance & Risk
Compliance & Governance
Commercial Readiness
Who Supplies Whom
Scorecards & Shortlists
Playbooks & Docs
Category Intelligence
Definition & Scope
Demand & Use Cases
Cost Drivers
Market Structure
Supply Chain Map
Trade & Policy
Operating Norms
Deliverables
Buyer Intelligence
Account Basics
Spend & Scope
Procurement Model
Vendor Requirements
Terms & Policies
Entry Strategy
Pain Points & Triggers
Outputs
Pricing Analysis
Benchmarks
Trends
Should-Cost
Indexation
Landed Cost
Commercial Terms
Deliverables
Brand Analysis
Positioning & Value Prop
Share & Presence
Customer Evidence
Go-to-Market
Digital & Reputation
Compliance & Trust
KPIs & Gaps
Outputs
Full Research Suite comprises of:
Market outlook & trends analysis
Interviews & case studies
Strategic recommendations
Vendor profiles & capabilities analysis
5-year forecasts
8 regions and 60+ country-level data splits
Market segment data splits
12 months of continuous data updates
DELIVERED AS:
PDF EXCEL ONLINE
LNG Intermediate Fluid Vaporizer (IFV) Market Size and Share Forecast Outlook 2025 to 2035
LNG Open Rack Vaporizer (ORV) Market Size and Share Forecast Outlook 2025 to 2035
LNG Liquefaction Equipment Market Size and Share Forecast Outlook 2025 to 2035
LNG Marine Gensets Market Size and Share Forecast Outlook 2025 to 2035
LNG Tank Containers Market Size and Share Forecast Outlook 2025 to 2035
LNG Bunkering Market Size and Share Forecast Outlook 2025 to 2035
LNG Terminal Market Size and Share Forecast Outlook 2025 to 2035
LNG Storage Tank Market Growth - Trends & Forecast 2025 to 2035
Floating LNG Power Vessel Market Growth – Trends & Forecast 2024-2034
Virtual Land NFT Market Size and Share Forecast Outlook 2025 to 2035
Virtual Customer Premises Equipment Market Size and Share Forecast Outlook 2025 to 2035
Virtual Infrastructure Manager Market Size and Share Forecast Outlook 2025 to 2035
Virtual Companion Care Market Size and Share Forecast Outlook 2025 to 2035
Virtualized Radio Access Network Market Size and Share Forecast Outlook 2025 to 2035
Virtual Workspace Solutions Market Size and Share Forecast Outlook 2025 to 2035
Virtual Prototype Market Size and Share Forecast Outlook 2025 to 2035
Virtual Assistant Services Market Size and Share Forecast Outlook 2025 to 2035
Virtual Power Plant (VPP) and V2G Orchestration Market Analysis - Size, Share, and Forecast Outlook 2025 to 2035
Virtual Power Plant Market Size and Share Forecast Outlook 2025 to 2035
Virtual Machines Market by Type, by Enterprise Size, by Industry & Region Forecast till 2035

Thank you!
You will receive an email from our Business Development Manager. Please be sure to check your SPAM/JUNK folder too.
Chat With
MaRIA