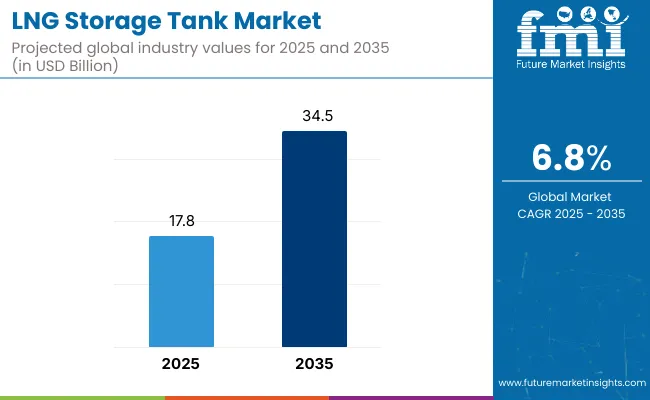
The LNG Storage Tank Market is projected to be worth USD 16.7 billion in 2024. The market is anticipated to reach USD 36.3 billion by 2034. The market is further expected to surge at a CAGR of 8.1% during the forecast period 2024 to 2034.
Key Market Trends and Highlights
Continuous innovations and advancements in LNG storage tank design, materials, and construction techniques are improving safety, efficiency, and reliability, attracting investments in new storage facilities.
Attributes | Key Insights |
---|---|
LNG Storage Tank Market Estimated Size in 2024 | USD 16.7 billion |
Projected Market Value in 2034 | USD 36.3 billion |
Value-based CAGR from 2024 to 2034 | 8.1% |
The LNG storage tank market expanded at a 10.6% CAGR between 2019 and 2023. The global market is anticipated to grow at a moderate CAGR of 8.1% over the forecast period 2024 to 2034.
The historical period witnessed a steady increase in global LNG demand driven by factors such as urbanization, industrialization, and a shift towards cleaner energy sources.
Growing investments in LNG liquefaction plants, export terminals, and regasification facilities led to increased demand for storage tanks to support the storage and transportation of LNG.
Innovations in LNG storage tank design, materials, and construction techniques enhanced safety, reliability, and efficiency, driving market growth. Countries sought to diversify their energy sources and enhance energy security, leading to investments in LNG infrastructure, including storage tanks, to ensure a stable supply of natural gas.
Increasing focus on reducing carbon emissions and mitigating climate change is expected to drive the transition towards cleaner energy sources, including LNG, supporting market growth during the forecast period.
Integration of LNG storage facilities with renewable energy sources and hybrid energy systems will support grid stability and promote the adoption of sustainable energy solutions.
Supportive government policies, incentives, and regulatory frameworks aimed at promoting LNG as a cleaner fuel and enhancing energy security will play a crucial role in driving market growth.
Continued investment in LNG infrastructure, including storage tanks, terminals, and transportation networks, will be necessary to meet growing demand and ensure reliable supply chains.
The global demand for LNG continues to rise due to its cleaner burning properties compared to other fossil fuels, and its increasing use in power generation, transportation, and industrial applications.
The construction of LNG storage tanks requires significant upfront investment, including costs associated with materials, engineering, and safety features, which can deter new entrants and project development.
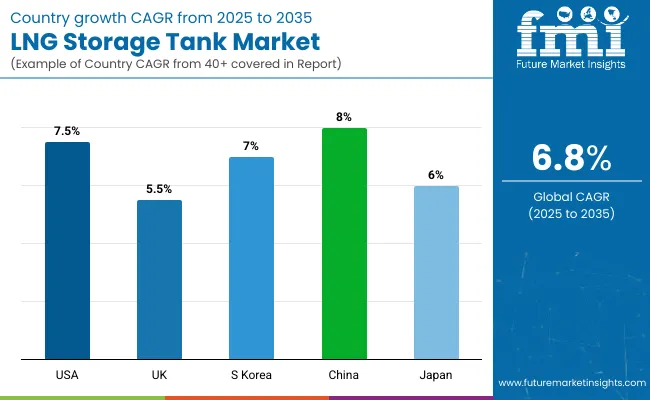
The below table showcases revenues in terms of the top 5 leading countries, spearheaded by Korea and Japan. The countries are expected to lead the market through 2034.
Countries | Forecast CAGRs from 2024 to 2034 |
---|---|
The United States | 8.3% |
The United Kingdom | 9.2% |
China | 8.7% |
Japan | 9.6% |
Korea | 10.0% |
The LNG storage tank market in the United States expected to expand at a CAGR of 8.3% through 2034. The United States has become a major LNG exporter due to the shale gas revolution and the development of LNG export terminals along the Gulf Coast.
The expansion of LNG export capacity drives the need for additional LNG storage infrastructure to support loading, storage, and distribution operations.
There is increasing domestic demand for LNG in the United States, particularly in sectors such as power generation, industrial applications, and transportation. The growing demand necessitates investments in LNG storage facilities to ensure adequate supply and storage capacity.
The LNG storage tank market in the United Kingdom is anticipated to expand at a CAGR of 9.2% through 2034. The United Kingdom is transitioning towards cleaner energy sources and reducing its reliance on traditional fossil fuels. LNG serves as a flexible and cleaner alternative, driving demand for LNG storage infrastructure, including storage tanks.
The country relies on LNG imports to meet its energy needs, especially during peak demand periods and to supplement declining domestic gas production. The expansion of LNG import terminals and storage capacity stimulates growth in the LNG storage tank market.
LNG storage tank trends in China are taking a turn for the better. An 8.7% CAGR is forecast for the country from 2024 to 2034. LNG is used in various industrial processes and residential applications, such as heating and cooking.
The expanding use of LNG in industry and households increases the demand for storage infrastructure to ensure reliable supply and distribution.
Ongoing advancements in LNG storage tank design, materials, and construction techniques improve safety, efficiency, and reliability. Technological innovations drive the adoption of advanced storage solutions to meet stringent safety and environmental standards in China.
The LNG storage tank market in Japan is poised to expand at a CAGR of 9.6% through 2034. Japan, with the prolonged shutdown of nuclear power plants, has been investing in alternative energy sources, including LNG, to fill the gap in electricity generation. The transition away from nuclear power increases the demand for LNG and storage capacity to support power generation.
The country is investing in modernizing its energy infrastructure and enhancing its resilience to natural disasters, including earthquakes and tsunamis. Robust LNG storage infrastructure plays a critical role in ensuring energy supply stability and resilience during emergencies.
The LNG storage tank market in Korea is anticipated to expand at a CAGR of 10.6% through 2034. The Korean government has been actively promoting the use of LNG as a cleaner alternative to coal and oil for power generation and industrial applications. Supportive policies, incentives, and regulations drive investment in LNG infrastructure, including storage tanks.
Korea is investing in renewable energy sources such as solar and wind power. LNG complements intermittent renewables by providing reliable backup power generation. Integration with renewable energy drives the need for flexible LNG storage solutions to support grid stability and energy transition efforts.
The below table highlights how self supporting segment is projected to lead the market in terms of product type, and is expected to account for a CAGR of 7.8% through 2034. Based on material type, the steel segment is expected to account for a CAGR of 7.6% through 2034.
Category | CAGR through 2034 |
---|---|
Self Supporting | 7.8% |
Steel | 7.6% |
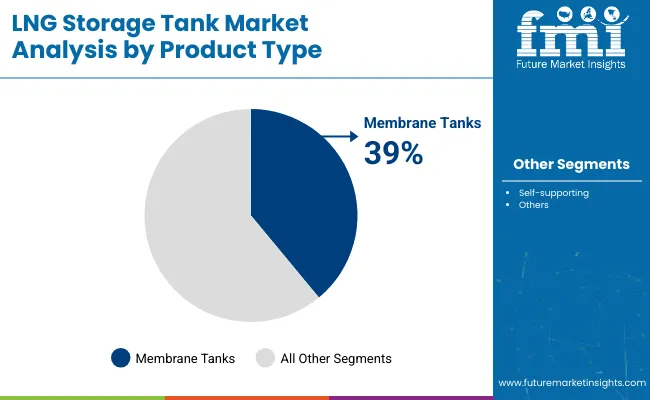
Based on product type, the self supporting segment is expected to continue dominating the LNG storage tank market. Self supporting LNG storage tanks typically offer a cost effective solution compared to other types of tanks.
The tanks often require fewer support structures and foundations, resulting in lower construction and maintenance costs.
Self supporting LNG tanks are designed to support their weight without the need for additional external support structures. The simplified construction process can lead to shorter construction times and reduced project complexities, driving efficiency and cost savings.
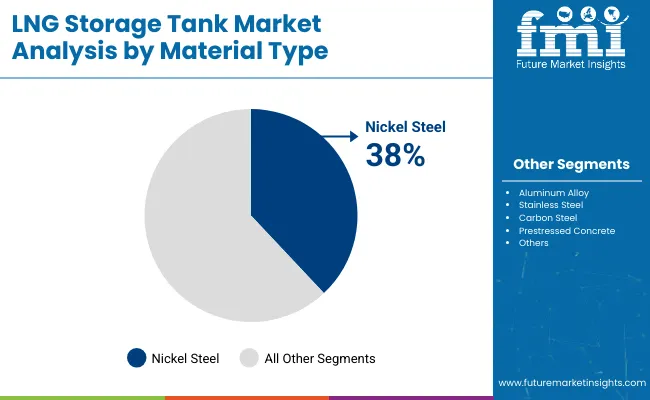
In terms of material type, the steel segment is expected to continue dominating the LNG storage tank market, attributed to several key factors. Steel is known for its high strength and durability, making it a preferred material for constructing LNG storage tanks.
Steel tanks can withstand harsh environmental conditions, seismic events, and extreme temperatures, ensuring long term reliability and safety.
Steel has a long history of use in LNG storage tank construction and has been widely adopted in the industry due to its proven performance, reliability, and structural integrity. The extensive experience and knowledge base associated with steel tanks contribute to their continued popularity in the market.
The competitive landscape of the LNG storage tank market is characterized by the presence of several global and regional players, each striving to maintain market share, innovate, and meet the evolving demands of the LNG industry.
The market landscape is influenced by factors such as technological advancements, regulatory requirements, project economics, and strategic partnerships.
Company Portfolio
Attribute | Details |
---|---|
Estimated Market Size in 2024 | USD 16.7 billion |
Projected Market Valuation in 2034 | USD 36.3 billion |
Value-based CAGR 2024 to 2034 | 8.1% |
Forecast Period | 2024 to 2034 |
Historical Data Available for | 2019 to 2023 |
Market Analysis | Value in USD billion |
Key Regions Covered | North America; Latin America; Western Europe; Eastern Europe; South Asia and Pacific; East Asia; The Middle East & Africa |
Key Market Segments Covered | Product Type, Material Type, End User Industry, Business Type, Region |
Key Countries Profiled | The United States, Canada, Brazil, Mexico, Germany, France, France, Spain, Italy, Russia, Poland, Czech Republic, Romania, India, Bangladesh, Australia, New Zealand, China, Japan, South Korea, GCC countries, South Africa, Israel |
Key Companies Profiled | Vijay Tanks and Vessels Ltd; Corban Energy Group; Luxi New Energy Equipment Group Co. Ltd; Vinci Construction; MHI Engineering and International Project India Ltd; Lloyds Energy; Transtech Energy LLC; Cryocan; Cryogas Equipment Pvt. Ltd.; Whessoe |
Table 1: Global Market Value (US$ Million) Forecast by Region, 2019 to 2034
Table 2: Global Market Volume (Units) Forecast by Region, 2019 to 2034
Table 3: Global Market Value (US$ Million) Forecast by Product Type, 2019 to 2034
Table 4: Global Market Volume (Units) Forecast by Product Type, 2019 to 2034
Table 5: Global Market Value (US$ Million) Forecast by Material Type, 2019 to 2034
Table 6: Global Market Volume (Units) Forecast by Material Type, 2019 to 2034
Table 7: Global Market Value (US$ Million) Forecast by End-user Industry, 2019 to 2034
Table 8: Global Market Volume (Units) Forecast by End-user Industry, 2019 to 2034
Table 9: Global Market Value (US$ Million) Forecast by Business Type, 2019 to 2034
Table 10: Global Market Volume (Units) Forecast by Business Type, 2019 to 2034
Table 11: North America Market Value (US$ Million) Forecast by Country, 2019 to 2034
Table 12: North America Market Volume (Units) Forecast by Country, 2019 to 2034
Table 13: North America Market Value (US$ Million) Forecast by Product Type, 2019 to 2034
Table 14: North America Market Volume (Units) Forecast by Product Type, 2019 to 2034
Table 15: North America Market Value (US$ Million) Forecast by Material Type, 2019 to 2034
Table 16: North America Market Volume (Units) Forecast by Material Type, 2019 to 2034
Table 17: North America Market Value (US$ Million) Forecast by End-user Industry, 2019 to 2034
Table 18: North America Market Volume (Units) Forecast by End-user Industry, 2019 to 2034
Table 19: North America Market Value (US$ Million) Forecast by Business Type, 2019 to 2034
Table 20: North America Market Volume (Units) Forecast by Business Type, 2019 to 2034
Table 21: Latin America Market Value (US$ Million) Forecast by Country, 2019 to 2034
Table 22: Latin America Market Volume (Units) Forecast by Country, 2019 to 2034
Table 23: Latin America Market Value (US$ Million) Forecast by Product Type, 2019 to 2034
Table 24: Latin America Market Volume (Units) Forecast by Product Type, 2019 to 2034
Table 25: Latin America Market Value (US$ Million) Forecast by Material Type, 2019 to 2034
Table 26: Latin America Market Volume (Units) Forecast by Material Type, 2019 to 2034
Table 27: Latin America Market Value (US$ Million) Forecast by End-user Industry, 2019 to 2034
Table 28: Latin America Market Volume (Units) Forecast by End-user Industry, 2019 to 2034
Table 29: Latin America Market Value (US$ Million) Forecast by Business Type, 2019 to 2034
Table 30: Latin America Market Volume (Units) Forecast by Business Type, 2019 to 2034
Table 31: Europe Market Value (US$ Million) Forecast by Country, 2019 to 2034
Table 32: Europe Market Volume (Units) Forecast by Country, 2019 to 2034
Table 33: Europe Market Value (US$ Million) Forecast by Product Type, 2019 to 2034
Table 34: Europe Market Volume (Units) Forecast by Product Type, 2019 to 2034
Table 35: Europe Market Value (US$ Million) Forecast by Material Type, 2019 to 2034
Table 36: Europe Market Volume (Units) Forecast by Material Type, 2019 to 2034
Table 37: Europe Market Value (US$ Million) Forecast by End-user Industry, 2019 to 2034
Table 38: Europe Market Volume (Units) Forecast by End-user Industry, 2019 to 2034
Table 39: Europe Market Value (US$ Million) Forecast by Business Type, 2019 to 2034
Table 40: Europe Market Volume (Units) Forecast by Business Type, 2019 to 2034
Table 41: East Asia Market Value (US$ Million) Forecast by Country, 2019 to 2034
Table 42: East Asia Market Volume (Units) Forecast by Country, 2019 to 2034
Table 43: East Asia Market Value (US$ Million) Forecast by Product Type, 2019 to 2034
Table 44: East Asia Market Volume (Units) Forecast by Product Type, 2019 to 2034
Table 45: East Asia Market Value (US$ Million) Forecast by Material Type, 2019 to 2034
Table 46: East Asia Market Volume (Units) Forecast by Material Type, 2019 to 2034
Table 47: East Asia Market Value (US$ Million) Forecast by End-user Industry, 2019 to 2034
Table 48: East Asia Market Volume (Units) Forecast by End-user Industry, 2019 to 2034
Table 49: East Asia Market Value (US$ Million) Forecast by Business Type, 2019 to 2034
Table 50: East Asia Market Volume (Units) Forecast by Business Type, 2019 to 2034
Table 51: South Asia Market Value (US$ Million) Forecast by Country, 2019 to 2034
Table 52: South Asia Market Volume (Units) Forecast by Country, 2019 to 2034
Table 53: South Asia Market Value (US$ Million) Forecast by Product Type, 2019 to 2034
Table 54: South Asia Market Volume (Units) Forecast by Product Type, 2019 to 2034
Table 55: South Asia Market Value (US$ Million) Forecast by Material Type, 2019 to 2034
Table 56: South Asia Market Volume (Units) Forecast by Material Type, 2019 to 2034
Table 57: South Asia Market Value (US$ Million) Forecast by End-user Industry, 2019 to 2034
Table 58: South Asia Market Volume (Units) Forecast by End-user Industry, 2019 to 2034
Table 59: South Asia Market Value (US$ Million) Forecast by Business Type, 2019 to 2034
Table 60: South Asia Market Volume (Units) Forecast by Business Type, 2019 to 2034
Table 61: Oceania Market Value (US$ Million) Forecast by Country, 2019 to 2034
Table 62: Oceania Market Volume (Units) Forecast by Country, 2019 to 2034
Table 63: Oceania Market Value (US$ Million) Forecast by Product Type, 2019 to 2034
Table 64: Oceania Market Volume (Units) Forecast by Product Type, 2019 to 2034
Table 65: Oceania Market Value (US$ Million) Forecast by Material Type, 2019 to 2034
Table 66: Oceania Market Volume (Units) Forecast by Material Type, 2019 to 2034
Table 67: Oceania Market Value (US$ Million) Forecast by End-user Industry, 2019 to 2034
Table 68: Oceania Market Volume (Units) Forecast by End-user Industry, 2019 to 2034
Table 69: Oceania Market Value (US$ Million) Forecast by Business Type, 2019 to 2034
Table 70: Oceania Market Volume (Units) Forecast by Business Type, 2019 to 2034
Table 71: MEA Market Value (US$ Million) Forecast by Country, 2019 to 2034
Table 72: MEA Market Volume (Units) Forecast by Country, 2019 to 2034
Table 73: MEA Market Value (US$ Million) Forecast by Product Type, 2019 to 2034
Table 74: MEA Market Volume (Units) Forecast by Product Type, 2019 to 2034
Table 75: MEA Market Value (US$ Million) Forecast by Material Type, 2019 to 2034
Table 76: MEA Market Volume (Units) Forecast by Material Type, 2019 to 2034
Table 77: MEA Market Value (US$ Million) Forecast by End-user Industry, 2019 to 2034
Table 78: MEA Market Volume (Units) Forecast by End-user Industry, 2019 to 2034
Table 79: MEA Market Value (US$ Million) Forecast by Business Type, 2019 to 2034
Table 80: MEA Market Volume (Units) Forecast by Business Type, 2019 to 2034
Figure 1: Global Market Value (US$ Million) by Product Type, 2024 to 2034
Figure 2: Global Market Value (US$ Million) by Material Type, 2024 to 2034
Figure 3: Global Market Value (US$ Million) by End-user Industry, 2024 to 2034
Figure 4: Global Market Value (US$ Million) by Business Type, 2024 to 2034
Figure 5: Global Market Value (US$ Million) by Region, 2024 to 2034
Figure 6: Global Market Value (US$ Million) Analysis by Region, 2019 to 2034
Figure 7: Global Market Volume (Units) Analysis by Region, 2019 to 2034
Figure 8: Global Market Value Share (%) and BPS Analysis by Region, 2024 to 2034
Figure 9: Global Market Y-o-Y Growth (%) Projections by Region, 2024 to 2034
Figure 10: Global Market Value (US$ Million) Analysis by Product Type, 2019 to 2034
Figure 11: Global Market Volume (Units) Analysis by Product Type, 2019 to 2034
Figure 12: Global Market Value Share (%) and BPS Analysis by Product Type, 2024 to 2034
Figure 13: Global Market Y-o-Y Growth (%) Projections by Product Type, 2024 to 2034
Figure 14: Global Market Value (US$ Million) Analysis by Material Type, 2019 to 2034
Figure 15: Global Market Volume (Units) Analysis by Material Type, 2019 to 2034
Figure 16: Global Market Value Share (%) and BPS Analysis by Material Type, 2024 to 2034
Figure 17: Global Market Y-o-Y Growth (%) Projections by Material Type, 2024 to 2034
Figure 18: Global Market Value (US$ Million) Analysis by End-user Industry, 2019 to 2034
Figure 19: Global Market Volume (Units) Analysis by End-user Industry, 2019 to 2034
Figure 20: Global Market Value Share (%) and BPS Analysis by End-user Industry, 2024 to 2034
Figure 21: Global Market Y-o-Y Growth (%) Projections by End-user Industry, 2024 to 2034
Figure 22: Global Market Value (US$ Million) Analysis by Business Type, 2019 to 2034
Figure 23: Global Market Volume (Units) Analysis by Business Type, 2019 to 2034
Figure 24: Global Market Value Share (%) and BPS Analysis by Business Type, 2024 to 2034
Figure 25: Global Market Y-o-Y Growth (%) Projections by Business Type, 2024 to 2034
Figure 26: Global Market Attractiveness by Product Type, 2024 to 2034
Figure 27: Global Market Attractiveness by Material Type, 2024 to 2034
Figure 28: Global Market Attractiveness by End-user Industry, 2024 to 2034
Figure 29: Global Market Attractiveness by Business Type, 2024 to 2034
Figure 30: Global Market Attractiveness by Region, 2024 to 2034
Figure 31: North America Market Value (US$ Million) by Product Type, 2024 to 2034
Figure 32: North America Market Value (US$ Million) by Material Type, 2024 to 2034
Figure 33: North America Market Value (US$ Million) by End-user Industry, 2024 to 2034
Figure 34: North America Market Value (US$ Million) by Business Type, 2024 to 2034
Figure 35: North America Market Value (US$ Million) by Country, 2024 to 2034
Figure 36: North America Market Value (US$ Million) Analysis by Country, 2019 to 2034
Figure 37: North America Market Volume (Units) Analysis by Country, 2019 to 2034
Figure 38: North America Market Value Share (%) and BPS Analysis by Country, 2024 to 2034
Figure 39: North America Market Y-o-Y Growth (%) Projections by Country, 2024 to 2034
Figure 40: North America Market Value (US$ Million) Analysis by Product Type, 2019 to 2034
Figure 41: North America Market Volume (Units) Analysis by Product Type, 2019 to 2034
Figure 42: North America Market Value Share (%) and BPS Analysis by Product Type, 2024 to 2034
Figure 43: North America Market Y-o-Y Growth (%) Projections by Product Type, 2024 to 2034
Figure 44: North America Market Value (US$ Million) Analysis by Material Type, 2019 to 2034
Figure 45: North America Market Volume (Units) Analysis by Material Type, 2019 to 2034
Figure 46: North America Market Value Share (%) and BPS Analysis by Material Type, 2024 to 2034
Figure 47: North America Market Y-o-Y Growth (%) Projections by Material Type, 2024 to 2034
Figure 48: North America Market Value (US$ Million) Analysis by End-user Industry, 2019 to 2034
Figure 49: North America Market Volume (Units) Analysis by End-user Industry, 2019 to 2034
Figure 50: North America Market Value Share (%) and BPS Analysis by End-user Industry, 2024 to 2034
Figure 51: North America Market Y-o-Y Growth (%) Projections by End-user Industry, 2024 to 2034
Figure 52: North America Market Value (US$ Million) Analysis by Business Type, 2019 to 2034
Figure 53: North America Market Volume (Units) Analysis by Business Type, 2019 to 2034
Figure 54: North America Market Value Share (%) and BPS Analysis by Business Type, 2024 to 2034
Figure 55: North America Market Y-o-Y Growth (%) Projections by Business Type, 2024 to 2034
Figure 56: North America Market Attractiveness by Product Type, 2024 to 2034
Figure 57: North America Market Attractiveness by Material Type, 2024 to 2034
Figure 58: North America Market Attractiveness by End-user Industry, 2024 to 2034
Figure 59: North America Market Attractiveness by Business Type, 2024 to 2034
Figure 60: North America Market Attractiveness by Country, 2024 to 2034
Figure 61: Latin America Market Value (US$ Million) by Product Type, 2024 to 2034
Figure 62: Latin America Market Value (US$ Million) by Material Type, 2024 to 2034
Figure 63: Latin America Market Value (US$ Million) by End-user Industry, 2024 to 2034
Figure 64: Latin America Market Value (US$ Million) by Business Type, 2024 to 2034
Figure 65: Latin America Market Value (US$ Million) by Country, 2024 to 2034
Figure 66: Latin America Market Value (US$ Million) Analysis by Country, 2019 to 2034
Figure 67: Latin America Market Volume (Units) Analysis by Country, 2019 to 2034
Figure 68: Latin America Market Value Share (%) and BPS Analysis by Country, 2024 to 2034
Figure 69: Latin America Market Y-o-Y Growth (%) Projections by Country, 2024 to 2034
Figure 70: Latin America Market Value (US$ Million) Analysis by Product Type, 2019 to 2034
Figure 71: Latin America Market Volume (Units) Analysis by Product Type, 2019 to 2034
Figure 72: Latin America Market Value Share (%) and BPS Analysis by Product Type, 2024 to 2034
Figure 73: Latin America Market Y-o-Y Growth (%) Projections by Product Type, 2024 to 2034
Figure 74: Latin America Market Value (US$ Million) Analysis by Material Type, 2019 to 2034
Figure 75: Latin America Market Volume (Units) Analysis by Material Type, 2019 to 2034
Figure 76: Latin America Market Value Share (%) and BPS Analysis by Material Type, 2024 to 2034
Figure 77: Latin America Market Y-o-Y Growth (%) Projections by Material Type, 2024 to 2034
Figure 78: Latin America Market Value (US$ Million) Analysis by End-user Industry, 2019 to 2034
Figure 79: Latin America Market Volume (Units) Analysis by End-user Industry, 2019 to 2034
Figure 80: Latin America Market Value Share (%) and BPS Analysis by End-user Industry, 2024 to 2034
Figure 81: Latin America Market Y-o-Y Growth (%) Projections by End-user Industry, 2024 to 2034
Figure 82: Latin America Market Value (US$ Million) Analysis by Business Type, 2019 to 2034
Figure 83: Latin America Market Volume (Units) Analysis by Business Type, 2019 to 2034
Figure 84: Latin America Market Value Share (%) and BPS Analysis by Business Type, 2024 to 2034
Figure 85: Latin America Market Y-o-Y Growth (%) Projections by Business Type, 2024 to 2034
Figure 86: Latin America Market Attractiveness by Product Type, 2024 to 2034
Figure 87: Latin America Market Attractiveness by Material Type, 2024 to 2034
Figure 88: Latin America Market Attractiveness by End-user Industry, 2024 to 2034
Figure 89: Latin America Market Attractiveness by Business Type, 2024 to 2034
Figure 90: Latin America Market Attractiveness by Country, 2024 to 2034
Figure 91: Europe Market Value (US$ Million) by Product Type, 2024 to 2034
Figure 92: Europe Market Value (US$ Million) by Material Type, 2024 to 2034
Figure 93: Europe Market Value (US$ Million) by End-user Industry, 2024 to 2034
Figure 94: Europe Market Value (US$ Million) by Business Type, 2024 to 2034
Figure 95: Europe Market Value (US$ Million) by Country, 2024 to 2034
Figure 96: Europe Market Value (US$ Million) Analysis by Country, 2019 to 2034
Figure 97: Europe Market Volume (Units) Analysis by Country, 2019 to 2034
Figure 98: Europe Market Value Share (%) and BPS Analysis by Country, 2024 to 2034
Figure 99: Europe Market Y-o-Y Growth (%) Projections by Country, 2024 to 2034
Figure 100: Europe Market Value (US$ Million) Analysis by Product Type, 2019 to 2034
Figure 101: Europe Market Volume (Units) Analysis by Product Type, 2019 to 2034
Figure 102: Europe Market Value Share (%) and BPS Analysis by Product Type, 2024 to 2034
Figure 103: Europe Market Y-o-Y Growth (%) Projections by Product Type, 2024 to 2034
Figure 104: Europe Market Value (US$ Million) Analysis by Material Type, 2019 to 2034
Figure 105: Europe Market Volume (Units) Analysis by Material Type, 2019 to 2034
Figure 106: Europe Market Value Share (%) and BPS Analysis by Material Type, 2024 to 2034
Figure 107: Europe Market Y-o-Y Growth (%) Projections by Material Type, 2024 to 2034
Figure 108: Europe Market Value (US$ Million) Analysis by End-user Industry, 2019 to 2034
Figure 109: Europe Market Volume (Units) Analysis by End-user Industry, 2019 to 2034
Figure 110: Europe Market Value Share (%) and BPS Analysis by End-user Industry, 2024 to 2034
Figure 111: Europe Market Y-o-Y Growth (%) Projections by End-user Industry, 2024 to 2034
Figure 112: Europe Market Value (US$ Million) Analysis by Business Type, 2019 to 2034
Figure 113: Europe Market Volume (Units) Analysis by Business Type, 2019 to 2034
Figure 114: Europe Market Value Share (%) and BPS Analysis by Business Type, 2024 to 2034
Figure 115: Europe Market Y-o-Y Growth (%) Projections by Business Type, 2024 to 2034
Figure 116: Europe Market Attractiveness by Product Type, 2024 to 2034
Figure 117: Europe Market Attractiveness by Material Type, 2024 to 2034
Figure 118: Europe Market Attractiveness by End-user Industry, 2024 to 2034
Figure 119: Europe Market Attractiveness by Business Type, 2024 to 2034
Figure 120: Europe Market Attractiveness by Country, 2024 to 2034
Figure 121: East Asia Market Value (US$ Million) by Product Type, 2024 to 2034
Figure 122: East Asia Market Value (US$ Million) by Material Type, 2024 to 2034
Figure 123: East Asia Market Value (US$ Million) by End-user Industry, 2024 to 2034
Figure 124: East Asia Market Value (US$ Million) by Business Type, 2024 to 2034
Figure 125: East Asia Market Value (US$ Million) by Country, 2024 to 2034
Figure 126: East Asia Market Value (US$ Million) Analysis by Country, 2019 to 2034
Figure 127: East Asia Market Volume (Units) Analysis by Country, 2019 to 2034
Figure 128: East Asia Market Value Share (%) and BPS Analysis by Country, 2024 to 2034
Figure 129: East Asia Market Y-o-Y Growth (%) Projections by Country, 2024 to 2034
Figure 130: East Asia Market Value (US$ Million) Analysis by Product Type, 2019 to 2034
Figure 131: East Asia Market Volume (Units) Analysis by Product Type, 2019 to 2034
Figure 132: East Asia Market Value Share (%) and BPS Analysis by Product Type, 2024 to 2034
Figure 133: East Asia Market Y-o-Y Growth (%) Projections by Product Type, 2024 to 2034
Figure 134: East Asia Market Value (US$ Million) Analysis by Material Type, 2019 to 2034
Figure 135: East Asia Market Volume (Units) Analysis by Material Type, 2019 to 2034
Figure 136: East Asia Market Value Share (%) and BPS Analysis by Material Type, 2024 to 2034
Figure 137: East Asia Market Y-o-Y Growth (%) Projections by Material Type, 2024 to 2034
Figure 138: East Asia Market Value (US$ Million) Analysis by End-user Industry, 2019 to 2034
Figure 139: East Asia Market Volume (Units) Analysis by End-user Industry, 2019 to 2034
Figure 140: East Asia Market Value Share (%) and BPS Analysis by End-user Industry, 2024 to 2034
Figure 141: East Asia Market Y-o-Y Growth (%) Projections by End-user Industry, 2024 to 2034
Figure 142: East Asia Market Value (US$ Million) Analysis by Business Type, 2019 to 2034
Figure 143: East Asia Market Volume (Units) Analysis by Business Type, 2019 to 2034
Figure 144: East Asia Market Value Share (%) and BPS Analysis by Business Type, 2024 to 2034
Figure 145: East Asia Market Y-o-Y Growth (%) Projections by Business Type, 2024 to 2034
Figure 146: East Asia Market Attractiveness by Product Type, 2024 to 2034
Figure 147: East Asia Market Attractiveness by Material Type, 2024 to 2034
Figure 148: East Asia Market Attractiveness by End-user Industry, 2024 to 2034
Figure 149: East Asia Market Attractiveness by Business Type, 2024 to 2034
Figure 150: East Asia Market Attractiveness by Country, 2024 to 2034
Figure 151: South Asia Market Value (US$ Million) by Product Type, 2024 to 2034
Figure 152: South Asia Market Value (US$ Million) by Material Type, 2024 to 2034
Figure 153: South Asia Market Value (US$ Million) by End-user Industry, 2024 to 2034
Figure 154: South Asia Market Value (US$ Million) by Business Type, 2024 to 2034
Figure 155: South Asia Market Value (US$ Million) by Country, 2024 to 2034
Figure 156: South Asia Market Value (US$ Million) Analysis by Country, 2019 to 2034
Figure 157: South Asia Market Volume (Units) Analysis by Country, 2019 to 2034
Figure 158: South Asia Market Value Share (%) and BPS Analysis by Country, 2024 to 2034
Figure 159: South Asia Market Y-o-Y Growth (%) Projections by Country, 2024 to 2034
Figure 160: South Asia Market Value (US$ Million) Analysis by Product Type, 2019 to 2034
Figure 161: South Asia Market Volume (Units) Analysis by Product Type, 2019 to 2034
Figure 162: South Asia Market Value Share (%) and BPS Analysis by Product Type, 2024 to 2034
Figure 163: South Asia Market Y-o-Y Growth (%) Projections by Product Type, 2024 to 2034
Figure 164: South Asia Market Value (US$ Million) Analysis by Material Type, 2019 to 2034
Figure 165: South Asia Market Volume (Units) Analysis by Material Type, 2019 to 2034
Figure 166: South Asia Market Value Share (%) and BPS Analysis by Material Type, 2024 to 2034
Figure 167: South Asia Market Y-o-Y Growth (%) Projections by Material Type, 2024 to 2034
Figure 168: South Asia Market Value (US$ Million) Analysis by End-user Industry, 2019 to 2034
Figure 169: South Asia Market Volume (Units) Analysis by End-user Industry, 2019 to 2034
Figure 170: South Asia Market Value Share (%) and BPS Analysis by End-user Industry, 2024 to 2034
Figure 171: South Asia Market Y-o-Y Growth (%) Projections by End-user Industry, 2024 to 2034
Figure 172: South Asia Market Value (US$ Million) Analysis by Business Type, 2019 to 2034
Figure 173: South Asia Market Volume (Units) Analysis by Business Type, 2019 to 2034
Figure 174: South Asia Market Value Share (%) and BPS Analysis by Business Type, 2024 to 2034
Figure 175: South Asia Market Y-o-Y Growth (%) Projections by Business Type, 2024 to 2034
Figure 176: South Asia Market Attractiveness by Product Type, 2024 to 2034
Figure 177: South Asia Market Attractiveness by Material Type, 2024 to 2034
Figure 178: South Asia Market Attractiveness by End-user Industry, 2024 to 2034
Figure 179: South Asia Market Attractiveness by Business Type, 2024 to 2034
Figure 180: South Asia Market Attractiveness by Country, 2024 to 2034
Figure 181: Oceania Market Value (US$ Million) by Product Type, 2024 to 2034
Figure 182: Oceania Market Value (US$ Million) by Material Type, 2024 to 2034
Figure 183: Oceania Market Value (US$ Million) by End-user Industry, 2024 to 2034
Figure 184: Oceania Market Value (US$ Million) by Business Type, 2024 to 2034
Figure 185: Oceania Market Value (US$ Million) by Country, 2024 to 2034
Figure 186: Oceania Market Value (US$ Million) Analysis by Country, 2019 to 2034
Figure 187: Oceania Market Volume (Units) Analysis by Country, 2019 to 2034
Figure 188: Oceania Market Value Share (%) and BPS Analysis by Country, 2024 to 2034
Figure 189: Oceania Market Y-o-Y Growth (%) Projections by Country, 2024 to 2034
Figure 190: Oceania Market Value (US$ Million) Analysis by Product Type, 2019 to 2034
Figure 191: Oceania Market Volume (Units) Analysis by Product Type, 2019 to 2034
Figure 192: Oceania Market Value Share (%) and BPS Analysis by Product Type, 2024 to 2034
Figure 193: Oceania Market Y-o-Y Growth (%) Projections by Product Type, 2024 to 2034
Figure 194: Oceania Market Value (US$ Million) Analysis by Material Type, 2019 to 2034
Figure 195: Oceania Market Volume (Units) Analysis by Material Type, 2019 to 2034
Figure 196: Oceania Market Value Share (%) and BPS Analysis by Material Type, 2024 to 2034
Figure 197: Oceania Market Y-o-Y Growth (%) Projections by Material Type, 2024 to 2034
Figure 198: Oceania Market Value (US$ Million) Analysis by End-user Industry, 2019 to 2034
Figure 199: Oceania Market Volume (Units) Analysis by End-user Industry, 2019 to 2034
Figure 200: Oceania Market Value Share (%) and BPS Analysis by End-user Industry, 2024 to 2034
Figure 201: Oceania Market Y-o-Y Growth (%) Projections by End-user Industry, 2024 to 2034
Figure 202: Oceania Market Value (US$ Million) Analysis by Business Type, 2019 to 2034
Figure 203: Oceania Market Volume (Units) Analysis by Business Type, 2019 to 2034
Figure 204: Oceania Market Value Share (%) and BPS Analysis by Business Type, 2024 to 2034
Figure 205: Oceania Market Y-o-Y Growth (%) Projections by Business Type, 2024 to 2034
Figure 206: Oceania Market Attractiveness by Product Type, 2024 to 2034
Figure 207: Oceania Market Attractiveness by Material Type, 2024 to 2034
Figure 208: Oceania Market Attractiveness by End-user Industry, 2024 to 2034
Figure 209: Oceania Market Attractiveness by Business Type, 2024 to 2034
Figure 210: Oceania Market Attractiveness by Country, 2024 to 2034
Figure 211: MEA Market Value (US$ Million) by Product Type, 2024 to 2034
Figure 212: MEA Market Value (US$ Million) by Material Type, 2024 to 2034
Figure 213: MEA Market Value (US$ Million) by End-user Industry, 2024 to 2034
Figure 214: MEA Market Value (US$ Million) by Business Type, 2024 to 2034
Figure 215: MEA Market Value (US$ Million) by Country, 2024 to 2034
Figure 216: MEA Market Value (US$ Million) Analysis by Country, 2019 to 2034
Figure 217: MEA Market Volume (Units) Analysis by Country, 2019 to 2034
Figure 218: MEA Market Value Share (%) and BPS Analysis by Country, 2024 to 2034
Figure 219: MEA Market Y-o-Y Growth (%) Projections by Country, 2024 to 2034
Figure 220: MEA Market Value (US$ Million) Analysis by Product Type, 2019 to 2034
Figure 221: MEA Market Volume (Units) Analysis by Product Type, 2019 to 2034
Figure 222: MEA Market Value Share (%) and BPS Analysis by Product Type, 2024 to 2034
Figure 223: MEA Market Y-o-Y Growth (%) Projections by Product Type, 2024 to 2034
Figure 224: MEA Market Value (US$ Million) Analysis by Material Type, 2019 to 2034
Figure 225: MEA Market Volume (Units) Analysis by Material Type, 2019 to 2034
Figure 226: MEA Market Value Share (%) and BPS Analysis by Material Type, 2024 to 2034
Figure 227: MEA Market Y-o-Y Growth (%) Projections by Material Type, 2024 to 2034
Figure 228: MEA Market Value (US$ Million) Analysis by End-user Industry, 2019 to 2034
Figure 229: MEA Market Volume (Units) Analysis by End-user Industry, 2019 to 2034
Figure 230: MEA Market Value Share (%) and BPS Analysis by End-user Industry, 2024 to 2034
Figure 231: MEA Market Y-o-Y Growth (%) Projections by End-user Industry, 2024 to 2034
Figure 232: MEA Market Value (US$ Million) Analysis by Business Type, 2019 to 2034
Figure 233: MEA Market Volume (Units) Analysis by Business Type, 2019 to 2034
Figure 234: MEA Market Value Share (%) and BPS Analysis by Business Type, 2024 to 2034
Figure 235: MEA Market Y-o-Y Growth (%) Projections by Business Type, 2024 to 2034
Figure 236: MEA Market Attractiveness by Product Type, 2024 to 2034
Figure 237: MEA Market Attractiveness by Material Type, 2024 to 2034
Figure 238: MEA Market Attractiveness by End-user Industry, 2024 to 2034
Figure 239: MEA Market Attractiveness by Business Type, 2024 to 2034
Figure 240: MEA Market Attractiveness by Country, 2024 to 2034
The LNG storage tank market is projected to reach a valuation of USD 16.7 billion in 2024.
The LNG storage tank industry is set to expand by a CAGR of 2.1% through 2034.
The LNG storage tank market is forecast to reach USD 36.3 billion by 2034.
Korea is expected to be the top performing market, exhibiting a CAGR of 10.6% through 2034.
Self supporting segment is preferred, and is expected to account for a share of 7.8% in 2024.
Explore Similar Insights
Thank you!
You will receive an email from our Business Development Manager. Please be sure to check your SPAM/JUNK folder too.