The fuel storage tank industry stands at the threshold of a decade-long expansion trajectory that promises to reshape energy infrastructure development, strategic reserve management, and advanced containment solutions. The market's journey from USD 16 billion in 2025 to USD 24.2 billion by 2035 represents substantial growth, demonstrating the accelerating adoption of advanced tank configurations and storage technology across oil and gas terminals, power generation facilities, chemical processing operations, and specialty industrial sectors.
The first half of the decade (2025-2030) will witness the market climbing from USD 16 billion to approximately USD 19.8 billion, adding USD 3.8 billion in value, which constitutes 46% of the total forecast growth period. This phase will be characterized by the rapid adoption of large-capacity above-ground storage systems, driven by increasing strategic petroleum reserve requirements and the growing need for high-specification containment infrastructure worldwide. Advanced monitoring capabilities and automated inventory management systems will become standard expectations rather than premium options.
The latter half (2030-2035) will witness sustained growth from USD 19.8 billion to USD 24.2 billion, representing an addition of USD 4.4 billion or 54% of the decade's expansion. This period will be defined by mass market penetration of specialized composite tank materials, integration with comprehensive terminal management platforms, and seamless compatibility with existing fuel distribution infrastructure. The market trajectory signals fundamental shifts in how energy companies approach safety compliance optimization and inventory efficiency management, with participants positioned to benefit from sustained demand across multiple tank types and capacity segments.
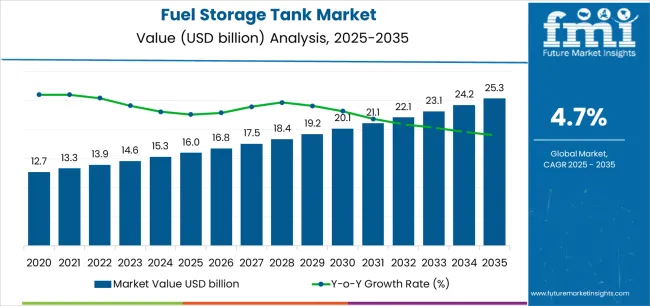
The Fuel Storage Tank market demonstrates distinct growth phases with varying market characteristics and competitive dynamics. Between 2025 and 2030, the market progresses through its infrastructure expansion phase, expanding from USD 16 billion to USD 19.8 billion with steady annual increments averaging 4.7% growth. This period showcases the transition from conventional single-wall tank designs to advanced double-wall containment systems with enhanced safety capabilities and integrated leak detection systems becoming mainstream features.
The 2025-2030 phase adds USD 3.8 billion to market value, representing 46% of total decade expansion. Market maturation factors include standardization of environmental compliance protocols, declining component costs for fiberglass and composite tank systems, and increasing industry awareness of lifecycle cost benefits reaching 80-85% operational efficiency in fuel storage applications. Competitive landscape evolution during this period features established tank manufacturers like CST Industries and McDermott expanding their material portfolios while specialty manufacturers focus on advanced coating development and enhanced corrosion resistance capabilities.
From 2030 to 2035, market dynamics shift toward advanced monitoring integration and global energy infrastructure expansion, with growth continuing from USD 19.8 billion to USD 24.2 billion, adding USD 4.4 billion or 54% of total expansion. This phase transition centers on fully automated inventory management systems, integration with comprehensive terminal operation networks, and deployment across diverse fuel types and storage scenarios, becoming standard rather than specialized applications. The competitive environment matures with focus shifting from basic containment capability to comprehensive safety optimization systems and integration with predictive maintenance platforms.
| Metric | Value |
|---|---|
| Market Value (2025) | USD 16 billion |
| Market Forecast (2035) | USD 24.2 billion |
| Growth Rate | 4.7% CAGR |
| Leading Technology | Above Ground Storage Tanks |
| Primary Application | Oil & Gas End-Use Segment |
The market demonstrates strong fundamentals with above-ground storage tank systems capturing a dominant share through advanced installation flexibility and operational accessibility capabilities. Oil and gas applications drive primary demand, supported by increasing terminal expansion and strategic reserve development requirements. Geographic expansion remains concentrated in developed energy infrastructure regions with established distribution networks, while emerging economies show accelerating adoption rates driven by refinery capacity expansion and rising fuel security standards.
Market expansion rests on three fundamental shifts driving adoption across the energy, industrial, and logistics sectors. First, strategic petroleum reserve expansion demand creates compelling national security advantages through fuel storage tanks that provide emergency supply buffers without supply chain vulnerabilities, enabling governments to maintain energy independence while maximizing supply resilience and reducing geopolitical supply risks. Second, refinery capacity modernization accelerates as energy facilities worldwide seek advanced large-capacity systems that accommodate expanding production volumes, enabling efficient product segregation that aligns with environmental regulations and operational efficiency standards.
Third, fuel distribution infrastructure drives adoption from logistics companies and terminal operators requiring effective bulk storage solutions that enable efficient inventory management while maintaining product quality during extended storage periods and multi-modal distribution operations. However, growth faces headwinds from environmental compliance challenges that vary across jurisdictions regarding the installation of underground storage tanks and secondary containment systems, which may limit adoption in environmentally sensitive locations. Capital intensity also persists regarding large-capacity tank construction and specialized foundation requirements that may reduce project feasibility in constrained budget environments and challenging site conditions, which affect infrastructure development and operational deployment.
The fuel storage tank market represents a fundamental energy infrastructure opportunity driven by expanding global refinery capacity, strategic reserve modernization, and the need for superior containment reliability in diverse fuel storage applications. As energy companies worldwide seek to achieve 80-85% storage utilization effectiveness, reduce inventory loss by 95-98%, and integrate advanced monitoring systems with real-time leak detection platforms, fuel storage tanks are evolving from basic containment infrastructure to sophisticated inventory management solutions ensuring operational safety and environmental compliance.
The market's growth trajectory from USD 16 billion in 2025 to USD 24.2 billion by 2035 at a 4.7% CAGR reflects fundamental shifts in energy security requirements and terminal efficiency optimization. Geographic expansion opportunities are particularly pronounced in Asia Pacific markets, while the dominance of above-ground storage systems (55% market share) and oil and gas applications (40% share) provides clear strategic focus areas.
Strengthening the dominant above-ground storage tank segment (55% market share) through enhanced structural designs, superior accessibility features, and modular construction systems. This pathway focuses on optimizing foundation requirements, improving inspection capabilities, extending tank lifespan to 30-40 year service cycles, and developing specialized systems for diverse fuel types. Market leadership consolidation through advanced engineering and safety integration enables premium positioning while defending competitive advantages against underground alternatives. Expected revenue pool: USD 430-570 million
Rapid refinery capacity and terminal development growth across Asia Pacific creates substantial expansion opportunities through local tank fabrication capabilities and technology transfer partnerships. Growing strategic petroleum reserve programs and government energy security initiatives drive sustained demand for large-capacity storage systems. Regional manufacturing strategies reduce transportation costs, enable faster project execution, and position companies advantageously for national infrastructure programs while accessing growing domestic markets. Expected revenue pool: USD 370-490 million
Expansion within the dominant oil and gas segment (40% market share) through specialized tank systems addressing crude oil storage standards and refined product segregation requirements. This pathway encompasses floating roof designs, vapor recovery integration, and compatibility with diverse terminal operation processes. Premium positioning reflects superior operational reliability and comprehensive safety compliance supporting modern refinery operations, product terminals, and distribution hub applications. Expected revenue pool: USD 320-420 million
Strategic advancement in above 10,001-gallon capacity segment adoption (50% market share) requires enhanced fabrication capabilities and specialized transportation infrastructure addressing major storage requirements. This pathway addresses bulk terminal operations, strategic petroleum reserves, and high-volume applications with advanced construction technology for demanding structural integrity conditions. Premium pricing reflects engineering complexity and operational capacity optimization through economies of scale. Expected revenue pool: USD 280-370 million
Strengthening the leading carbon steel segment (38% material share) through enhanced coating systems, corrosion-resistant treatments, and welding technology optimization. This pathway encompasses advanced surface preparation, cathodic protection integration, and lifecycle extension programs for conventional steel tank applications. Technology differentiation through proprietary coating systems enables competitive positioning while maintaining cost advantages for large-scale storage projects. Expected revenue pool: USD 250-330 million
Expansion targeting underground storage applications (35% tank type share) through double-wall construction, leak detection integration, and environmental protection systems. This pathway encompasses corrosion-resistant materials, secondary containment, and monitoring technology for retail fuel stations and industrial facilities. Market development through compliance-focused engineering enables differentiated positioning while accessing regulated retail and commercial markets requiring environmental safeguards. Expected revenue pool: USD 220-290 million
Development of advanced non-metallic tank systems (22% fiberglass share) addressing corrosion elimination and lightweight construction requirements. This pathway encompasses fiber-reinforced polymer construction, chemical resistance optimization, and specialized applications for aggressive fuel types. Premium positioning reflects corrosion-free performance and reduced maintenance requirements while enabling access to challenging chemical storage environments. Expected revenue pool: USD 190-250 million
Primary Classification: The market segments by tank type into Above Ground, Underground, and Mobile Tanks categories, representing the evolution from basic fixed storage infrastructure to specialized portable solutions for comprehensive fuel management optimization.
Secondary Classification: End-use segmentation divides the market into Oil & Gas, Power Plants, Chemical, Transportation & Logistics, Mining, Agriculture, Military & Defense, and Commercial sectors, reflecting distinct requirements for storage capacity, containment standards, and operational safety protocols.
Tertiary Classification: Material segmentation covers Carbon Steel, Stainless Steel, Fiberglass, Aluminum, and Other materials, with steel alloys leading adoption while composite materials show accelerating growth patterns driven by corrosion resistance programs.
Quaternary Classification: Capacity segmentation includes Above 10,001 gallons, 1,001-10,000 gallons, and Up to 1,000 gallons ranges, with large-capacity systems dominating bulk storage applications while smaller tanks serve specialized distribution requirements.
The segmentation structure reveals technology progression from conventional carbon steel construction toward specialized composite materials with enhanced environmental protection and monitoring capabilities, while application diversity spans from strategic petroleum reserves to retail fuel distribution requiring advanced containment solutions.
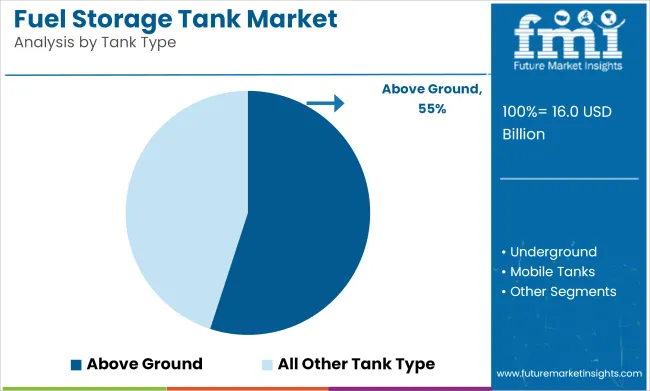
Market Position: Above-ground storage tank systems command the leading position in the Fuel Storage Tank market with approximately 55% market share through advanced installation advantages, including superior accessibility, simplified inspection procedures, and operational flexibility that enable energy facilities to achieve optimal fuel management across diverse terminal and refinery environments.
Value Drivers: The segment benefits from operator preference for visible storage systems that provide straightforward maintenance access, reduced excavation costs, and structural modification capability without requiring extensive site preparation. Advanced structural features enable floating roof designs, vapor recovery integration, and compatibility with existing terminal infrastructure, where inspection accessibility and operational visibility represent critical safety requirements.
Competitive Advantages: Above-ground storage tank systems differentiate through proven installation efficiency, optimal cost-to-capacity ratios, and integration with loading rack infrastructure that enhance operational effectiveness while maintaining construction costs suitable for diverse storage applications and project budgets.
Key market characteristics:
Underground storage tank systems maintain significant market presence (35% share) due to their space-saving advantages, environmental protection benefits, and suitability for retail fuel station applications requiring concealed storage. Mobile tank systems capture specialized portions (10% share) through transportable fuel distribution, emergency response applications, and temporary storage requirements.
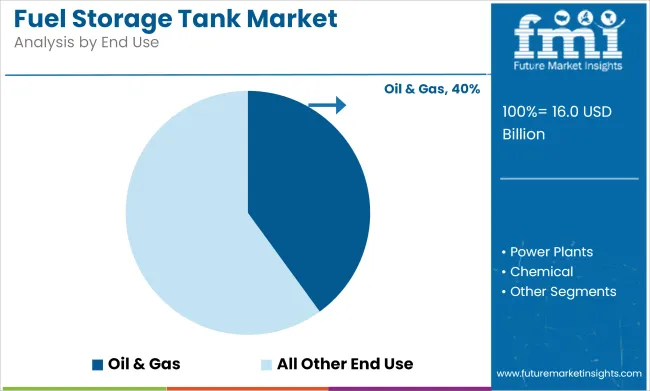
Market Context: Oil and gas applications dominate the Fuel Storage Tank market with approximately 40% market share due to widespread adoption in refinery operations and increasing focus on crude oil storage, refined product segregation, and terminal distribution applications that maximize inventory management while maintaining product quality standards.
Appeal Factors: Energy companies prioritize tank structural integrity, operational capacity, and integration with existing terminal infrastructure that enables coordinated distribution operations across multiple storage facilities. The segment benefits from substantial refinery expansion investment and strategic petroleum reserve programs that emphasize the acquisition of large-capacity systems for crude oil receiving, intermediate product storage, and finished product distribution applications.
Growth Drivers: Refinery capacity expansion programs incorporate specialized fuel storage tanks as essential infrastructure for production volume increases, while strategic petroleum reserve development increases demand for bulk storage capabilities that comply with national energy security standards and optimize supply resilience.
Market Challenges: Volatile crude oil prices and energy transition uncertainties may create cyclical investment patterns affecting tank construction timelines.
Application dynamics include:
Power plant operations maintain substantial tank requirements (14% share) through fuel oil storage for backup generation, diesel reserves for emergency systems, and auxiliary fuel applications. Chemical manufacturing facilities capture significant portions (12% share) requiring specialized storage for feedstock materials, process fuels, and chemical intermediates demanding corrosion-resistant construction.
Growth Accelerators: Strategic petroleum reserve expansion drives primary adoption as fuel storage tanks provide national energy security capabilities that enable governments to maintain supply resilience during supply disruptions without excessive import dependency, supporting energy independence requirements and economic stability missions that demand large-scale storage infrastructure. Refinery capacity modernization demand accelerates market growth as energy facilities seek expanded storage systems that accommodate increased production volumes while maintaining product segregation during complex refining operations and distribution scheduling. Energy infrastructure investment spending increases worldwide, creating sustained demand for terminal storage tanks that complement port facility expansion, pipeline network development, and distribution logistics processes providing operational flexibility in diverse energy supply environments.
Growth Inhibitors: Environmental compliance complexity varies across regulatory jurisdictions regarding underground storage tank installation and secondary containment requirements, which may limit project approvals and market penetration in environmentally sensitive regions or restrictive regulatory environments. Capital intensity persists regarding large-capacity tank construction, specialized foundation engineering, and quality assurance procedures that may reduce project economics in constrained budget conditions, challenging site geology, or accelerated construction schedules, affecting infrastructure development and investment feasibility. Market cyclicality across petroleum industry investment cycles and energy price volatility creates demand fluctuations between different market conditions and project financing availability.
Market Evolution Patterns: Adoption accelerates in large-scale terminal projects and strategic reserve applications where capacity requirements justify specialized construction costs, with geographic concentration in coastal refining regions transitioning toward mainstream adoption in emerging economies driven by energy security programs and infrastructure investment initiatives. Technology development focuses on enhanced monitoring systems, improved coating technologies, and integration with terminal automation platforms that optimize inventory management and leak detection. The market could face disruption if alternative energy storage methods or distributed fuel systems significantly limit the deployment of centralized bulk storage infrastructure in petroleum distribution applications, though the industry's fundamental need for buffer inventory and supply flexibility continues to make large-capacity storage tanks irreplaceable in energy logistics.
The fuel storage tank market demonstrates varied regional dynamics with Growth Leaders including China (6.5% CAGR) and India (6.4% CAGR) driving expansion through strategic reserve additions and refinery capacity development programs. Strong Performers encompass Japan (4.9% CAGR), Saudi Arabia (4.8% CAGR), and the United Kingdom (4.7% CAGR), benefiting from established energy infrastructure and terminal modernization investment. Steady Markets feature Brazil (4.2% CAGR) and the United States (3.5% CAGR), where infrastructure optimization and selective capacity additions support consistent growth patterns.
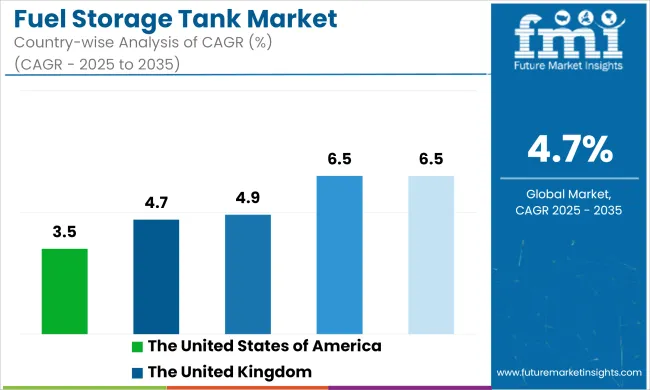
| Country | CAGR (2025-2035) |
|---|---|
| China | 6.5% |
| India | 6.4% |
| Japan | 4.9% |
| Saudi Arabia | 4.8% |
| United Kingdom | 4.7% |
| Brazil | 4.2% |
| United States | 3.5% |
Regional synthesis reveals Asia Pacific markets leading adoption through refinery expansion acceleration and strategic reserve infrastructure development, while Middle Eastern countries maintain strong growth supported by export terminal capacity programs. North American and European markets show moderate expansion driven by terminal modernization and compliance upgrade trends.
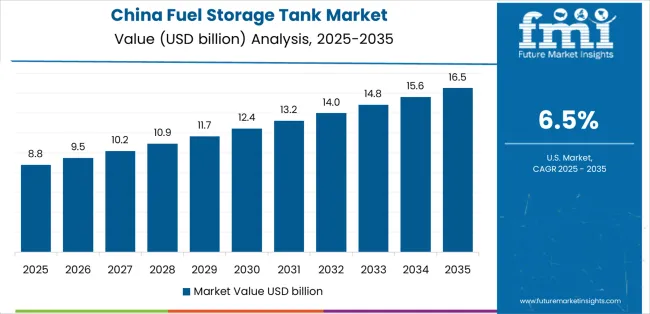
China leads growth momentum with a 6.5% CAGR, driven by strategic petroleum reserve expansions, new refinery construction intensification, and coastal terminal development across major industrial provinces including Shandong, Liaoning, Guangdong, and Zhejiang. National strategic petroleum reserve programs and commercial crude oil storage capacity additions drive primary tank demand, while growing refined product distribution networks support terminal infrastructure procurement. Government energy security investment through national reserve base construction, refining capacity expansion policies, and petrochemical integration initiatives support sustained expansion.
The convergence of energy security priorities, refining industry consolidation through mega-refinery development, and import terminal infrastructure expansion positions China as a key growth market for fuel storage tanks. Coastal refining clusters including Zhejiang petrochemical base and integrated refining-chemical complexes accelerate tank construction, while environmental regulation enforcement drives replacement of aging storage facilities with modern double-wall systems meeting safety compliance requirements.
Performance Metrics:
India demonstrates strong expansion at 6.4% CAGR through new refinery commissioning, product storage infrastructure development, and rapid city-gas distribution depot buildout across major states including Gujarat, Maharashtra, Uttar Pradesh, and Rajasthan. Refinery capacity additions through greenfield projects and brownfield expansions drive primary storage tank demand, while growing petroleum product distribution networks support depot infrastructure development. Government energy access programs through city gas distribution licensing, strategic petroleum reserve construction, and fuel retail network expansion support sustained tank procurement.
The market benefits from refinery projects including Ratnagiri refinery development plans, existing refinery expansions, and petroleum product pipeline terminal construction requiring comprehensive storage infrastructure. City gas distribution network expansion and compressed natural gas station development create additional demand for specialized fuel storage systems.
Market Intelligence Brief:
Japan's advanced energy market demonstrates sophisticated fuel storage infrastructure with documented operational effectiveness in LNG import terminals, petroleum product distribution, and strategic reserve facilities through integration with comprehensive safety systems and monitoring infrastructure. The country leverages engineering expertise in tank construction technology and seismic design to maintain steady expansion at 4.9% CAGR. Coastal regions including Tokyo Bay, Osaka Bay, and Nagoya showcase premium installations where fuel storage tanks integrate with comprehensive terminal automation platforms and disaster preparedness systems to optimize inventory management and supply resilience. Japanese energy facilities prioritize seismic resistance, operational safety, and environmental compliance, creating demand for high-specification tanks with advanced features including earthquake-resistant foundation designs and automated leak detection systems.
LNG storage capacity additions supporting fuel diversification and energy security drive sustained demand, while emerging hydrogen and ammonia fuel infrastructure creates opportunities for specialized cryogenic and chemical-resistant storage systems. Petroleum product terminal modernization programs address aging infrastructure replacement requirements.
Strategic Market Indicators:
The UK market emphasizes fuel storage infrastructure modernization with documented operational effectiveness in LNG import capacity upgrades and petroleum terminal refurbishment programs at 4.7% CAGR. The country focuses on energy security enhancement through import terminal capacity expansion, strategic storage optimization, and distribution network resilience improvement supporting supply chain reliability. British energy facilities prioritize import infrastructure development with LNG regasification terminal expansion projects and petroleum product terminal upgrades addressing post-Brexit supply chain considerations and energy security requirements.
LNG import terminal development including new regasification capacity and storage tank construction drives sustained demand for specialized cryogenic containment systems. Petroleum product terminal modernization programs address aging tank infrastructure replacement and environmental compliance upgrades at established distribution facilities.
Performance Metrics:
Saudi Arabia maintains strong growth at 4.8% CAGR through crude-to-chemicals project development, export terminal storage expansion, and integrated refining-petrochemical complex construction. Major energy companies including Saudi Aramco develop comprehensive storage infrastructure for crude oil export terminals, refined product distribution, and petrochemical feedstock handling. Crude-to-chemicals initiatives including direct crude oil to chemical conversion projects require specialized storage systems for diverse hydrocarbon fractions and chemical intermediates.
Export terminal capacity expansion programs addressing growing Asian market demand drive large-capacity crude oil storage tank construction at Red Sea and Arabian Gulf coastal facilities. Integrated refining-petrochemical complexes require comprehensive tank farms for crude receiving, intermediate product storage, and finished product distribution applications.
Market Characteristics:
Brazil maintains steady expansion at 4.2% CAGR through coastal terminal infrastructure development, biofuels storage capacity additions, and midstream network densification. Pre-salt offshore production growth drives crude oil terminal storage requirements at coastal receiving facilities, while expanding ethanol and biodiesel production creates specialized storage demand for renewable fuel distribution. Petroleum product distribution network expansion addresses growing domestic consumption and import infrastructure requirements.
Coastal terminal construction supporting offshore oil production and petroleum product imports drives large-capacity storage tank procurement. Biofuels storage infrastructure including ethanol terminals and biodiesel distribution depots creates opportunities for specialized tank systems compatible with renewable fuel characteristics.
Performance Metrics:
The USA market emphasizes advanced fuel storage features, including comprehensive leak detection and integration with terminal automation platforms that manage inventory optimization, safety monitoring, and logistics coordination through unified terminal management systems. The country demonstrates moderate growth at 3.5% CAGR driven by terminal optimization programs, product hub development, and selective renewable fuel and LNG tank projects supporting infrastructure modernization. American terminal operators prioritize operational efficiency with storage tanks delivering reliable containment through advanced construction standards and comprehensive monitoring capabilities. Infrastructure deployment channels include independent terminal operators, integrated oil companies, and fuel logistics providers that support storage installations for complex distribution networks and multi-modal transportation hubs.
Petroleum product distribution hub development in strategic locations including Gulf Coast, Midwest, and East Coast regions drives steady tank procurement. Renewable diesel and sustainable aviation fuel infrastructure creates emerging opportunities for specialized storage systems compatible with advanced biofuels.
Strategic Development Indicators:
South Africa's energy market focuses on petroleum product distribution and strategic fuel reserve maintenance with system requirements for national energy security and commercial distribution networks. Coastal import terminals in Durban, Cape Town, and other ports require storage infrastructure for petroleum product receiving and distribution. Strategic fuel reserves managed by government entities require maintenance and periodic tank replacement ensuring supply continuity during potential supply disruptions.
Petroleum product distribution networks serving inland regions require depot storage infrastructure supporting truck loading and pipeline distribution operations. Mining industry fuel supply systems create additional demand for diesel storage tanks at remote mining operations.
Performance Metrics:
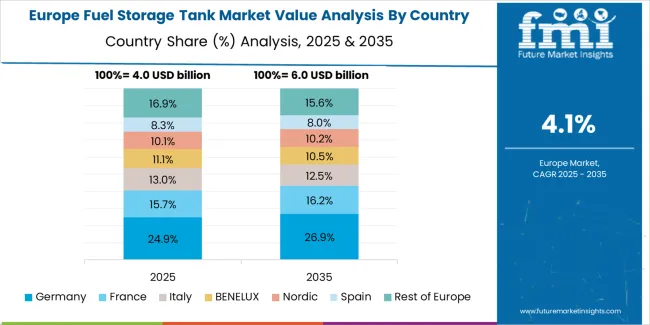
The fuel storage tank market in Europe is projected to grow from USD 4.3 billion in 2025 to USD 6.1 billion by 2035, registering a CAGR of approximately 3.5% over the forecast period. Germany is expected to maintain its leadership position with approximately 21% market share in 2025, supported by chemical processing industry upgrades and petroleum product terminal modernization programs across major industrial regions.
The United Kingdom follows with approximately 16% share in 2025, driven by LNG import capacity upgrades and terminal modernization initiatives enhancing energy security. France holds approximately 13% share through food processing facility investments and refinery infrastructure maintenance programs. Italy commands approximately 12% share, supported by coastal terminal operations and petrochemical storage infrastructure. Spain accounts for approximately 9% share, aided by petroleum product distribution networks and Mediterranean coastal terminal facilities. The Nordic region holds approximately 11% share through district heating fuel storage and petroleum product terminal operations. Benelux countries account for approximately 8% share with Rotterdam terminal complex and regional distribution infrastructure. Eastern Europe represents approximately 10% share, reflecting steady adoption across refinery operations and strategic petroleum reserve programs.
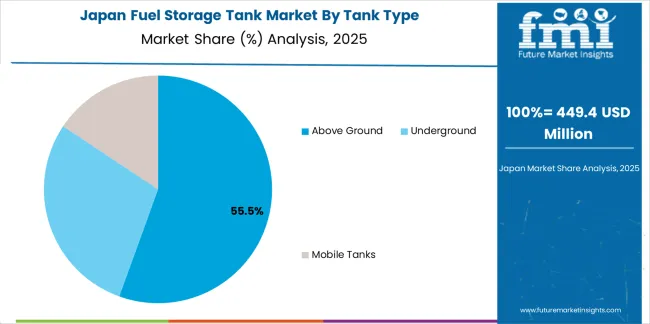
Japan demonstrates specialized market characteristics focused on seismic-resistant fuel storage infrastructure and advanced engineering quality preferences that emphasize earthquake resilience, operational reliability, and comprehensive safety monitoring systems. The Japanese market focuses on LNG import terminal storage additions supporting fuel diversification strategies, petroleum product distribution depot maintenance, and emerging hydrogen and ammonia fuel pilot projects requiring cryogenic and chemical-resistant containment specifications that reflect the country's renowned engineering excellence standards. Fuel storage tank procurement emphasizes technological sophistication, integration with comprehensive safety management systems, and long-term structural durability requirements that align with Japanese infrastructure quality expectations. The market benefits from domestic tank manufacturers maintaining strong construction technology capabilities, while international suppliers provide specialized solutions for LNG cryogenic storage and alternative fuel applications requiring advanced materials and monitoring features.
Market Development Factors:
South Korea demonstrates advanced market characteristics focused on semiconductor and battery manufacturing facility fuel storage, hyperscale data center backup power systems, and smart factory energy infrastructure with sophisticated monitoring systems and comprehensive automation features. The Korean market emphasizes industrial complex fuel distribution, petrochemical facility storage requirements, and technology sector emergency generator fuel systems requiring high-specification storage tanks with advanced leak detection capabilities and inventory management features. Korean industrial facilities and energy companies prioritize automation integration, predictive maintenance programs, and digital transformation initiatives that reflect the country's leadership in industrial technology adoption and smart infrastructure systems. The market benefits from government support for industrial facility modernization, energy security programs, and technology development initiatives supporting infrastructure upgrades and operational efficiency improvements.
Strategic Development Indicators:
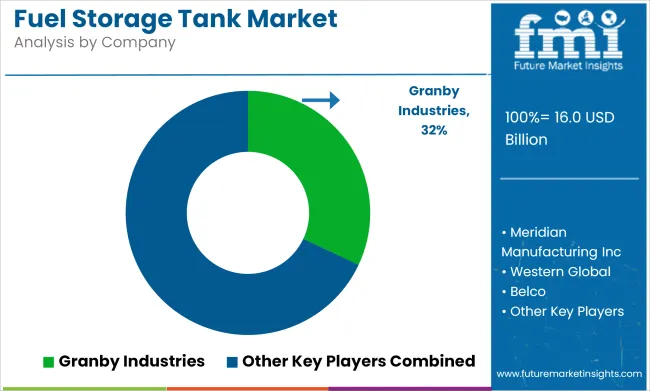
The fuel storage tank market operates with moderate-to-low concentration, featuring approximately 60-80 meaningful participants, where leading companies control roughly 25-30% of global market share through established engineering relationships and comprehensive fabrication capabilities. Competition emphasizes construction quality, project execution reliability, and technical engineering expertise rather than price-based rivalry alone. Tier 1 companies including CST Industries, McDermott (CB&I Storage Solutions), and Containment Solutions collectively command approximately 15-20% market share through comprehensive tank design capabilities and extensive global project presence.
Market Leaders encompass CST Industries, McDermott (CB&I Storage Solutions), and Containment Solutions, which maintain competitive advantages through extensive storage tank engineering expertise, global fabrication networks, and comprehensive project management capabilities that create customer preference and support premium positioning. CST Industries alone holds approximately 7.5% market share through its diverse tank technology portfolio and energy infrastructure relationships. Technology Innovators include Superior Tank Co., Western Global, and Granby Industries, which compete through specialized tank design development and innovative construction methods appealing to customers seeking advanced containment solutions. Regional Specialists feature companies with specific geographic presence and specialized applications, including underground storage systems and mobile fuel distribution tanks. Market dynamics favor participants combining proven fabrication processes with advanced coating systems and comprehensive quality assurance programs.
| Item | Value |
|---|---|
| Quantitative Units | USD 16 billion |
| Tank Type | Above Ground, Underground, Mobile Tanks |
| End Use | Oil & Gas, Power Plants, Chemical, Transportation & Logistics, Mining, Agriculture, Military & Defense, Commercial |
| Material | Carbon Steel, Stainless Steel, Fiberglass, Aluminum, Others |
| Capacity | Above 10,001 gallons, 1,001-10,000 gallons, Up to 1,000 gallons |
| Regions Covered | Asia Pacific, North America, Europe, Middle East & Africa, Latin America |
| Countries Covered | China, India, United States, Japan, United Kingdom, Saudi Arabia, Brazil, Germany, France, Italy, Spain, and 25+ additional countries |
| Key Companies Profiled | CST Industries, McDermott (CB&I Storage Solutions), Containment Solutions, Inc., Superior Tank Co., Inc., Western Global, Granby Industries, Highland Tank, Belco Industries, Snyder Industries, Tuffa UK |
| Additional Attributes | Dollar sales by tank type, end-use industry, material, and capacity categories, regional adoption trends across Asia Pacific, North America, and Europe, competitive landscape with tank fabricators and engineering contractors, operator preferences for structural reliability and environmental compliance, integration with terminal management platforms and automated inventory systems, innovations in composite materials and coating technologies, and development of monitoring solutions with enhanced leak detection and safety optimization capabilities. |
The global fuel storage tank market is estimated to be valued at USD 16.0 billion in 2025.
The market size for the fuel storage tank market is projected to reach USD 25.3 billion by 2035.
The fuel storage tank market is expected to grow at a 4.7% CAGR between 2025 and 2035.
The key product types in fuel storage tank market are above ground, underground and mobile tanks.
In terms of end use, oil & gas segment to command 40.0% share in the fuel storage tank market in 2025.


Full Research Suite comprises of:
Market outlook & trends analysis
Interviews & case studies
Strategic recommendations
Vendor profiles & capabilities analysis
5-year forecasts
8 regions and 60+ country-level data splits
Market segment data splits
12 months of continuous data updates
DELIVERED AS:
PDF EXCEL ONLINE
Fuel rail for CNG Systems Market Size and Share Forecast Outlook 2025 to 2035
Fuel Capacitance Test Equipment Market Size and Share Forecast Outlook 2025 to 2035
Fuel Gas Heater Market Size and Share Forecast Outlook 2025 to 2035
Fuel Management Software Market Size and Share Forecast Outlook 2025 to 2035
Fuel Cell Powertrain Market Size and Share Forecast Outlook 2025 to 2035
Fuel Cell UAV Market Size and Share Forecast Outlook 2025 to 2035
Fuel Cell Stack Market Size and Share Forecast Outlook 2025 to 2035
Fuel Cell Electric Vehicle Market Size and Share Forecast Outlook 2025 to 2035
Fuel Cell Commercial Vehicle Market Size and Share Forecast Outlook 2025 to 2035
Fuel Injection System Market Growth - Trends & Forecast 2025 to 2035
Fuel Additives Market Segmentation based on Type, Application, and Region: Forecast for 2025 and 2035
Fuel Cell Market Growth – Trends & Forecast 2025 to 2035
Fuel Cell for Data Center Market - Trends & Forecast 2025 to 2035
Fuel Cell for Stationary Power Market Growth - Trends & Forecast 2025 to 2035
Fuel Analyzer Market
Fuel Vending Machines Market
Fuel Operated Heaters Market
Fuel Resistant Sealant Market
Fuel Feed Pumps Market
Fuel Measuring Devices Market

Thank you!
You will receive an email from our Business Development Manager. Please be sure to check your SPAM/JUNK folder too.
Chat With
MaRIA