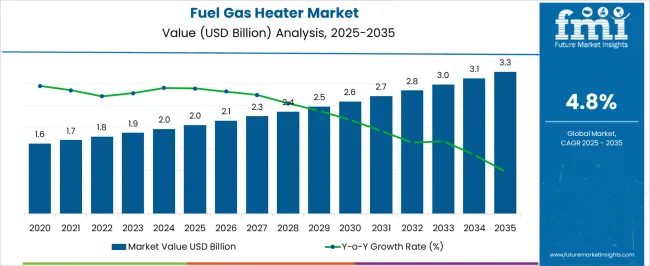
In the recently revised research report made by FMI, the fuel gas heater market is expected to record USD 1,954.80 million in 2024. Rising growth prospects for fuel gas heater solution providers in developed countries are key motivators of this market.
The fuel gas heater industry is forecast to expand at a CAGR of 4.80% in the ten-year time frame. Factors like surging adoption rates and use cases for fuel gas heating applications are supporting the market growth. Additionally, technological advancements and innovations in fuel gas heaters by market players are forecast to boost market growth.
According to revenue analysis of the fuel gas heater market by FMI analysts for the year 2034, the market is expected to surpass USD 3,124.00 million.
Attributes | Key Insights |
---|---|
Fuel Gas Heater Market Size (2024E) | USD 1,954.80 million |
Market Valuation (2034F) | USD 3,124.00 million |
Value-based CAGR (2024 to 2034) | 4.80% |
In a later section of this report, analysis of fuel source preferences and regional market dynamics in the fuel gas heating industry are also vividly discussed.
In the section below, find out emerging opportunities in the fuel gas heater market, instant water heater market, and electric water heater market. The comparative study is beneficial for players seeking expansion of their scope.
Core Market:
Attributes | Fuel Gas Heater Industry |
---|---|
CAGR (2024 to 2034) | 4.80% |
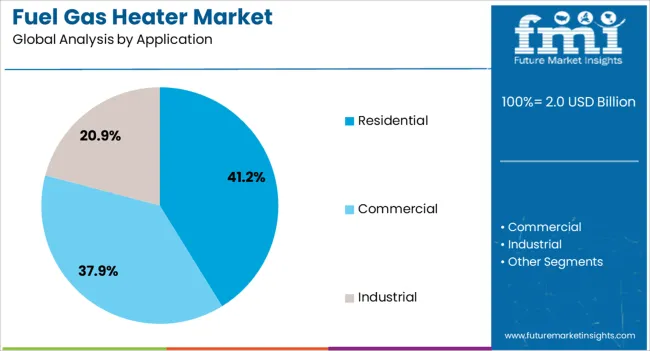
Growth Factor | Growing demand for fuel gas heaters in the residential sector |
Opportunity | IoT connectivity and smart thermostat integration to increase opportunities for fuel gas heaters |
Key Trends | Surging demand for hybrid heating solutions |
Instant Water Heater Market:
Attributes | Instant Water Heater Market |
---|---|
CAGR (2024 to 2034) | 4.60% |
Growth Factor | Increasing prominence of home energy management systems |
Opportunity | Sustainability trends push the integration of renewable energy sources |
Key Trends | Evolving consumer needs propose a heightened scope of hybrid water heaters |
Electric Water Heater Market:
Attributes | Electric Water Heater Market |
---|---|
CAGR (2024 to 2034) | 5.2% |
Growth Factor | Increasing demand for heaters to be used in the residential sector |
Opportunity | Surging product launches by market players |
Key Trends | Rising focus on sustainability to set the trends in the electric water heater market |
Leading Type of Fuel | Natural Gas |
---|---|
Value Share (2024) | 45.20% |
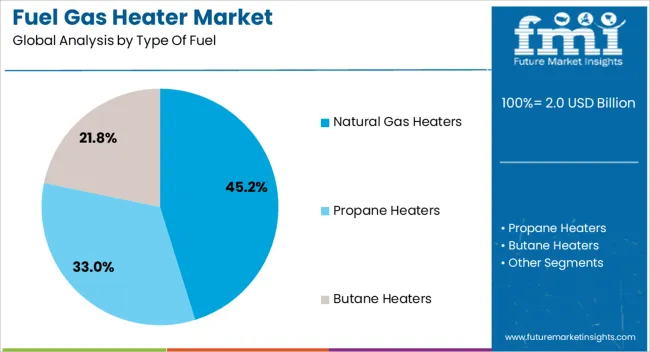
Natural gas is excessively used in fuel gas heaters as it is less polluting and generates a lesser degree of greenhouse gases than its counterparts. Analysts at FMI have estimated that this gas is expected to account for 45.20% of the overall market share.
Alternatively, heaters powered by propane and butane are expected to garner consumer interest and increase take-up over the next decade. This shift in dynamics is expected to make natural gas lose its share in the future, which is comparatively less environmentally friendly.
Leading Technology | Conventional Heaters |
---|---|
Value Share (2024) | 30.30% |
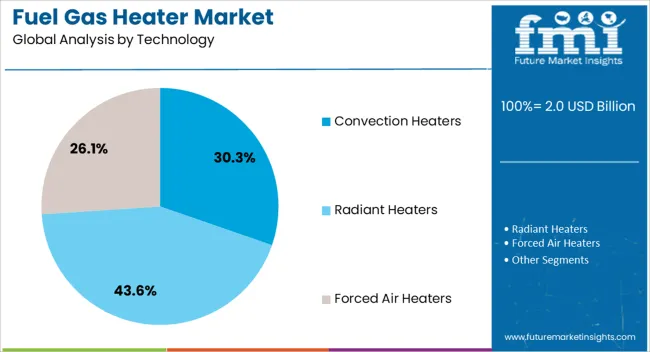
Conventional heaters continue to have a substantial grip in the fuel gas heater market. This segment is projected to offer a value share of 30.30% in the year 2024. The key factor that is still driving the growth of conventional heaters is the cost-savings people experience through the purchase of conventional heaters as opposed to other contemporary options.
Countries | Forecast CAGR (2024 to 2034) |
---|---|
Canada | 5.40% |
Spain | 5.10% |
South Korea | 5.40% |
Japan | 4.90% |
Australia | 5.40% |
The market size of fuel gas heaters in Canada is becoming wider, stretching at a rate of 5.40% over the next ten years. The adoption rate of fuel gas heaters in Canada is higher than in the United States. The country is projected to observe an array of factors that induce market growth:
The growth rate of the fuel gas heater market in Spain is estimated at 5.10% CAGR over the forecast period. The growth of this market is compounding due to various factors, including:
The fuel gas heater industry in South Korea is thriving at a consistent 5.40% CAGR. Factors controlling the market dynamics in the country are as follows:
Japan is projected to witness a compounding growth rate of 4.90% for the next decade. Key factors fueling the market growth are as follows:
Australia’s fuel gas heater market is expected to expand at a CAGR of 5.40% over the next ten years. Key aspects that are compelling market growth are mentioned below:
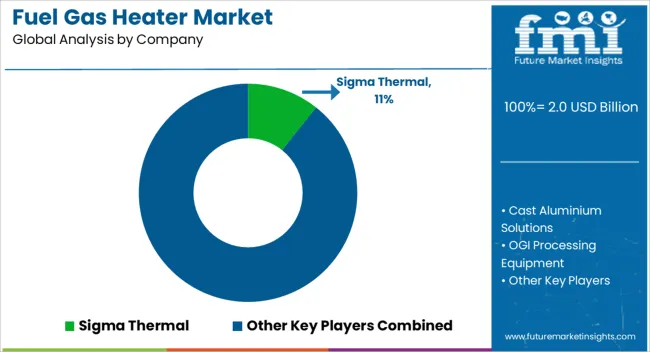
Fuel gas heater companies are expanding their operations across geographies where growth potential seems to be higher. Players are taking extra measures to develop green and efficient heating systems for a sustainable future for the planet.
Going forward, players are expected to continue on their path of research and developmental activities to introduce breakthroughs in the market for advancement.
Industry participants are offering their products online as customers are attracted to the convenience of online platforms. By offering benefits like fast shipping and quality customer service, players are raising their product sales.
Events Shaping the Fuel Gas Heater Market
Table 1: Global Value (US$ Million) Forecast by Region, 2019 to 2034
Table 2: Global Volume (Tons) Forecast by Region, 2019 to 2034
Table 3: Global Value (US$ Million) Forecast by Fuel Type, 2019 to 2034
Table 4: Global Volume (Tons) Forecast by Fuel Type, 2019 to 2034
Table 5: Global Value (US$ Million) Forecast by Application, 2019 to 2034
Table 6: Global Volume (Tons) Forecast by Application, 2019 to 2034
Table 7: Global Value (US$ Million) Forecast by Technology, 2019 to 2034
Table 8: Global Volume (Tons) Forecast by Technology, 2019 to 2034
Table 9: Global Value (US$ Million) Forecast by Distribution Channel, 2019 to 2034
Table 10: Global Volume (Tons) Forecast by Distribution Channel, 2019 to 2034
Table 11: North America Value (US$ Million) Forecast by Country, 2019 to 2034
Table 12: North America Volume (Tons) Forecast by Country, 2019 to 2034
Table 13: North America Value (US$ Million) Forecast by Fuel Type, 2019 to 2034
Table 14: North America Volume (Tons) Forecast by Fuel Type, 2019 to 2034
Table 15: North America Value (US$ Million) Forecast by Application, 2019 to 2034
Table 16: North America Volume (Tons) Forecast by Application, 2019 to 2034
Table 17: North America Value (US$ Million) Forecast by Technology, 2019 to 2034
Table 18: North America Volume (Tons) Forecast by Technology, 2019 to 2034
Table 19: North America Value (US$ Million) Forecast by Distribution Channel, 2019 to 2034
Table 20: North America Volume (Tons) Forecast by Distribution Channel, 2019 to 2034
Table 21: Latin America Value (US$ Million) Forecast by Country, 2019 to 2034
Table 22: Latin America Volume (Tons) Forecast by Country, 2019 to 2034
Table 23: Latin America Value (US$ Million) Forecast by Fuel Type, 2019 to 2034
Table 24: Latin America Volume (Tons) Forecast by Fuel Type, 2019 to 2034
Table 25: Latin America Value (US$ Million) Forecast by Application, 2019 to 2034
Table 26: Latin America Volume (Tons) Forecast by Application, 2019 to 2034
Table 27: Latin America Value (US$ Million) Forecast by Technology, 2019 to 2034
Table 28: Latin America Volume (Tons) Forecast by Technology, 2019 to 2034
Table 29: Latin America Value (US$ Million) Forecast by Distribution Channel, 2019 to 2034
Table 30: Latin America Volume (Tons) Forecast by Distribution Channel, 2019 to 2034
Table 31: Western Europe Value (US$ Million) Forecast by Country, 2019 to 2034
Table 32: Western Europe Volume (Tons) Forecast by Country, 2019 to 2034
Table 33: Western Europe Value (US$ Million) Forecast by Fuel Type, 2019 to 2034
Table 34: Western Europe Volume (Tons) Forecast by Fuel Type, 2019 to 2034
Table 35: Western Europe Value (US$ Million) Forecast by Application, 2019 to 2034
Table 36: Western Europe Volume (Tons) Forecast by Application, 2019 to 2034
Table 37: Western Europe Value (US$ Million) Forecast by Technology, 2019 to 2034
Table 38: Western Europe Volume (Tons) Forecast by Technology, 2019 to 2034
Table 39: Western Europe Value (US$ Million) Forecast by Distribution Channel, 2019 to 2034
Table 40: Western Europe Volume (Tons) Forecast by Distribution Channel, 2019 to 2034
Table 41: Eastern Europe Value (US$ Million) Forecast by Country, 2019 to 2034
Table 42: Eastern Europe Volume (Tons) Forecast by Country, 2019 to 2034
Table 43: Eastern Europe Value (US$ Million) Forecast by Fuel Type, 2019 to 2034
Table 44: Eastern Europe Volume (Tons) Forecast by Fuel Type, 2019 to 2034
Table 45: Eastern Europe Value (US$ Million) Forecast by Application, 2019 to 2034
Table 46: Eastern Europe Volume (Tons) Forecast by Application, 2019 to 2034
Table 47: Eastern Europe Value (US$ Million) Forecast by Technology, 2019 to 2034
Table 48: Eastern Europe Volume (Tons) Forecast by Technology, 2019 to 2034
Table 49: Eastern Europe Value (US$ Million) Forecast by Distribution Channel, 2019 to 2034
Table 50: Eastern Europe Volume (Tons) Forecast by Distribution Channel, 2019 to 2034
Table 51: East Asia Value (US$ Million) Forecast by Country, 2019 to 2034
Table 52: East Asia Volume (Tons) Forecast by Country, 2019 to 2034
Table 53: East Asia Value (US$ Million) Forecast by Fuel Type, 2019 to 2034
Table 54: East Asia Volume (Tons) Forecast by Fuel Type, 2019 to 2034
Table 55: East Asia Value (US$ Million) Forecast by Application, 2019 to 2034
Table 56: East Asia Volume (Tons) Forecast by Application, 2019 to 2034
Table 57: East Asia Value (US$ Million) Forecast by Technology, 2019 to 2034
Table 58: East Asia Volume (Tons) Forecast by Technology, 2019 to 2034
Table 59: East Asia Value (US$ Million) Forecast by Distribution Channel, 2019 to 2034
Table 60: East Asia Volume (Tons) Forecast by Distribution Channel, 2019 to 2034
Table 61: South Asia Pacific Value (US$ Million) Forecast by Country, 2019 to 2034
Table 62: South Asia Pacific Volume (Tons) Forecast by Country, 2019 to 2034
Table 63: South Asia Pacific Value (US$ Million) Forecast by Fuel Type, 2019 to 2034
Table 64: South Asia Pacific Volume (Tons) Forecast by Fuel Type, 2019 to 2034
Table 65: South Asia Pacific Value (US$ Million) Forecast by Application, 2019 to 2034
Table 66: South Asia Pacific Volume (Tons) Forecast by Application, 2019 to 2034
Table 67: South Asia Pacific Value (US$ Million) Forecast by Technology, 2019 to 2034
Table 68: South Asia Pacific Volume (Tons) Forecast by Technology, 2019 to 2034
Table 69: South Asia Pacific Value (US$ Million) Forecast by Distribution Channel, 2019 to 2034
Table 70: South Asia Pacific Volume (Tons) Forecast by Distribution Channel, 2019 to 2034
Table 71: Middle East & Africa Value (US$ Million) Forecast by Country, 2019 to 2034
Table 72: Middle East & Africa Volume (Tons) Forecast by Country, 2019 to 2034
Table 73: Middle East & Africa Value (US$ Million) Forecast by Fuel Type, 2019 to 2034
Table 74: Middle East & Africa Volume (Tons) Forecast by Fuel Type, 2019 to 2034
Table 75: Middle East & Africa Value (US$ Million) Forecast by Application, 2019 to 2034
Table 76: Middle East & Africa Volume (Tons) Forecast by Application, 2019 to 2034
Table 77: Middle East & Africa Value (US$ Million) Forecast by Technology, 2019 to 2034
Table 78: Middle East & Africa Volume (Tons) Forecast by Technology, 2019 to 2034
Table 79: Middle East & Africa Value (US$ Million) Forecast by Distribution Channel, 2019 to 2034
Table 80: Middle East & Africa Volume (Tons) Forecast by Distribution Channel, 2019 to 2034
Figure 1: Global Value (US$ Million) by Fuel Type, 2024 to 2034
Figure 2: Global Value (US$ Million) by Application, 2024 to 2034
Figure 3: Global Value (US$ Million) by Technology, 2024 to 2034
Figure 4: Global Value (US$ Million) by Distribution Channel, 2024 to 2034
Figure 5: Global Value (US$ Million) by Region, 2024 to 2034
Figure 6: Global Value (US$ Million) Analysis by Region, 2019 to 2034
Figure 7: Global Volume (Tons) Analysis by Region, 2019 to 2034
Figure 8: Global Value Share (%) and BPS Analysis by Region, 2024 to 2034
Figure 9: Global Y-o-Y Growth (%) Projections by Region, 2024 to 2034
Figure 10: Global Value (US$ Million) Analysis by Fuel Type, 2019 to 2034
Figure 11: Global Volume (Tons) Analysis by Fuel Type, 2019 to 2034
Figure 12: Global Value Share (%) and BPS Analysis by Fuel Type, 2024 to 2034
Figure 13: Global Y-o-Y Growth (%) Projections by Fuel Type, 2024 to 2034
Figure 14: Global Value (US$ Million) Analysis by Application, 2019 to 2034
Figure 15: Global Volume (Tons) Analysis by Application, 2019 to 2034
Figure 16: Global Value Share (%) and BPS Analysis by Application, 2024 to 2034
Figure 17: Global Y-o-Y Growth (%) Projections by Application, 2024 to 2034
Figure 18: Global Value (US$ Million) Analysis by Technology, 2019 to 2034
Figure 19: Global Volume (Tons) Analysis by Technology, 2019 to 2034
Figure 20: Global Value Share (%) and BPS Analysis by Technology, 2024 to 2034
Figure 21: Global Y-o-Y Growth (%) Projections by Technology, 2024 to 2034
Figure 22: Global Value (US$ Million) Analysis by Distribution Channel, 2019 to 2034
Figure 23: Global Volume (Tons) Analysis by Distribution Channel, 2019 to 2034
Figure 24: Global Value Share (%) and BPS Analysis by Distribution Channel, 2024 to 2034
Figure 25: Global Y-o-Y Growth (%) Projections by Distribution Channel, 2024 to 2034
Figure 26: Global Attractiveness by Fuel Type, 2024 to 2034
Figure 27: Global Attractiveness by Application, 2024 to 2034
Figure 28: Global Attractiveness by Technology, 2024 to 2034
Figure 29: Global Attractiveness by Distribution Channel, 2024 to 2034
Figure 30: Global Attractiveness by Region, 2024 to 2034
Figure 31: North America Value (US$ Million) by Fuel Type, 2024 to 2034
Figure 32: North America Value (US$ Million) by Application, 2024 to 2034
Figure 33: North America Value (US$ Million) by Technology, 2024 to 2034
Figure 34: North America Value (US$ Million) by Distribution Channel, 2024 to 2034
Figure 35: North America Value (US$ Million) by Country, 2024 to 2034
Figure 36: North America Value (US$ Million) Analysis by Country, 2019 to 2034
Figure 37: North America Volume (Tons) Analysis by Country, 2019 to 2034
Figure 38: North America Value Share (%) and BPS Analysis by Country, 2024 to 2034
Figure 39: North America Y-o-Y Growth (%) Projections by Country, 2024 to 2034
Figure 40: North America Value (US$ Million) Analysis by Fuel Type, 2019 to 2034
Figure 41: North America Volume (Tons) Analysis by Fuel Type, 2019 to 2034
Figure 42: North America Value Share (%) and BPS Analysis by Fuel Type, 2024 to 2034
Figure 43: North America Y-o-Y Growth (%) Projections by Fuel Type, 2024 to 2034
Figure 44: North America Value (US$ Million) Analysis by Application, 2019 to 2034
Figure 45: North America Volume (Tons) Analysis by Application, 2019 to 2034
Figure 46: North America Value Share (%) and BPS Analysis by Application, 2024 to 2034
Figure 47: North America Y-o-Y Growth (%) Projections by Application, 2024 to 2034
Figure 48: North America Value (US$ Million) Analysis by Technology, 2019 to 2034
Figure 49: North America Volume (Tons) Analysis by Technology, 2019 to 2034
Figure 50: North America Value Share (%) and BPS Analysis by Technology, 2024 to 2034
Figure 51: North America Y-o-Y Growth (%) Projections by Technology, 2024 to 2034
Figure 52: North America Value (US$ Million) Analysis by Distribution Channel, 2019 to 2034
Figure 53: North America Volume (Tons) Analysis by Distribution Channel, 2019 to 2034
Figure 54: North America Value Share (%) and BPS Analysis by Distribution Channel, 2024 to 2034
Figure 55: North America Y-o-Y Growth (%) Projections by Distribution Channel, 2024 to 2034
Figure 56: North America Attractiveness by Fuel Type, 2024 to 2034
Figure 57: North America Attractiveness by Application, 2024 to 2034
Figure 58: North America Attractiveness by Technology, 2024 to 2034
Figure 59: North America Attractiveness by Distribution Channel, 2024 to 2034
Figure 60: North America Attractiveness by Country, 2024 to 2034
Figure 61: Latin America Value (US$ Million) by Fuel Type, 2024 to 2034
Figure 62: Latin America Value (US$ Million) by Application, 2024 to 2034
Figure 63: Latin America Value (US$ Million) by Technology, 2024 to 2034
Figure 64: Latin America Value (US$ Million) by Distribution Channel, 2024 to 2034
Figure 65: Latin America Value (US$ Million) by Country, 2024 to 2034
Figure 66: Latin America Value (US$ Million) Analysis by Country, 2019 to 2034
Figure 67: Latin America Volume (Tons) Analysis by Country, 2019 to 2034
Figure 68: Latin America Value Share (%) and BPS Analysis by Country, 2024 to 2034
Figure 69: Latin America Y-o-Y Growth (%) Projections by Country, 2024 to 2034
Figure 70: Latin America Value (US$ Million) Analysis by Fuel Type, 2019 to 2034
Figure 71: Latin America Volume (Tons) Analysis by Fuel Type, 2019 to 2034
Figure 72: Latin America Value Share (%) and BPS Analysis by Fuel Type, 2024 to 2034
Figure 73: Latin America Y-o-Y Growth (%) Projections by Fuel Type, 2024 to 2034
Figure 74: Latin America Value (US$ Million) Analysis by Application, 2019 to 2034
Figure 75: Latin America Volume (Tons) Analysis by Application, 2019 to 2034
Figure 76: Latin America Value Share (%) and BPS Analysis by Application, 2024 to 2034
Figure 77: Latin America Y-o-Y Growth (%) Projections by Application, 2024 to 2034
Figure 78: Latin America Value (US$ Million) Analysis by Technology, 2019 to 2034
Figure 79: Latin America Volume (Tons) Analysis by Technology, 2019 to 2034
Figure 80: Latin America Value Share (%) and BPS Analysis by Technology, 2024 to 2034
Figure 81: Latin America Y-o-Y Growth (%) Projections by Technology, 2024 to 2034
Figure 82: Latin America Value (US$ Million) Analysis by Distribution Channel, 2019 to 2034
Figure 83: Latin America Volume (Tons) Analysis by Distribution Channel, 2019 to 2034
Figure 84: Latin America Value Share (%) and BPS Analysis by Distribution Channel, 2024 to 2034
Figure 85: Latin America Y-o-Y Growth (%) Projections by Distribution Channel, 2024 to 2034
Figure 86: Latin America Attractiveness by Fuel Type, 2024 to 2034
Figure 87: Latin America Attractiveness by Application, 2024 to 2034
Figure 88: Latin America Attractiveness by Technology, 2024 to 2034
Figure 89: Latin America Attractiveness by Distribution Channel, 2024 to 2034
Figure 90: Latin America Attractiveness by Country, 2024 to 2034
Figure 91: Western Europe Value (US$ Million) by Fuel Type, 2024 to 2034
Figure 92: Western Europe Value (US$ Million) by Application, 2024 to 2034
Figure 93: Western Europe Value (US$ Million) by Technology, 2024 to 2034
Figure 94: Western Europe Value (US$ Million) by Distribution Channel, 2024 to 2034
Figure 95: Western Europe Value (US$ Million) by Country, 2024 to 2034
Figure 96: Western Europe Value (US$ Million) Analysis by Country, 2019 to 2034
Figure 97: Western Europe Volume (Tons) Analysis by Country, 2019 to 2034
Figure 98: Western Europe Value Share (%) and BPS Analysis by Country, 2024 to 2034
Figure 99: Western Europe Y-o-Y Growth (%) Projections by Country, 2024 to 2034
Figure 100: Western Europe Value (US$ Million) Analysis by Fuel Type, 2019 to 2034
Figure 101: Western Europe Volume (Tons) Analysis by Fuel Type, 2019 to 2034
Figure 102: Western Europe Value Share (%) and BPS Analysis by Fuel Type, 2024 to 2034
Figure 103: Western Europe Y-o-Y Growth (%) Projections by Fuel Type, 2024 to 2034
Figure 104: Western Europe Value (US$ Million) Analysis by Application, 2019 to 2034
Figure 105: Western Europe Volume (Tons) Analysis by Application, 2019 to 2034
Figure 106: Western Europe Value Share (%) and BPS Analysis by Application, 2024 to 2034
Figure 107: Western Europe Y-o-Y Growth (%) Projections by Application, 2024 to 2034
Figure 108: Western Europe Value (US$ Million) Analysis by Technology, 2019 to 2034
Figure 109: Western Europe Volume (Tons) Analysis by Technology, 2019 to 2034
Figure 110: Western Europe Value Share (%) and BPS Analysis by Technology, 2024 to 2034
Figure 111: Western Europe Y-o-Y Growth (%) Projections by Technology, 2024 to 2034
Figure 112: Western Europe Value (US$ Million) Analysis by Distribution Channel, 2019 to 2034
Figure 113: Western Europe Volume (Tons) Analysis by Distribution Channel, 2019 to 2034
Figure 114: Western Europe Value Share (%) and BPS Analysis by Distribution Channel, 2024 to 2034
Figure 115: Western Europe Y-o-Y Growth (%) Projections by Distribution Channel, 2024 to 2034
Figure 116: Western Europe Attractiveness by Fuel Type, 2024 to 2034
Figure 117: Western Europe Attractiveness by Application, 2024 to 2034
Figure 118: Western Europe Attractiveness by Technology, 2024 to 2034
Figure 119: Western Europe Attractiveness by Distribution Channel, 2024 to 2034
Figure 120: Western Europe Attractiveness by Country, 2024 to 2034
Figure 121: Eastern Europe Value (US$ Million) by Fuel Type, 2024 to 2034
Figure 122: Eastern Europe Value (US$ Million) by Application, 2024 to 2034
Figure 123: Eastern Europe Value (US$ Million) by Technology, 2024 to 2034
Figure 124: Eastern Europe Value (US$ Million) by Distribution Channel, 2024 to 2034
Figure 125: Eastern Europe Value (US$ Million) by Country, 2024 to 2034
Figure 126: Eastern Europe Value (US$ Million) Analysis by Country, 2019 to 2034
Figure 127: Eastern Europe Volume (Tons) Analysis by Country, 2019 to 2034
Figure 128: Eastern Europe Value Share (%) and BPS Analysis by Country, 2024 to 2034
Figure 129: Eastern Europe Y-o-Y Growth (%) Projections by Country, 2024 to 2034
Figure 130: Eastern Europe Value (US$ Million) Analysis by Fuel Type, 2019 to 2034
Figure 131: Eastern Europe Volume (Tons) Analysis by Fuel Type, 2019 to 2034
Figure 132: Eastern Europe Value Share (%) and BPS Analysis by Fuel Type, 2024 to 2034
Figure 133: Eastern Europe Y-o-Y Growth (%) Projections by Fuel Type, 2024 to 2034
Figure 134: Eastern Europe Value (US$ Million) Analysis by Application, 2019 to 2034
Figure 135: Eastern Europe Volume (Tons) Analysis by Application, 2019 to 2034
Figure 136: Eastern Europe Value Share (%) and BPS Analysis by Application, 2024 to 2034
Figure 137: Eastern Europe Y-o-Y Growth (%) Projections by Application, 2024 to 2034
Figure 138: Eastern Europe Value (US$ Million) Analysis by Technology, 2019 to 2034
Figure 139: Eastern Europe Volume (Tons) Analysis by Technology, 2019 to 2034
Figure 140: Eastern Europe Value Share (%) and BPS Analysis by Technology, 2024 to 2034
Figure 141: Eastern Europe Y-o-Y Growth (%) Projections by Technology, 2024 to 2034
Figure 142: Eastern Europe Value (US$ Million) Analysis by Distribution Channel, 2019 to 2034
Figure 143: Eastern Europe Volume (Tons) Analysis by Distribution Channel, 2019 to 2034
Figure 144: Eastern Europe Value Share (%) and BPS Analysis by Distribution Channel, 2024 to 2034
Figure 145: Eastern Europe Y-o-Y Growth (%) Projections by Distribution Channel, 2024 to 2034
Figure 146: Eastern Europe Attractiveness by Fuel Type, 2024 to 2034
Figure 147: Eastern Europe Attractiveness by Application, 2024 to 2034
Figure 148: Eastern Europe Attractiveness by Technology, 2024 to 2034
Figure 149: Eastern Europe Attractiveness by Distribution Channel, 2024 to 2034
Figure 150: Eastern Europe Attractiveness by Country, 2024 to 2034
Figure 151: East Asia Value (US$ Million) by Fuel Type, 2024 to 2034
Figure 152: East Asia Value (US$ Million) by Application, 2024 to 2034
Figure 153: East Asia Value (US$ Million) by Technology, 2024 to 2034
Figure 154: East Asia Value (US$ Million) by Distribution Channel, 2024 to 2034
Figure 155: East Asia Value (US$ Million) by Country, 2024 to 2034
Figure 156: East Asia Value (US$ Million) Analysis by Country, 2019 to 2034
Figure 157: East Asia Volume (Tons) Analysis by Country, 2019 to 2034
Figure 158: East Asia Value Share (%) and BPS Analysis by Country, 2024 to 2034
Figure 159: East Asia Y-o-Y Growth (%) Projections by Country, 2024 to 2034
Figure 160: East Asia Value (US$ Million) Analysis by Fuel Type, 2019 to 2034
Figure 161: East Asia Volume (Tons) Analysis by Fuel Type, 2019 to 2034
Figure 162: East Asia Value Share (%) and BPS Analysis by Fuel Type, 2024 to 2034
Figure 163: East Asia Y-o-Y Growth (%) Projections by Fuel Type, 2024 to 2034
Figure 164: East Asia Value (US$ Million) Analysis by Application, 2019 to 2034
Figure 165: East Asia Volume (Tons) Analysis by Application, 2019 to 2034
Figure 166: East Asia Value Share (%) and BPS Analysis by Application, 2024 to 2034
Figure 167: East Asia Y-o-Y Growth (%) Projections by Application, 2024 to 2034
Figure 168: East Asia Value (US$ Million) Analysis by Technology, 2019 to 2034
Figure 169: East Asia Volume (Tons) Analysis by Technology, 2019 to 2034
Figure 170: East Asia Value Share (%) and BPS Analysis by Technology, 2024 to 2034
Figure 171: East Asia Y-o-Y Growth (%) Projections by Technology, 2024 to 2034
Figure 172: East Asia Value (US$ Million) Analysis by Distribution Channel, 2019 to 2034
Figure 173: East Asia Volume (Tons) Analysis by Distribution Channel, 2019 to 2034
Figure 174: East Asia Value Share (%) and BPS Analysis by Distribution Channel, 2024 to 2034
Figure 175: East Asia Y-o-Y Growth (%) Projections by Distribution Channel, 2024 to 2034
Figure 176: East Asia Attractiveness by Fuel Type, 2024 to 2034
Figure 177: East Asia Attractiveness by Application, 2024 to 2034
Figure 178: East Asia Attractiveness by Technology, 2024 to 2034
Figure 179: East Asia Attractiveness by Distribution Channel, 2024 to 2034
Figure 180: East Asia Attractiveness by Country, 2024 to 2034
Figure 181: South Asia Pacific Value (US$ Million) by Fuel Type, 2024 to 2034
Figure 182: South Asia Pacific Value (US$ Million) by Application, 2024 to 2034
Figure 183: South Asia Pacific Value (US$ Million) by Technology, 2024 to 2034
Figure 184: South Asia Pacific Value (US$ Million) by Distribution Channel, 2024 to 2034
Figure 185: South Asia Pacific Value (US$ Million) by Country, 2024 to 2034
Figure 186: South Asia Pacific Value (US$ Million) Analysis by Country, 2019 to 2034
Figure 187: South Asia Pacific Volume (Tons) Analysis by Country, 2019 to 2034
Figure 188: South Asia Pacific Value Share (%) and BPS Analysis by Country, 2024 to 2034
Figure 189: South Asia Pacific Y-o-Y Growth (%) Projections by Country, 2024 to 2034
Figure 190: South Asia Pacific Value (US$ Million) Analysis by Fuel Type, 2019 to 2034
Figure 191: South Asia Pacific Volume (Tons) Analysis by Fuel Type, 2019 to 2034
Figure 192: South Asia Pacific Value Share (%) and BPS Analysis by Fuel Type, 2024 to 2034
Figure 193: South Asia Pacific Y-o-Y Growth (%) Projections by Fuel Type, 2024 to 2034
Figure 194: South Asia Pacific Value (US$ Million) Analysis by Application, 2019 to 2034
Figure 195: South Asia Pacific Volume (Tons) Analysis by Application, 2019 to 2034
Figure 196: South Asia Pacific Value Share (%) and BPS Analysis by Application, 2024 to 2034
Figure 197: South Asia Pacific Y-o-Y Growth (%) Projections by Application, 2024 to 2034
Figure 198: South Asia Pacific Value (US$ Million) Analysis by Technology, 2019 to 2034
Figure 199: South Asia Pacific Volume (Tons) Analysis by Technology, 2019 to 2034
Figure 200: South Asia Pacific Value Share (%) and BPS Analysis by Technology, 2024 to 2034
Figure 201: South Asia Pacific Y-o-Y Growth (%) Projections by Technology, 2024 to 2034
Figure 202: South Asia Pacific Value (US$ Million) Analysis by Distribution Channel, 2019 to 2034
Figure 203: South Asia Pacific Volume (Tons) Analysis by Distribution Channel, 2019 to 2034
Figure 204: South Asia Pacific Value Share (%) and BPS Analysis by Distribution Channel, 2024 to 2034
Figure 205: South Asia Pacific Y-o-Y Growth (%) Projections by Distribution Channel, 2024 to 2034
Figure 206: South Asia Pacific Attractiveness by Fuel Type, 2024 to 2034
Figure 207: South Asia Pacific Attractiveness by Application, 2024 to 2034
Figure 208: South Asia Pacific Attractiveness by Technology, 2024 to 2034
Figure 209: South Asia Pacific Attractiveness by Distribution Channel, 2024 to 2034
Figure 210: South Asia Pacific Attractiveness by Country, 2024 to 2034
Figure 211: Middle East & Africa Value (US$ Million) by Fuel Type, 2024 to 2034
Figure 212: Middle East & Africa Value (US$ Million) by Application, 2024 to 2034
Figure 213: Middle East & Africa Value (US$ Million) by Technology, 2024 to 2034
Figure 214: Middle East & Africa Value (US$ Million) by Distribution Channel, 2024 to 2034
Figure 215: Middle East & Africa Value (US$ Million) by Country, 2024 to 2034
Figure 216: Middle East & Africa Value (US$ Million) Analysis by Country, 2019 to 2034
Figure 217: Middle East & Africa Volume (Tons) Analysis by Country, 2019 to 2034
Figure 218: Middle East & Africa Value Share (%) and BPS Analysis by Country, 2024 to 2034
Figure 219: Middle East & Africa Y-o-Y Growth (%) Projections by Country, 2024 to 2034
Figure 220: Middle East & Africa Value (US$ Million) Analysis by Fuel Type, 2019 to 2034
Figure 221: Middle East & Africa Volume (Tons) Analysis by Fuel Type, 2019 to 2034
Figure 222: Middle East & Africa Value Share (%) and BPS Analysis by Fuel Type, 2024 to 2034
Figure 223: Middle East & Africa Y-o-Y Growth (%) Projections by Fuel Type, 2024 to 2034
Figure 224: Middle East & Africa Value (US$ Million) Analysis by Application, 2019 to 2034
Figure 225: Middle East & Africa Volume (Tons) Analysis by Application, 2019 to 2034
Figure 226: Middle East & Africa Value Share (%) and BPS Analysis by Application, 2024 to 2034
Figure 227: Middle East & Africa Y-o-Y Growth (%) Projections by Application, 2024 to 2034
Figure 228: Middle East & Africa Value (US$ Million) Analysis by Technology, 2019 to 2034
Figure 229: Middle East & Africa Volume (Tons) Analysis by Technology, 2019 to 2034
Figure 230: Middle East & Africa Value Share (%) and BPS Analysis by Technology, 2024 to 2034
Figure 231: Middle East & Africa Y-o-Y Growth (%) Projections by Technology, 2024 to 2034
Figure 232: Middle East & Africa Value (US$ Million) Analysis by Distribution Channel, 2019 to 2034
Figure 233: Middle East & Africa Volume (Tons) Analysis by Distribution Channel, 2019 to 2034
Figure 234: Middle East & Africa Value Share (%) and BPS Analysis by Distribution Channel, 2024 to 2034
Figure 235: Middle East & Africa Y-o-Y Growth (%) Projections by Distribution Channel, 2024 to 2034
Figure 236: Middle East & Africa Attractiveness by Fuel Type, 2024 to 2034
Figure 237: Middle East & Africa Attractiveness by Application, 2024 to 2034
Figure 238: Middle East & Africa Attractiveness by Technology, 2024 to 2034
Figure 239: Middle East & Africa Attractiveness by Distribution Channel, 2024 to 2034
Figure 240: Middle East & Africa Attractiveness by Country, 2024 to 2034
Current projections of the market indicate a valuation of USD 1,954.80 million in 2024.
Looking ahead to 2034, the current forecast projects a CAGR of 4.80% for the industry.
FMI predicts the market to reach USD 3,124.00 million by the year 2034.
Conventional heaters are predicted to hold a significant market share during the forecast period.
South Korea, Japan, and Canada are predicted to offer many opportunities for investors and stakeholders.
Heatco, Exotherm Corporation, and Sigma Thermal are powerful players in the fuel gas heater industry.
Explore Industrial Thermal & HVAC Solutions Insights
Thank you!
You will receive an email from our Business Development Manager. Please be sure to check your SPAM/JUNK folder too.