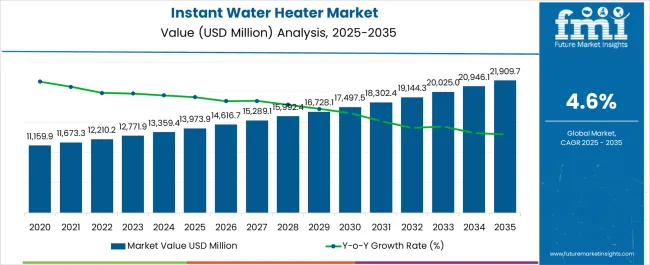
The valuation of the instant water heater market is projected to surpass US$ 21,825.9 million by 2034. The market is anticipated to grow at a 4.60% CAGR until 2034. In 2024, the instant water heater market size stands at US$ 13,920.5 million.
Attributes | Details |
---|---|
Instant Water Heater Market Size, 2023 | US$ 13,359.4 million |
Instant Water Heater Market Size, 2024 | US$ 13,920.5 million |
Instant Water Heater Market Size, 2034 | US$ 21,825.9 million |
Value CAGR (2024 to 2034) | 4.60% |
Key Market Highlights
Integration with Home Energy Management Systems Gaining Prominence
In response to the growing popularity of smart homes, instant water heaters are being incorporated with home energy management systems (HEMS). Manufacturers seek to maximize energy efficiency and improve overall home performance by integrating their offerings with more comprehensive energy management systems. Instantaneous water heaters are now positioned as essential parts of intelligent, networked ecosystems due to this clever approach. Businesses can benefit from this trend by capitalizing on the rising need for seamless, energy-efficient solutions as part of a comprehensive energy strategy, showcasing their offerings as important elements of the smart home environment.
Demand for Hybrid Water Heaters Surges Due to Evolving Consumer Needs
The rise in demand for hybrid water heaters is attributed to a focused business strategy to meet a wide range of consumer demands while increasing market penetration. Manufacturers want to deliver a configurable solution that provides rapid hot water while avoiding possible downsides associated with peak demand scenarios by integrating tankless and storage tank technology. This approach is consistent with a market trend toward personalization and customization, in which customers demand appliances that can adjust to changing usage patterns. The hybrid design is a strategic product differentiation approach that allows manufacturers to reach a larger market segment by catering to immediate and storage-oriented water heating requirements.
Sustainability Trends Boost Integration with Renewable Energy Sources
Manufacturers are launching instant hot water systems with renewable energy sources to align with the rising sustainability trends. Products are being proactively aligned with the expanding environmental agenda, as seen by the clever integration of quick water heaters with renewable energy sources. Producers promote their offerings by incorporating solar panels and other renewable technology as environmentally responsible choices that help consumers lower their carbon footprints. This calculated move capitalizes on the growing customer desire for sustainable living solutions by leveraging the perceived environmental advantages of integrating renewable energy. Firms can present themselves as environmentally conscious participants in the market with a strategic advantage by aligning with anticipated future legislative changes and incentives.
Don't pay for what you don't need
Customize your report by selecting specific countries or regions and save 30%!
Attributes | Details |
---|---|
Historical Market Size (2019) | US$ 11,777.9 million |
Instant Water Heater Market Size (2023) | US$ 13,359.4 million |
HCAGR (2019 to 2023) | 3.20% |
The instant water heater market size expanded at a 3.20% CAGR from 2019 to 2023. Customers' growing consciousness of energy efficiency and desire to reduce utility expenses have prompted the quest for more economical water heating solutions. The energy-efficient instant water heaters, often referred to as tankless water heaters, eliminate the continual loss of energy associated with conventional tank water heaters by heating water only when needed. Everyday convenience and on-demand services are becoming increasingly important to consumers. Without having to wait for a storage tank to warm up, instant water heaters deliver hot water virtually quickly. This prompt adaptation is consistent with the current lifestyle, where convenience plays a big role in consumer decisions.
Technological advancements have significantly aided the expansion of the market in the design and operation of instant water heaters. Smart controls, programmable settings, and connection to smart home systems are examples of advanced technologies that have improved user experience and drawn in tech-savvy customers. Compact water heaters are popular among customers with limited space, such as those living in flats or smaller residences, because of their design. In addition, producers have concentrated on producing visually attractive designs that qualify fast water heaters for installations visible in bathrooms and kitchens.
The demand for instant water heaters is anticipated to surge at a 4.60% CAGR through 2034. Enhanced water quality control capabilities are expected to be included in future rapid water heaters. Meeting rising customer concerns about water quality could entail more advanced filtration, purification, and monitoring systems to guarantee not just hot water supply but also water safety. Additionally, adaptive control systems and predictive maintenance for instant water heaters could benefit from AI and ML technology. Intelligent algorithms have the potential to enhance operational efficiency and dependability by examining consumption trends, identifying irregularities, and optimizing performance.
Trends |
|
---|---|
Opportunities |
|
Challenges |
|
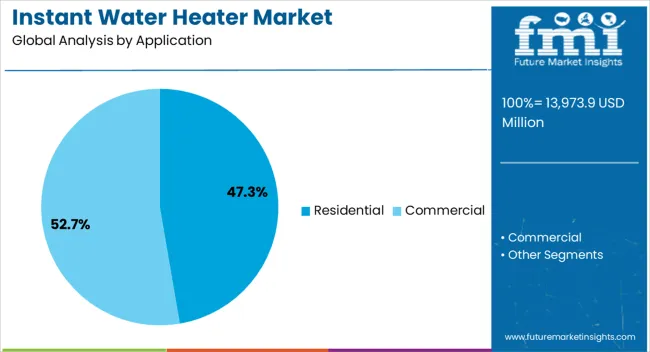
Top Application | Residential |
---|---|
Value Share (2024) | 70.20% |
The appeal of instant water heaters' in residential settings is partly attributed to their incorporation into smart home ecosystems. Through voice-activated assistants or smartphone applications, homeowners can remotely manage and monitor these gadgets, providing a level of convenience and keeping up with the rapidly expanding trend of smart home technology. The energy-efficient nature of instantaneous water heaters is well-liked by budget-conscious customers. Instant water heaters heat water just when it is needed, as opposed to conventional tank water heaters that heat and store water continually. As a result, there is a decrease in energy use, which lowers utility costs and saves household money over time.
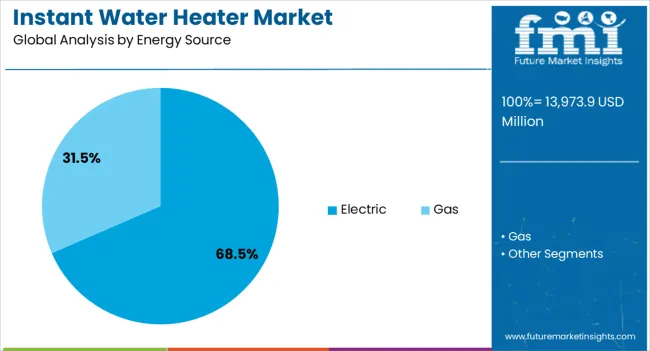
Top Energy Source | Electric |
---|---|
Value Share (2024) | 73.60% |
The competitiveness of the market and improvements in manufacturing techniques have reduced the cost of electric instant water heaters. These devices' affordable prices have opened up access to a wider spectrum of customers, which has aided in their widespread use. Instantaneous water heaters that run on electricity heat water quickly and on-demand, giving homeowners access to hot water right away. Because there is no storage tank, there is no waiting for the water to get to the right temperature, which is in line with contemporary lifestyles that value convenience. In the upcoming years, it is anticipated that the demand for electric tankless water heaters would soar.
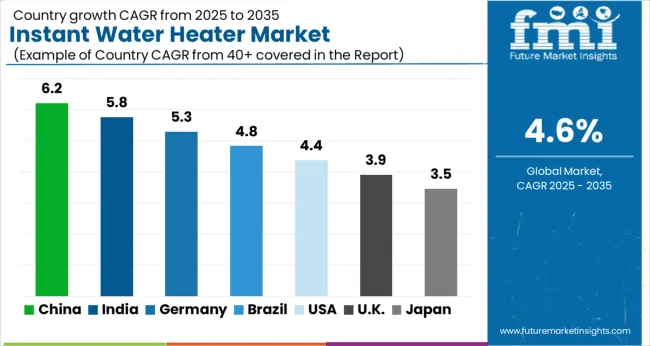
Countries | CAGR (2024 to 2034) |
---|---|
United States | 3.20% |
Canada | 4.20% |
China | 4.60% |
India | 6.10% |
Australia | 5.30% |
The demand for instant water heaters in the United States is projected to rise at a 3.20% CAGR through 2034. The pent-up demand is one aspect of the replacement market that is frequently disregarded. As homeowners look for more contemporary and effective options, manufacturers have a chance to capitalize on aging water heating systems. In a dynamic climate where instant water heaters are increasingly viewed as feasible improvements, the industry is expanding in part due to the need to replace outdated water heaters.
The instant water heater market in Canada is predicted to surge at a 4.20% CAGR through 2034. The regulatory environment is changing, with a focus on sustainable practices and energy efficiency regulations. This has a substantial impact on the growth of the Canadian market. Instant water heaters, which are well-known for their energy efficiency and ability to heat water on demand, play a crucial role in fulfilling compliance requirements as the country strives to satisfy increasingly strict environmental standards. Manufacturers are profiting from this rise in demand generated by regulations by actively marketing their products as compliant and eco-friendly.
The instant water heater market size in China is estimated to develop at a 4.60% CAGR through 2034. The instantaneous water heater market is growing dramatically as a result of China's explosive growth in e-commerce and online retail penetration. Manufacturers are taking advantage of the large digital customer base by using online channels for sales and distribution. Reaching and gaining a larger market share requires the use of e-commerce tactics, such as online promotions, special offers, and effective logistics.
The instant water heater market in India is anticipated to rise at a 6.10% CAGR through 2034. The rapid development of India's real estate sector and infrastructure stimulates the demand for instant water heaters. Strategically promoting their goods as contemporary, energy-efficient, and space-saving options for new residential buildings is how manufacturers are working with construction companies and real estate developers. This suits the tastes of those looking for modern conveniences in their homes.
The sales of instant water heaters in Australia are predicted to surge at a 5.30% CAGR through 2034. The growing use of solar energy in Australia coincides with the rise of the market for instantaneous water heaters. Solar-compatible instant water heater manufacturers leverage the country's green living tendencies. Products that smoothly connect with solar panels and encourage energy-efficient heating are strategically positioned to appeal to environmentally concerned consumers looking for sustainable home solutions.
Get the data you need at a Fraction of the cost
Personalize your report by choosing insights you need
and save 40%!
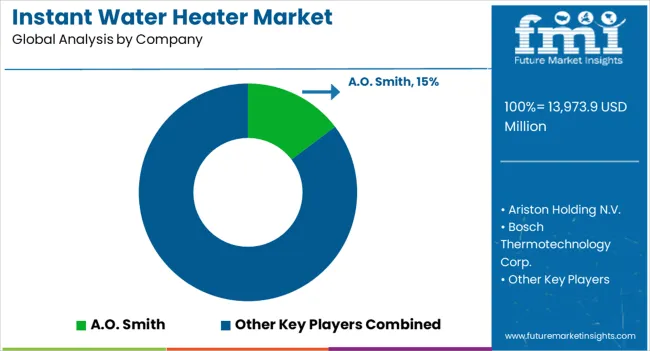
A mix of established firms, new startups, and global rivals defines the instant water heater market's competitive landscape. Companies' strategies are defined by the interaction of elements such as brand recognition, technical innovation, cost competitiveness, global market growth, regulatory compliance, and customer experience as they attempt to protect their positions and prosper in this dynamic market.
Recent Developments
The instant water heater market is valued at US$ 13,920.5 million in 2024.
The instant water heater market is expected to rise at a 4.60% CAGR through 2034.
The instant water heater market size will be US$ 21,825.9 million by 2034.
Electric instant water heaters are in high demand in the industry.
The instant water heater market in India will rise at a 6.10% CAGR through 2034.
1. Executive Summary 1.1. Global Market Outlook 1.2. Demand-side Trends 1.3. Supply-side Trends 1.4. Technology Roadmap Analysis 1.5. Analysis and Recommendations 2. Market Overview 2.1. Market Coverage / Taxonomy 2.2. Market Definition / Scope / Limitations 3. Market Background 3.1. Market Dynamics 3.1.1. Drivers 3.1.2. Restraints 3.1.3. Opportunity 3.1.4. Trends 3.2. Scenario Forecast 3.2.1. Demand in Optimistic Scenario 3.2.2. Demand in Likely Scenario 3.2.3. Demand in Conservative Scenario 3.3. Opportunity Map Analysis 3.4. Product Life Cycle Analysis 3.5. Supply Chain Analysis 3.5.1. Supply Side Participants and their Roles 3.5.1.1. Producers 3.5.1.2. Mid-Level Participants (Traders/ Agents/ Brokers) 3.5.1.3. Wholesalers and Distributors 3.5.2. Value Added and Value Created at Node in the Supply Chain 3.5.3. List of Raw Material Suppliers 3.5.4. List of Existing and Potential Buyer’s 3.6. Investment Feasibility Matrix 3.7. Value Chain Analysis 3.7.1. Profit Margin Analysis 3.7.2. Wholesalers and Distributors 3.7.3. Retailers 3.8. PESTLE and Porter’s Analysis 3.9. Regulatory Landscape 3.9.1. By Key Regions 3.9.2. By Key Countries 3.10. Regional Parent Market Outlook 3.11. Production and Consumption Statistics 3.12. Import and Export Statistics 4. Global Market Analysis 2019 to 2023 and Forecast, 2024 to 2034 4.1. Historical Market Size Value (US$ Million) & Volume (Units) Analysis, 2019 to 2023 4.2. Current and Future Market Size Value (US$ Million) & Volume (Units) Projections, 2024 to 2034 4.2.1. Y-o-Y Growth Trend Analysis 4.2.2. Absolute $ Opportunity Analysis 5. Global Market Analysis 2019 to 2023 and Forecast 2024 to 2034, By Product Type 5.1. Introduction / Key Findings 5.2. Historical Market Size Value (US$ Million) & Volume (Units) Analysis By Product Type, 2019 to 2023 5.3. Current and Future Market Size Value (US$ Million) & Volume (Units) Analysis and Forecast By Product Type, 2024 to 2034 5.3.1. Gas Instant Water Heaters 5.3.2. Electric Instant Water Heaters 5.4. Y-o-Y Growth Trend Analysis By Product Type, 2019 to 2023 5.5. Absolute $ Opportunity Analysis By Product Type, 2024 to 2034 6. Global Market Analysis 2019 to 2023 and Forecast 2024 to 2034, By Application 6.1. Introduction / Key Findings 6.2. Historical Market Size Value (US$ Million) & Volume (Units) Analysis By Application, 2019 to 2023 6.3. Current and Future Market Size Value (US$ Million) & Volume (Units) Analysis and Forecast By Application, 2024 to 2034 6.3.1. Commercial 6.3.2. Residential 6.3.3. Industrial 6.4. Y-o-Y Growth Trend Analysis By Application, 2019 to 2023 6.5. Absolute $ Opportunity Analysis By Application, 2024 to 2034 7. Global Market Analysis 2019 to 2023 and Forecast 2024 to 2034, By Distribution Channel 7.1. Introduction / Key Findings 7.2. Historical Market Size Value (US$ Million) & Volume (Units) Analysis By Distribution Channel, 2019 to 2023 7.3. Current and Future Market Size Value (US$ Million) & Volume (Units) Analysis and Forecast By Distribution Channel, 2024 to 2034 7.3.1. Supermarkets/Hypermarkets 7.3.2. Specialty Stores 7.3.3. Convenience Stores 7.3.4. Online Stores 7.4. Y-o-Y Growth Trend Analysis By Distribution Channel, 2019 to 2023 7.5. Absolute $ Opportunity Analysis By Distribution Channel, 2024 to 2034 8. Global Market Analysis 2019 to 2023 and Forecast 2024 to 2034, By Region 8.1. Introduction 8.2. Historical Market Size Value (US$ Million) & Volume (Units) Analysis By Region, 2019 to 2023 8.3. Current Market Size Value (US$ Million) & Volume (Units) Analysis and Forecast By Region, 2024 to 2034 8.3.1. North America 8.3.2. Latin America 8.3.3. Western Europe 8.3.4. Eastern Europe 8.3.5. South Asia and Pacific 8.3.6. East Asia 8.3.7. Middle East and Africa 8.4. Market Attractiveness Analysis By Region 9. North America Market Analysis 2019 to 2023 and Forecast 2024 to 2034, By Country 9.1. Historical Market Size Value (US$ Million) & Volume (Units) Trend Analysis By Market Taxonomy, 2019 to 2023 9.2. Market Size Value (US$ Million) & Volume (Units) Forecast By Market Taxonomy, 2024 to 2034 9.2.1. By Country 9.2.1.1. USA 9.2.1.2. Canada 9.2.2. By Product Type 9.2.3. By Application 9.2.4. By Distribution Channel 9.3. Market Attractiveness Analysis 9.3.1. By Country 9.3.2. By Product Type 9.3.3. By Application 9.3.4. By Distribution Channel 9.4. Key Takeaways 10. Latin America Market Analysis 2019 to 2023 and Forecast 2024 to 2034, By Country 10.1. Historical Market Size Value (US$ Million) & Volume (Units) Trend Analysis By Market Taxonomy, 2019 to 2023 10.2. Market Size Value (US$ Million) & Volume (Units) Forecast By Market Taxonomy, 2024 to 2034 10.2.1. By Country 10.2.1.1. Brazil 10.2.1.2. Mexico 10.2.1.3. Rest of Latin America 10.2.2. By Product Type 10.2.3. By Application 10.2.4. By Distribution Channel 10.3. Market Attractiveness Analysis 10.3.1. By Country 10.3.2. By Product Type 10.3.3. By Application 10.3.4. By Distribution Channel 10.4. Key Takeaways 11. Western Europe Market Analysis 2019 to 2023 and Forecast 2024 to 2034, By Country 11.1. Historical Market Size Value (US$ Million) & Volume (Units) Trend Analysis By Market Taxonomy, 2019 to 2023 11.2. Market Size Value (US$ Million) & Volume (Units) Forecast By Market Taxonomy, 2024 to 2034 11.2.1. By Country 11.2.1.1. Germany 11.2.1.2. UK 11.2.1.3. France 11.2.1.4. Spain 11.2.1.5. Italy 11.2.1.6. Rest of Western Europe 11.2.2. By Product Type 11.2.3. By Application 11.2.4. By Distribution Channel 11.3. Market Attractiveness Analysis 11.3.1. By Country 11.3.2. By Product Type 11.3.3. By Application 11.3.4. By Distribution Channel 11.4. Key Takeaways 12. Eastern Europe Market Analysis 2019 to 2023 and Forecast 2024 to 2034, By Country 12.1. Historical Market Size Value (US$ Million) & Volume (Units) Trend Analysis By Market Taxonomy, 2019 to 2023 12.2. Market Size Value (US$ Million) & Volume (Units) Forecast By Market Taxonomy, 2024 to 2034 12.2.1. By Country 12.2.1.1. Poland 12.2.1.2. Russia 12.2.1.3. Czech Republic 12.2.1.4. Romania 12.2.1.5. Rest of Eastern Europe 12.2.2. By Product Type 12.2.3. By Application 12.2.4. By Distribution Channel 12.3. Market Attractiveness Analysis 12.3.1. By Country 12.3.2. By Product Type 12.3.3. By Application 12.3.4. By Distribution Channel 12.4. Key Takeaways 13. South Asia and Pacific Market Analysis 2019 to 2023 and Forecast 2024 to 2034, By Country 13.1. Historical Market Size Value (US$ Million) & Volume (Units) Trend Analysis By Market Taxonomy, 2019 to 2023 13.2. Market Size Value (US$ Million) & Volume (Units) Forecast By Market Taxonomy, 2024 to 2034 13.2.1. By Country 13.2.1.1. India 13.2.1.2. Bangladesh 13.2.1.3. Australia 13.2.1.4. New Zealand 13.2.1.5. Rest of South Asia and Pacific 13.2.2. By Product Type 13.2.3. By Application 13.2.4. By Distribution Channel 13.3. Market Attractiveness Analysis 13.3.1. By Country 13.3.2. By Product Type 13.3.3. By Application 13.3.4. By Distribution Channel 13.4. Key Takeaways 14. East Asia Market Analysis 2019 to 2023 and Forecast 2024 to 2034, By Country 14.1. Historical Market Size Value (US$ Million) & Volume (Units) Trend Analysis By Market Taxonomy, 2019 to 2023 14.2. Market Size Value (US$ Million) & Volume (Units) Forecast By Market Taxonomy, 2024 to 2034 14.2.1. By Country 14.2.1.1. China 14.2.1.2. Japan 14.2.1.3. South Korea 14.2.2. By Product Type 14.2.3. By Application 14.2.4. By Distribution Channel 14.3. Market Attractiveness Analysis 14.3.1. By Country 14.3.2. By Product Type 14.3.3. By Application 14.3.4. By Distribution Channel 14.4. Key Takeaways 15. Middle East and Africa Market Analysis 2019 to 2023 and Forecast 2024 to 2034, By Country 15.1. Historical Market Size Value (US$ Million) & Volume (Units) Trend Analysis By Market Taxonomy, 2019 to 2023 15.2. Market Size Value (US$ Million) & Volume (Units) Forecast By Market Taxonomy, 2024 to 2034 15.2.1. By Country 15.2.1.1. GCC Countries 15.2.1.2. South Africa 15.2.1.3. Israel 15.2.1.4. Rest of MEA 15.2.2. By Product Type 15.2.3. By Application 15.2.4. By Distribution Channel 15.3. Market Attractiveness Analysis 15.3.1. By Country 15.3.2. By Product Type 15.3.3. By Application 15.3.4. By Distribution Channel 15.4. Key Takeaways 16. Key Countries Market Analysis 16.1. USA 16.1.1. Pricing Analysis 16.1.2. Market Share Analysis, 2023 16.1.2.1. By Product Type 16.1.2.2. By Application 16.1.2.3. By Distribution Channel 16.2. Canada 16.2.1. Pricing Analysis 16.2.2. Market Share Analysis, 2023 16.2.2.1. By Product Type 16.2.2.2. By Application 16.2.2.3. By Distribution Channel 16.3. Brazil 16.3.1. Pricing Analysis 16.3.2. Market Share Analysis, 2023 16.3.2.1. By Product Type 16.3.2.2. By Application 16.3.2.3. By Distribution Channel 16.4. Mexico 16.4.1. Pricing Analysis 16.4.2. Market Share Analysis, 2023 16.4.2.1. By Product Type 16.4.2.2. By Application 16.4.2.3. By Distribution Channel 16.5. Germany 16.5.1. Pricing Analysis 16.5.2. Market Share Analysis, 2023 16.5.2.1. By Product Type 16.5.2.2. By Application 16.5.2.3. By Distribution Channel 16.6. UK 16.6.1. Pricing Analysis 16.6.2. Market Share Analysis, 2023 16.6.2.1. By Product Type 16.6.2.2. By Application 16.6.2.3. By Distribution Channel 16.7. France 16.7.1. Pricing Analysis 16.7.2. Market Share Analysis, 2023 16.7.2.1. By Product Type 16.7.2.2. By Application 16.7.2.3. By Distribution Channel 16.8. Spain 16.8.1. Pricing Analysis 16.8.2. Market Share Analysis, 2023 16.8.2.1. By Product Type 16.8.2.2. By Application 16.8.2.3. By Distribution Channel 16.9. Italy 16.9.1. Pricing Analysis 16.9.2. Market Share Analysis, 2023 16.9.2.1. By Product Type 16.9.2.2. By Application 16.9.2.3. By Distribution Channel 16.10. Poland 16.10.1. Pricing Analysis 16.10.2. Market Share Analysis, 2023 16.10.2.1. By Product Type 16.10.2.2. By Application 16.10.2.3. By Distribution Channel 16.11. Russia 16.11.1. Pricing Analysis 16.11.2. Market Share Analysis, 2023 16.11.2.1. By Product Type 16.11.2.2. By Application 16.11.2.3. By Distribution Channel 16.12. Czech Republic 16.12.1. Pricing Analysis 16.12.2. Market Share Analysis, 2023 16.12.2.1. By Product Type 16.12.2.2. By Application 16.12.2.3. By Distribution Channel 16.13. Romania 16.13.1. Pricing Analysis 16.13.2. Market Share Analysis, 2023 16.13.2.1. By Product Type 16.13.2.2. By Application 16.13.2.3. By Distribution Channel 16.14. India 16.14.1. Pricing Analysis 16.14.2. Market Share Analysis, 2023 16.14.2.1. By Product Type 16.14.2.2. By Application 16.14.2.3. By Distribution Channel 16.15. Bangladesh 16.15.1. Pricing Analysis 16.15.2. Market Share Analysis, 2023 16.15.2.1. By Product Type 16.15.2.2. By Application 16.15.2.3. By Distribution Channel 16.16. Australia 16.16.1. Pricing Analysis 16.16.2. Market Share Analysis, 2023 16.16.2.1. By Product Type 16.16.2.2. By Application 16.16.2.3. By Distribution Channel 16.17. New Zealand 16.17.1. Pricing Analysis 16.17.2. Market Share Analysis, 2023 16.17.2.1. By Product Type 16.17.2.2. By Application 16.17.2.3. By Distribution Channel 16.18. China 16.18.1. Pricing Analysis 16.18.2. Market Share Analysis, 2023 16.18.2.1. By Product Type 16.18.2.2. By Application 16.18.2.3. By Distribution Channel 16.19. Japan 16.19.1. Pricing Analysis 16.19.2. Market Share Analysis, 2023 16.19.2.1. By Product Type 16.19.2.2. By Application 16.19.2.3. By Distribution Channel 16.20. South Korea 16.20.1. Pricing Analysis 16.20.2. Market Share Analysis, 2023 16.20.2.1. By Product Type 16.20.2.2. By Application 16.20.2.3. By Distribution Channel 16.21. GCC Countries 16.21.1. Pricing Analysis 16.21.2. Market Share Analysis, 2023 16.21.2.1. By Product Type 16.21.2.2. By Application 16.21.2.3. By Distribution Channel 16.22. South Africa 16.22.1. Pricing Analysis 16.22.2. Market Share Analysis, 2023 16.22.2.1. By Product Type 16.22.2.2. By Application 16.22.2.3. By Distribution Channel 16.23. Israel 16.23.1. Pricing Analysis 16.23.2. Market Share Analysis, 2023 16.23.2.1. By Product Type 16.23.2.2. By Application 16.23.2.3. By Distribution Channel 17. Market Structure Analysis 17.1. Competition Dashboard 17.2. Competition Benchmarking 17.3. Market Share Analysis of Top Players 17.3.1. By Regional 17.3.2. By Product Type 17.3.3. By Application 17.3.4. By Distribution Channel 18. Competition Analysis 18.1. Competition Deep Dive 18.1.1. Vaillant Group 18.1.1.1. Overview 18.1.1.2. Product Portfolio 18.1.1.3. Profitability by Market Segments 18.1.1.4. Sales Footprint 18.1.1.5. Strategy Overview 18.1.1.5.1. Marketing Strategy 18.1.1.5.2. Product Strategy 18.1.1.5.3. Channel Strategy 18.1.2. Ariston Group 18.1.2.1. Overview 18.1.2.2. Product Portfolio 18.1.2.3. Profitability by Market Segments 18.1.2.4. Sales Footprint 18.1.2.5. Strategy Overview 18.1.2.5.1. Marketing Strategy 18.1.2.5.2. Product Strategy 18.1.2.5.3. Channel Strategy 18.1.3. Rheem Manufacturing 18.1.3.1. Overview 18.1.3.2. Product Portfolio 18.1.3.3. Profitability by Market Segments 18.1.3.4. Sales Footprint 18.1.3.5. Strategy Overview 18.1.3.5.1. Marketing Strategy 18.1.3.5.2. Product Strategy 18.1.3.5.3. Channel Strategy 18.1.4. Nihon Itomic 18.1.4.1. Overview 18.1.4.2. Product Portfolio 18.1.4.3. Profitability by Market Segments 18.1.4.4. Sales Footprint 18.1.4.5. Strategy Overview 18.1.4.5.1. Marketing Strategy 18.1.4.5.2. Product Strategy 18.1.4.5.3. Channel Strategy 18.1.5. Whirlpool Corporation 18.1.5.1. Overview 18.1.5.2. Product Portfolio 18.1.5.3. Profitability by Market Segments 18.1.5.4. Sales Footprint 18.1.5.5. Strategy Overview 18.1.5.5.1. Marketing Strategy 18.1.5.5.2. Product Strategy 18.1.5.5.3. Channel Strategy 18.1.6. General Electric 18.1.6.1. Overview 18.1.6.2. Product Portfolio 18.1.6.3. Profitability by Market Segments 18.1.6.4. Sales Footprint 18.1.6.5. Strategy Overview 18.1.6.5.1. Marketing Strategy 18.1.6.5.2. Product Strategy 18.1.6.5.3. Channel Strategy 18.1.7. Havells India Ltd 18.1.7.1. Overview 18.1.7.2. Product Portfolio 18.1.7.3. Profitability by Market Segments 18.1.7.4. Sales Footprint 18.1.7.5. Strategy Overview 18.1.7.5.1. Marketing Strategy 18.1.7.5.2. Product Strategy 18.1.7.5.3. Channel Strategy 18.1.8. A.O. Smith Corporation 18.1.8.1. Overview 18.1.8.2. Product Portfolio 18.1.8.3. Profitability by Market Segments 18.1.8.4. Sales Footprint 18.1.8.5. Strategy Overview 18.1.8.5.1. Marketing Strategy 18.1.8.5.2. Product Strategy 18.1.8.5.3. Channel Strategy 18.1.9. Bradford White Corporation 18.1.9.1. Overview 18.1.9.2. Product Portfolio 18.1.9.3. Profitability by Market Segments 18.1.9.4. Sales Footprint 18.1.9.5. Strategy Overview 18.1.9.5.1. Marketing Strategy 18.1.9.5.2. Product Strategy 18.1.9.5.3. Channel Strategy 18.1.10. Ferroli 18.1.10.1. Overview 18.1.10.2. Product Portfolio 18.1.10.3. Profitability by Market Segments 18.1.10.4. Sales Footprint 18.1.10.5. Strategy Overview 18.1.10.5.1. Marketing Strategy 18.1.10.5.2. Product Strategy 18.1.10.5.3. Channel Strategy 19. Assumptions & Acronyms Used 20. Research Methodology
Explore Consumer Product Insights
View Reports