The Water Softener Market is estimated to be valued at USD 3.9 billion in 2025 and is projected to reach USD 8.7 billion by 2035, registering a compound annual growth rate (CAGR) of 8.3% over the forecast period.
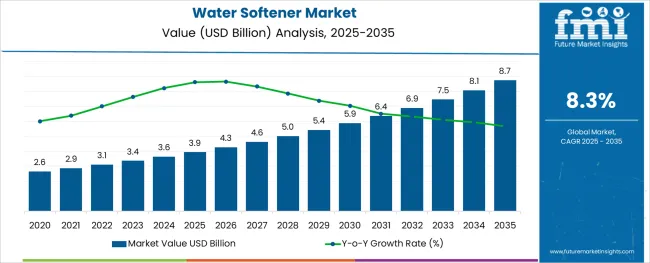
The water softener market is witnessing substantial growth as hard water issues continue to impact appliance longevity, plumbing infrastructure, and health outcomes across residential and commercial settings. Escalating concerns about water hardness and limescale buildup have led to increased adoption of smart water softening solutions, particularly in urban and semi-urban households. Advancements in automated controls, sensor-based regeneration, and connectivity with home management systems are making water softeners more intelligent and user-centric.
The market is also benefiting from growing investments in sustainable water management infrastructure, including efficient regeneration techniques and salt-reducing systems. Increasing product availability through e-commerce platforms and expansion into emerging economies are providing new growth avenues.
Regulatory standards on water quality, coupled with awareness campaigns from utility providers and manufacturers, are further encouraging consumer adoption. Future growth is expected to be reinforced by the combination of digital integration, energy efficiency mandates, and rising demand from regions with hard groundwater supplies.
The market is segmented by Product Type, Process, and End User and region. By Product Type, the market is divided into Electric and Manual. In terms of Process, the market is classified into Ion exchange, Distillation, and Reverse osmosis.
Based on End User, the market is segmented into Residential, Commercial, and Industrial. Regionally, the market is classified into North America, Latin America, Western Europe, Eastern Europe, Balkan & Baltic Countries, Russia & Belarus, Central Asia, East Asia, South Asia & Pacific, and the Middle East & Africa.
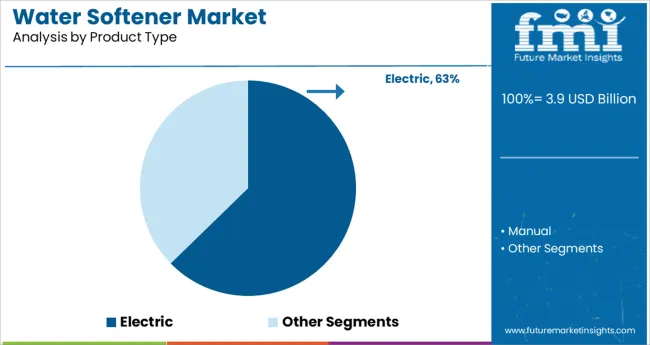
The electric product type segment is projected to contribute 62.7% of the total revenue in 2025, establishing itself as the leading category. This position has been strengthened by the growing preference for automation, programmability, and energy-efficient operations in water softening systems.
Electric softeners offer precise control over regeneration cycles and real-time monitoring of water hardness levels, which enhances overall efficiency and minimizes wastage. The convenience of automated performance, coupled with the integration of smart sensors and digital displays, has positioned electric systems as the preferred choice for tech-savvy consumers and commercial users alike.
As awareness grows regarding the long-term cost benefits and optimized salt usage of electric models, adoption has accelerated across developed markets. Their compatibility with residential and light commercial plumbing systems has also widened their application scope, contributing to their dominant share in the market.
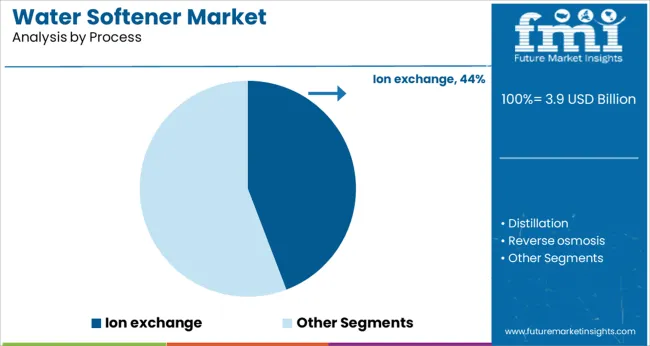
The ion exchange segment is anticipated to account for 44.2% of the market revenue in 2025, making it the leading process type. Its leadership is driven by the process’s reliability, affordability, and long-standing usage in domestic and industrial water softening applications.
This method effectively replaces calcium and magnesium ions with sodium or potassium ions, resulting in softened water suitable for various end-use applications. The operational simplicity and proven performance of ion exchange systems have led to their wide acceptance, particularly in markets with high water hardness levels.
In addition, recent innovations have focused on improving resin durability and optimizing brine usage, enhancing the overall sustainability of the process. The adaptability of ion exchange systems across different water quality conditions and flow requirements has further supported its continued dominance in both centralized and point-of-entry softener installations.
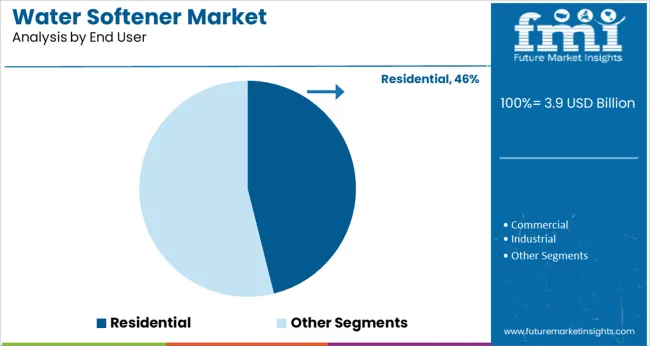
The residential segment is projected to capture 46.1% of the market revenue in 2025, positioning it as the dominant end user. This is primarily attributed to the increasing awareness among homeowners regarding the negative effects of hard water on plumbing systems, home appliances, and personal care. Urbanization and rising disposable incomes have enabled a growing number of consumers to invest in home-based water treatment solutions.
Residential users are particularly drawn to compact, user-friendly systems that require minimal maintenance and can be integrated into existing plumbing setups. The emergence of smart softeners that offer app-based monitoring, customized regeneration, and leak detection is accelerating adoption in this segment.
Additionally, targeted marketing campaigns and increased product availability through retail and online platforms have expanded consumer reach. With rising concerns about water quality and a shift toward in-home sustainability, the residential segment is expected to maintain its lead in the foreseeable future.
Drivers:
The demand for water softener is expected to be driven by the increasing awareness of the ill effect of hard water on regular usage. Due to research and development, manufacturers have produced more efficient and less resource-consuming water softeners. This is anticipated to increase the water softener market share during the forecast period.
The increasing population in the urban arrangements has raised the water hardness of the groundwater, which is expected to increase the demand for water softener in such regions during the forecast period.
Restraints:
Some of the water softener market restraints are as follows:
Based on type, the water softener market is segmented into electric and manual. The electric segment is expected to dominate the global water softener market share owing to its higher efficiency and added functionalities.
The manual segment is expected to see substantial demand in the low-income regions owing to its lower price than the electric water softener segment.
Based on the process, the water softener market is segmented into ion exchange, distillation, and reverse osmosis. The ion exchange segment is expected to dominate the global water softener market size owing to its higher efficiency.
The regional segments are further divided into North America, Europe, MEA, Latin America and Asia-Pacific. The Europe region is likely to grow the water softener market by acquiring 31.2% of the share all around the region during the forecast period.
Due to rising strict regulations regarding water purity, various sectors including pharmaceuticals, refineries, and chemical factories among others are likely to fuel the water softener market share.
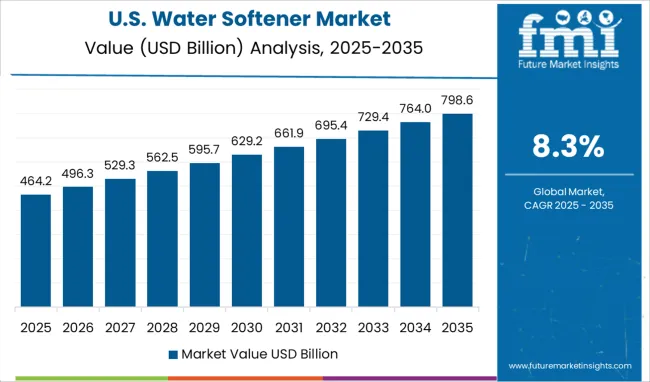
The North American region is likely to dominate the water softener market by acquiring 39.8% of the share all around the region during the forecast period.
Due to rising polluted hard water and unsafe health likely to rise the adoption of water softener in the coming period. The manufacturers are making several technologies related to increasing the sales of water softener to get rid of polluted water all around the globe.
The water softener start-up companies are coming up with unique solutions and advantages during the forecast period. They are investing their time to innovate products, which provide quality products for the end-use industries.
One of the start-ups named Nirvana Water Sciences has developed the best water purity by taking care of the environment. They are using scientific innovative technology, which is beneficial to health. The company offers real, transparent, and legitimately beneficial to expand the water softener market growth in the coming years.
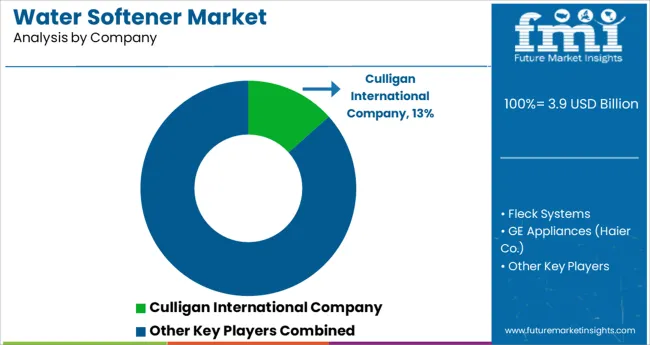
The water softener market is fragmented by the key players, which are helping to push the market by acquiring maximum revenue. The players along with manufacturing industry leaders are using various key factors, technology and marketing strategies to grow the water softener market.
They are adopting acquisitions, mergers, product launches, partnerships and others to increase the sales of water softener during the forecast period.
Recent Developments in the Water Softener Market are:
3G AQUA is the fastest growing water softener company that launched its new product with super 5G AQUA technology. The company innovates water treatment systems with its new and innovative ideas with its natural conditioning system.
| Report Attribute | Details |
|---|---|
| Growth Rate | CAGR of 8.3% from 2025 to 2035 |
| Base Year for Estimation | 2024 |
| Historical Data | 2020 to 2024 |
| Forecast Period | 2025 to 2035 |
| Quantitative Units | Revenue in million and CAGR from 2025 to 2035 |
| Report Coverage | Revenue Forecast, Volume Forecast, Company Ranking, Competitive Landscape, Growth Factors, Trends and Pricing Analysis |
| Segments Covered |
Product Type, Process, End User, Region |
| Regions Covered |
North America; Latin America; Europe; Asia-Pacific; Middle East and Africa |
| Key Countries Profiled | USA, Canada, Brazil, Argentina, German, UK, France, Spain, Italy, Nordics, BENELUX, Australia & New Zealand, China, India, ASEAN, GCC, South Africa |
| Key Companies Profiled | Culligan International Company; Fleck Systems; GE Appliances (Hair Co.); Morton (K+S Group); NuvoH20, LLC.; Watercare Softeners Ltd.; Kinetico UK Ltd |
| Customization | Available Upon Request |
The global water softener market is estimated to be valued at USD 3.9 billion in 2025.
It is projected to reach USD 8.7 billion by 2035.
The market is expected to grow at a 8.3% CAGR between 2025 and 2035.
The key product types are electric and manual.
ion exchange segment is expected to dominate with a 44.2% industry share in 2025.


Our Research Products

The "Full Research Suite" delivers actionable market intel, deep dives on markets or technologies, so clients act faster, cut risk, and unlock growth.

The Leaderboard benchmarks and ranks top vendors, classifying them as Established Leaders, Leading Challengers, or Disruptors & Challengers.

Locates where complements amplify value and substitutes erode it, forecasting net impact by horizon

We deliver granular, decision-grade intel: market sizing, 5-year forecasts, pricing, adoption, usage, revenue, and operational KPIs—plus competitor tracking, regulation, and value chains—across 60 countries broadly.

Spot the shifts before they hit your P&L. We track inflection points, adoption curves, pricing moves, and ecosystem plays to show where demand is heading, why it is changing, and what to do next across high-growth markets and disruptive tech

Real-time reads of user behavior. We track shifting priorities, perceptions of today’s and next-gen services, and provider experience, then pace how fast tech moves from trial to adoption, blending buyer, consumer, and channel inputs with social signals (#WhySwitch, #UX).

Partner with our analyst team to build a custom report designed around your business priorities. From analysing market trends to assessing competitors or crafting bespoke datasets, we tailor insights to your needs.
Supplier Intelligence
Discovery & Profiling
Capacity & Footprint
Performance & Risk
Compliance & Governance
Commercial Readiness
Who Supplies Whom
Scorecards & Shortlists
Playbooks & Docs
Category Intelligence
Definition & Scope
Demand & Use Cases
Cost Drivers
Market Structure
Supply Chain Map
Trade & Policy
Operating Norms
Deliverables
Buyer Intelligence
Account Basics
Spend & Scope
Procurement Model
Vendor Requirements
Terms & Policies
Entry Strategy
Pain Points & Triggers
Outputs
Pricing Analysis
Benchmarks
Trends
Should-Cost
Indexation
Landed Cost
Commercial Terms
Deliverables
Brand Analysis
Positioning & Value Prop
Share & Presence
Customer Evidence
Go-to-Market
Digital & Reputation
Compliance & Trust
KPIs & Gaps
Outputs
Full Research Suite comprises of:
Market outlook & trends analysis
Interviews & case studies
Strategic recommendations
Vendor profiles & capabilities analysis
5-year forecasts
8 regions and 60+ country-level data splits
Market segment data splits
12 months of continuous data updates
DELIVERED AS:
PDF EXCEL ONLINE
Brine Tank for Water Softener Market Size and Share Forecast Outlook 2025 to 2035
Water Vapor Permeability Analyzers Market Size and Share Forecast Outlook 2025 to 2035
Water and Waste Water Treatment Chemical Market Size and Share Forecast Outlook 2025 to 2035
Water-cooled Walk-in Temperature & Humidity Chamber Market Size and Share Forecast Outlook 2025 to 2035
Waterless Bathing Solution Market Size and Share Forecast Outlook 2025 to 2035
Water Treatment System Market Size and Share Forecast Outlook 2025 to 2035
Waterborne UV Curable Resin Market Size and Share Forecast Outlook 2025 to 2035
Water Treatment Chemical Market Size and Share Forecast Outlook 2025 to 2035
Water Adventure Tourism Market Forecast and Outlook 2025 to 2035
Water Packaging Market Forecast and Outlook 2025 to 2035
Water Soluble Bag Market Size and Share Forecast Outlook 2025 to 2035
Water Leak Sensors Market Size and Share Forecast Outlook 2025 to 2035
Water-soluble Packaging Market Size and Share Forecast Outlook 2025 to 2035
Water Leak Detection System for Server Rooms and Data Centers Market Size and Share Forecast Outlook 2025 to 2035
Water and Wastewater Treatment Equipment Market Size and Share Forecast Outlook 2025 to 2035
Water Treatment Market Size and Share Forecast Outlook 2025 to 2035
Water Underfloor Heating Thermostat Market Size and Share Forecast Outlook 2025 to 2035
Water Activity Meter Market Size and Share Forecast Outlook 2025 to 2035
Water Leakage Tester Market Size and Share Forecast Outlook 2025 to 2035
Waterstops Market Size and Share Forecast Outlook 2025 to 2035

Thank you!
You will receive an email from our Business Development Manager. Please be sure to check your SPAM/JUNK folder too.
Chat With
MaRIA