The Water Packaging Market is estimated to be valued at USD 27.4 billion in 2025 and is projected to reach USD 35.0 billion by 2035, registering a compound annual growth rate (CAGR) of 2.5% over the forecast period.
The Water Packaging market is experiencing significant growth, driven by increasing consumer demand for convenient, portable, and safe drinking water solutions. Rising health awareness, urbanization, and on-the-go lifestyles have accelerated the adoption of packaged water across various demographic segments. The market is further supported by growing investments in advanced packaging technologies, including sustainable materials and tamper-evident designs, which enhance product safety and shelf life.
Plastic and glass packaging solutions, along with innovations in lightweight and ergonomic designs, have strengthened convenience for consumers while maintaining hygiene standards. Regulatory emphasis on water quality, labeling, and food safety compliance is reinforcing industry adoption and driving manufacturers to implement robust quality management systems.
The rising demand for packaged water in households, workplaces, and recreational environments continues to expand the market As sustainability concerns and circular economy initiatives gain momentum, manufacturers are increasingly exploring recyclable and biodegradable packaging materials, ensuring continued growth and long-term market resilience.
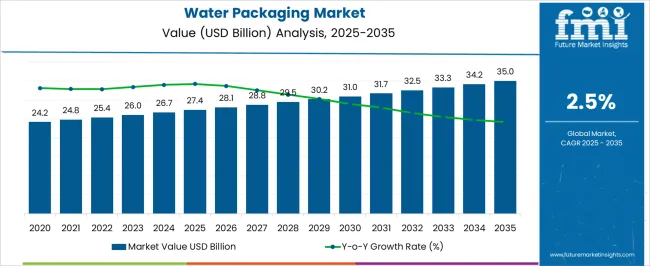
| Metric | Value |
|---|---|
| Water Packaging Market Estimated Value in (2025 E) | USD 27.4 billion |
| Water Packaging Market Forecast Value in (2035 F) | USD 35.0 billion |
| Forecast CAGR (2025 to 2035) | 2.5% |
The market is segmented by Packaging Format, Material, and End Use and region. By Packaging Format, the market is divided into Bottle, Cans, Pouches, and Cup. In terms of Material, the market is classified into Plastic, Metal, and Glass. Based on End Use, the market is segmented into Everyday, Sports, and Travel. Regionally, the market is classified into North America, Latin America, Western Europe, Eastern Europe, Balkan & Baltic Countries, Russia & Belarus, Central Asia, East Asia, South Asia & Pacific, and the Middle East & Africa.
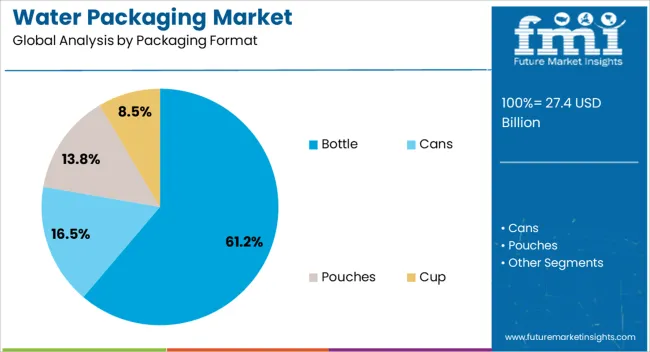
The bottle packaging format segment is projected to hold 61.2% of the market revenue in 2025, establishing it as the leading packaging format. Growth in this segment is being driven by consumer preference for portability, ease of use, and convenience in daily hydration. Bottles allow for secure sealing, long shelf life, and compatibility with both carbonated and non-carbonated water, which enhances consumer confidence.
Technological advancements in lightweight and ergonomically designed bottles further improve handling and transport efficiency. The ability to produce bottles at scale with consistent quality has strengthened their adoption across retail and commercial distribution channels.
Sustainability initiatives, including increased use of recycled plastics and recyclable packaging, are also encouraging adoption As consumers increasingly seek convenient and safe drinking water solutions for everyday use, bottles are expected to maintain their leading position, supported by versatility, operational efficiency, and alignment with regulatory and environmental requirements.
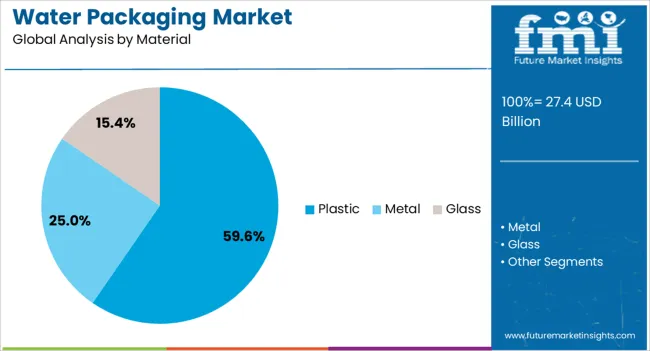
The plastic material segment is expected to account for 59.6% of the market revenue in 2025, making it the leading material category. Plastic is preferred due to its lightweight nature, durability, cost-effectiveness, and ease of molding into various bottle sizes and designs. It allows for secure sealing, tamper-evident closures, and extended shelf life, which is essential for maintaining water quality and safety.
Advancements in food-grade and recyclable plastics are enhancing consumer confidence while supporting environmental sustainability goals. Plastic packaging also facilitates mass production and wide distribution at lower operational costs compared to alternative materials, making it ideal for meeting large-scale consumer demand.
Manufacturers increasingly focus on reducing environmental impact through recycled content, bio-based plastics, and efficient recycling initiatives As convenience and portability remain high priorities for consumers, the plastic material segment is expected to retain its market leadership, driven by versatility, affordability, and alignment with industry standards and regulations.
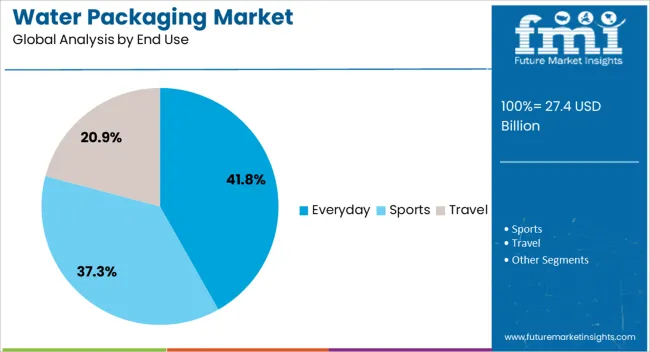
The everyday end-use segment is projected to hold 41.8% of the market revenue in 2025, establishing it as the leading end-use category. Growth in this segment is driven by increasing consumer reliance on packaged water for daily hydration at home, workplaces, and during travel. Convenience, portability, and perceived hygiene benefits are key factors influencing adoption.
Packaged water for everyday use is frequently integrated into lifestyle routines, particularly among urban populations and health-conscious consumers. Manufacturers are responding by offering varied bottle sizes, ergonomic designs, and innovative closures to improve user experience and accessibility.
The segment is further supported by widespread retail availability, including supermarkets, convenience stores, and vending machines, enabling easy access to consumers As demand for reliable, safe, and convenient hydration solutions continues to rise, the everyday end-use segment is expected to remain the primary revenue driver, underpinned by consumer preference, regulatory compliance, and advancements in packaging design and materials.
From 2020 to 2025, the water packaging market experienced a CAGR of 3.2%. A sharp increase in bottled water sales was recorded in recent years when consumers steadily opted for convenience and portability while keeping hydrated.
| Historical CAGR (2020 to 2025) | 3.2% |
|---|---|
| Forecast CAGR (2025 to 2035) | 2.5% |
Globally, bottled water sales rose to the highest point due to concerns about the safety of tap water, increasing levels of health care, and a rising trend toward individualism.
Packaging innovation played a significant role in shaping the water packaging market. Manufacturers have introduced lightweight bottles with environment-friendly packaging material and convenient packaging format to enhance the appeal of the product. Consumers seeking healthy and functional beverage options are forecasted to maintain the robust growth in the water packaging market.
The makers will mainly come up with the water products that give out the healthy aspects, the natural aspect and the nutritional aspects to meet the rising and diverse consumer tastes. Projections indicate that the global water packaging market is expected to experience a CAGR of 2.5% from 2025 to 2035.
The provided table highlights the top five countries in terms of revenue, with China and India leading the list. Based on a comprehensive analysis, India presents a substantial opportunity due to the strong presence of fermented food and beverage manufacturers.
| Countries | The Forecast CAGRs from 2025 to 2035 |
|---|---|
| The United States | 2.3% |
| The United Kingdom | 2.5% |
| China | 5.7% |
| Japan | 2.6% |
| India | 6.5% |
The water packing market in the United States is poised to register a CAGR of 2.3%. The water-packing market growth in the United States is attributed to the increasing awareness among consumers regarding the importance of hydration and the health benefits of drinking water.
Increasing demand for packaged water products, especially single-serve bottles, enhances the growth of this market in the country. Packed water's easy availability in various formats contributes to market growth.
The water packing market in the United Kingdom is poised for substantial growth, with a 2.5% CAGR from 2025 to 2035. Growth is expected to be driven by evolving consumer preferences and sustainability initiatives.
There is a notable shift in consumer preferences toward packaged water products, encompassing still, and sparkling, flavored, and functional waters. The evolving landscape is contributing significantly to market growth. Increasing demand for single-serve bottles and pouches is driving the market growth in the United Kingdom.
The water packing market in China is expected to register a CAGR of 5.7%. Increasing consumer awareness of health and wellness and a growing focus on hydration benefits are driving the market demand in China.
With China’s rapid urbanization, consumers are opting for convenient and on-the-go hydration solutions. Packed water, especially in single-serve bottles or pouches, is in more demand in the country.
Concern over contaminated or polluted water makes Chinese consumers consider packed water a more dependable and safer alternative. Packed water is safe, hygienic, and clean, one of the main factors propelling the market’s expansion.
Japan's water packaging market is expected to register a CAGR of 2.6% between 2025 and 2035.
Many Japanese consumers now choose packaged water, such as bottled mineral water and purified water, due to worries about the safety and contamination of tap water, contributing to market growth in the country.
Japan’s thriving tourism industry creates significant demand for bottled water among domestic and international travelers, boosting market growth.
The water packaging market is expected to register a CAGR of 6.5% between 2025 and 2035 in India.
The rise of e-commerce platforms and delivery services in India has made it easier for consumers to purchase packed water online and deliver it directly to their homes or workplaces. This factor contributes to market growth. Fast-paced lifestyle and high urbanization rates contribute to the demand for convenient hydration solutions.
Health and well-being encouraging trends among Indian consumers attracted more people to opt for packed water. Bottled water is the most favored choice of beverage by consumers who believe they will be healthier with it, and therefore, more water will be used up individually as they would have resorted to sodas and other unhealthy drinks.
The section below shows the leading segment. The bottles segment is expected to account for a market share of 61.2% in 2025. Based on material and plastic, the segment is expected to have a share of 59.6%.
| Category | Market Share |
|---|---|
| Bottle | 61.2% |
| Plastic | 59.6% |
The bottling segment emerged as the dominant force in the water packaging market, commanding 61.2% of the total market share in 2025.
Bottled water is a source for those people who are commuting, exercising, or traveling. It is made to offer a solution for hydration with added convenience without the need for any other equipment or preparation.
PET bottles are the optimal package for customers as they are light and compact. They are easy to move around simply and drinks could be consumed everywhere easily.
A uniform packing system in the form of bottles ensures the trustworthiness of the product and the manufacturer. It gives customers confidence that the product is safe and not altering its form. The water maintained in the rounded neck bottles is provided with seals and a barrier, which helps with proper hygiene and safety.
Based on material type, the plastic segment is expected to account for a market share of 59.6% in 2025. Plastics are an affordable medium for packaging water. While compared with other alternatives like glass metal, plastic bottles are more cost-effective to create, which benefits both consumers and manufacturers.
Plastic bottles are lighter, lowering the shipping cost and carbon emission. Because of this, plastic bottles are well suited for extensive distribution and long-distance transportation networks.
Plastic packaging is well-known for its hardness and shattering resistance. The possibility of breaking the packaging while handling, moving, and storing is very low.
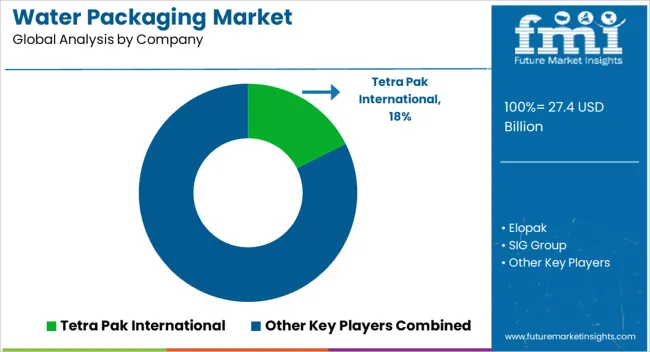
The global water packaging market is highly fragmented and competitive owing to various global and local players across the globe. Market players maintain high product quality, safety standards, and regulatory compliance to build consumer trust and confidence.
Company operators are more committed to environmentally sound and recyclable materials, waste reduction methods, and carbon footprint decrease in their processes to be in tandem with consumer behavior and environmental regulations.
Resolving green issues and producing sustainable packaging are becoming criteria for top consumer brands whose target audience is environment-concerned people.
| Attributes | Details |
|---|---|
| Estimated Market Size in 2025 | USD 27.4 billion |
| Projected Market Valuation in 2035 | USD 35.0 billion |
| Value-based CAGR 2025 to 2035 | 2.5% |
| Forecast Period | 2025 to 2035 |
| Historical Data Available for | 2020 to 2025 |
| Market Analysis | Value in USD billion |
| Key Regions Covered | North America; Latin America; Western Europe; Eastern Europe; South Asia and Pacific; East Asia; The Middle East and Africa |
| Key Market Segments Covered | Packaging Format, Material, End-Use, Region |
| Key Countries Profiled | The United States, Canada, Brazil, Mexico, Germany, The United Kingdom, France, Spain, Italy, Russia, Poland, Czech Republic, Romania, India, Bangladesh, Australia, New Zealand, China, Japan, South Korea, GCC countries, South Africa, Israel |
| Key Companies Profiled | Tetra Pak International; Elopak; SIG Group; Adam Pack; Stora Enso Oyj; LamiPak; Sidel International; Silgan Holdings |
The global water packaging market is estimated to be valued at USD 27.4 billion in 2025.
The market size for the water packaging market is projected to reach USD 35.0 billion by 2035.
The water packaging market is expected to grow at a 2.5% CAGR between 2025 and 2035.
The key product types in water packaging market are bottle, cans, pouches and cup.
In terms of material, plastic segment to command 59.6% share in the water packaging market in 2025.


Full Research Suite comprises of:
Market outlook & trends analysis
Interviews & case studies
Strategic recommendations
Vendor profiles & capabilities analysis
5-year forecasts
8 regions and 60+ country-level data splits
Market segment data splits
12 months of continuous data updates
DELIVERED AS:
PDF EXCEL ONLINE
Waterproof Packaging Market Trends - Demand & Industry Forecast 2025 to 2035
Water-soluble Packaging Market Size and Share Forecast Outlook 2025 to 2035
Competitive Breakdown of Water-Soluble Packaging Companies
Water Resistant Packaging Market Size and Share Forecast Outlook 2025 to 2035
Water Soluble Pods Packaging Market Analysis by Material Type, Product Type, End Use, Thickness Type, and Region Forecast Through 2035
Water Soluble Pods and Capsules Packaging Market Size and Share Forecast Outlook 2025 to 2035
Bottled Water Packaging Market Size and Share Forecast Outlook 2025 to 2035
Digital Watermark Packaging Market Analysis - Size, Share, and Forecast Outlook 2025 to 2035
Water and Waste Water Treatment Chemical Market Size and Share Forecast Outlook 2025 to 2035
Water-cooled Walk-in Temperature & Humidity Chamber Market Size and Share Forecast Outlook 2025 to 2035
Waterless Bathing Solution Market Size and Share Forecast Outlook 2025 to 2035
Water Treatment System Market Size and Share Forecast Outlook 2025 to 2035
Waterborne UV Curable Resin Market Size and Share Forecast Outlook 2025 to 2035
Water Treatment Chemical Market Size and Share Forecast Outlook 2025 to 2035
Water Adventure Tourism Market Forecast and Outlook 2025 to 2035
Water Soluble Bag Market Size and Share Forecast Outlook 2025 to 2035
Water Leak Sensors Market Size and Share Forecast Outlook 2025 to 2035
Water Leak Detection System for Server Rooms and Data Centers Market Size and Share Forecast Outlook 2025 to 2035
Water and Wastewater Treatment Equipment Market Size and Share Forecast Outlook 2025 to 2035
Water Treatment Market Size and Share Forecast Outlook 2025 to 2035

Thank you!
You will receive an email from our Business Development Manager. Please be sure to check your SPAM/JUNK folder too.
Chat With
MaRIA