Water Adventure Tourism Market
Market Insights on Water Adventure Tourism covering sales outlook, demand forecast & up-to-date key trends
Water Adventure Tourism Market by Tourist Type, Activity Type, Age Group & Region - Forecast 2022 – 2032
Water Adventure Tourism Market Outlook (2022-2032)
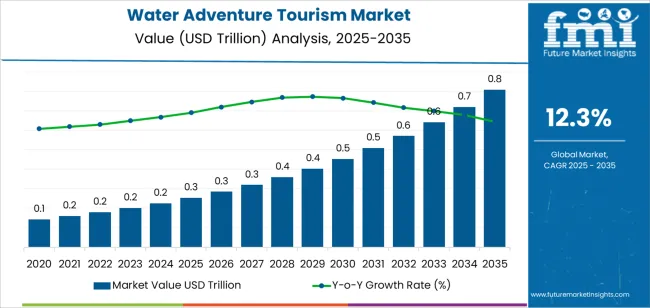
[324 Pages Report] The global water adventure tourism market is projected to reach US$ 845.8 Billion by 2032, up from US$ 156.9 Billion in 2022, progressing at a CAGR of 16.9% during the forecast period.
Report Attribute |
Details |
Water Adventure Tourism Market Value (2022) |
US$ 156.9 Billion |
Water Adventure Tourism Market Anticipated Value (2032) |
US$ 845.8 Billion |
Water Adventure Tourism Projected Growth Rate (2022-2032) |
16.9% |
The demand for water adventure tourism is on the rise owing to faster increase in trend to witness adventure sports and indulging in activities which have an additional thrill factor on a vacation. This is said to propel the water adventure tourism market. The revenue generated by the water adventure tourism industry was approximately 0.2% of the global Gross Domestic Product in the year 2019.
Adventure tourism is an umbrella which has several types of other tourism under it and water adventure tourism is considered as the most thrilling ones. Water adventure or water-based tourism refers to tourist activities carried out at any water resources such as lakes, dams, back waters, seas, coastal zones, oceans, and creeks.
The demand for water adventure tourism is surging as across the globe many water sports enthusiasts look forward to exploring soft as well as hard water-based activities and adventures such as kayaking, canoeing, water-skiing, river rafting, scuba diving, etc. It is a niche type of tourism which involves traveling and exploring unfamiliar, remote, exotic and wilderness locations.
Increase in disposable income and higher expenditure are some of the primary factors which ultimately influence the lucrative growth of the water adventure tourism market. The demand for water adventure is gaining popularity as a greater number of individuals are seeking for water sports and they travel out of the way to experience thrilling water-based activities.
The increasing demand for personalized and authentic traveling experience because of rapid urbanization, better disposable incomes, cost-efficient air travel tickets, and increasing social media influence are some of the primary factors promoting the water adventure tourism market growth. Besides, various travel companies across the world are establishing user- and mobile-friendly websites which are easily navigated through smartphones; this too boosts the growth of the global market.
Let us know your requirement to get
100% FREE customization
Key Drivers and Restraining factors in the Water Adventure Tourism Market
There are several factors that are contributing to the increasing popularity of water adventure tourism or water-based tourism across the globe, especially post the COVID-19 pandemic which hit this industry hard in the past two years.
Population across the world is keener on engaging in thrilling and risky adventures as compared to boring tours with less activities. Increasing disposable income has accelerated the growth in tourism across the world. Better income and spending power are factors promoting the water adventure tourism market growth.
Introduction of novel and enhanced technology and other developments in water sport equipment have strengthened individual’s safety owing to this globally there is an increased participation in water adventure activities, expanding the horizon of water adventure sports and therefore positively impacting the global water adventure tourism market.
The popularity of increasing water-based activities has resulted in rise in skilled professionals and trainers well-versed with handling the water sports equipment are available to guide and assist the tourists, impart technical know-hows and knowledge to use the underwater equipment with ease and confidence.
The demand for water adventure tourism and its popularity is increasing as novel standards are being established in terms of maintaining and inspecting the equipment, functioning instructions and standard operating procedures, risk mitigation, emergencies and rescue procedures, guides and instructors, and training.
Increased social media and advertising has resulted in the water adventure tourism industry to reach out to individuals across the world. This has lucratively impacted the market share of water adventure tourism.
Escalating number of water theme parks has promoted the growth of water adventure tourism sector. Soft and hard water adventure tourism contributes to the most needed physical exertion coupled with swift thinking.
Several families and individuals now travel to particular destinations such as California for kayaking, Spain for wind surfing, Malaysia for white water rafting, and Brisbane for scuba diving in order to experience the respective sport in the best setting. This craze of experiencing water sports with best possible setup is boosting the water adventure tourism market.
The increasing popularity of water sports across known destinations have forced governments to develop the infrastructure of those areas to attract vacationers and tourists. Governments are investing on Resorts, boardwalk, luxury hotels, and cafes for further development. Such measures propel the growth of water adventure tourism market.
Travelers are gradually getting affiliated with adventure activities and rarely leave without a tablet or phone to capture their adventure moment or keep in touch with family and friends. This increasing trend is breaking down geographic limits and letting explorers to stroll further abroad than before.
Just like any other tourism segment, the water adventure tourism industry too faces certain challenges. Even though the demand for water sports is increasing, there are various issues faced by tourists in terms of risk management, faulty equipment during manufacturing, etc. The water sports agencies can also experience problems with respect to misconduct of the tourists, tour managements issues, overall resources, and trip cancellations.
Regional Insights of Water Adventure Tourism Market
Regionally, Europe and North America are said to dominate the water adventure tourism market. Individuals’ inclination to encounter thrilling water activities is the primary factor contributing to the growth of water adventure tourism market. For thrill and adventure, people of all ages which includes senior citizens are said to witness risky water sports on vacation.
Furthermore, the reason individuals are getting attracted to witness these thrilling activities is that governments of these regions are taking initiatives to develop water sports and taking in consideration the appropriate safety measures to avoid any accidents. This is further promoting the growth of water adventure tourism market in North America and Europe.
Besides these regions, Asia Pacific is said to emerge and gain good market share in the water adventure tourism market. Increasing disposable income in emerging countries of this region have resulted in more expenditure on expensive vacations for varied experiences. In developing countries individuals who reside in urban areas opt for vacationing at least two to three times in a year and one such vacation surely includes water adventure sports. This is said to further promote the water adventure tourism in Asia Pacific.
Find your sweet spots for generating winning opportunities in this market.
Talk to AnalystKey Developments in the Water Adventure Tourism Market
Key players operating the water market are embracing pioneering growth strategies and some of the key developments in the water adventure tourism market are:
- In June 2021, Project Expedition partnered with Travel Agent Next Door for tours, day trips, and excursions.
- Haryana government, in year 2021 announced that the ‘Flying Milkha Singh Club’ for training youth in adventurous sports will soon be set up at Morni Hills, Panchkula.
Who are the Key Players in the Water Adventure Tourism Market?
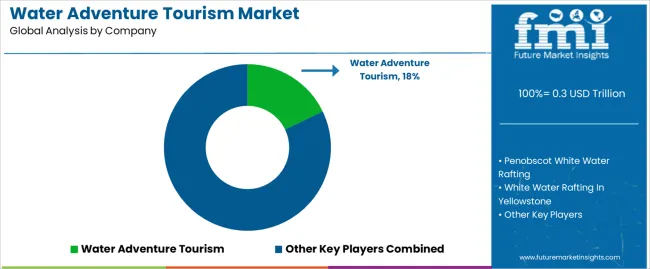
Some of the key players in the water adventure tourism market are: Ace Adventure, Berber Rafting Adventures, Cardiff International White Water, 8Adventures, Orca Dive Club, Natural Travel Collection Ltd, PADI Travel, Dive The World, Fly & Sea Dive Adventures, World Dive and Sail International, Ultimate Dive Travel, Hidden Depths Dive Tours, Project Expedition, Scuba Travel, Bluewater Travel, Entrada Travel Group, Island Expeditions Company Limited, Raftingoo, and Pro Dive Cairns.

A unified Market Research Subscription Platform, built for today's disparate research needs.
Report Scope
Report Attribute |
Details |
Growth Rate |
CAGR of 16.9% from 2022 to 2032 |
Base Year for Estimation |
2021 |
Historical Data |
2014-2020 |
Forecast Period |
2022-2032 |
Quantitative Units |
Revenue in USD Million and CAGR from 2022-2032 |
Report Coverage |
Revenue Forecast, Volume Forecast, Company Ranking, Competitive Landscape, Growth Factors, Trends and Pricing Analysis |
Segments Covered |
|
Regions Covered |
|
Key Countries Profiled |
|
Key Companies Profiled |
|
Customization |
|
Key Segments in the Water Adventure Tourism Market
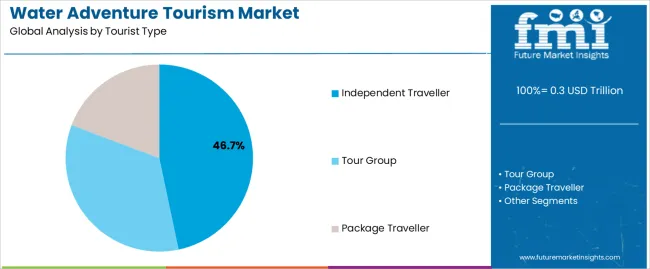
By Tourist Type:
- Independent Traveller
- Tour Group
- Package Traveller
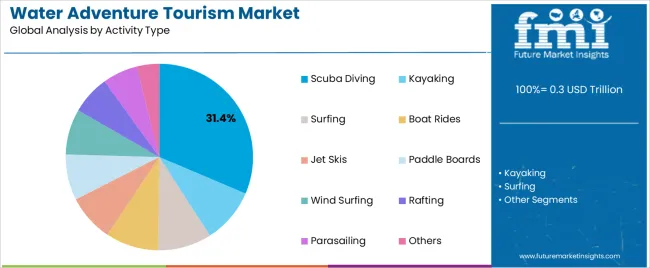
By Activity Type:
- Kayaking
- Surfing
- Boat Rides
- Jet Skis
- Paddle Boards
- Wind Surfing
- Rafting
- Scuba Diving
- Parasailing
- Others
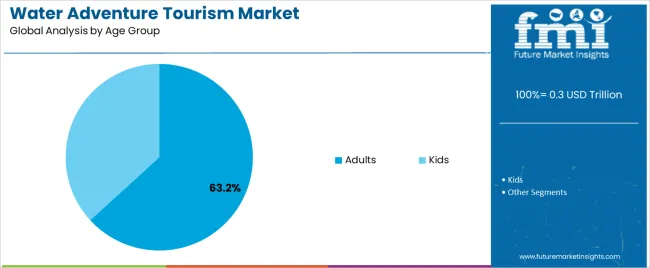
By Age Group:
- Kids
- Adults
Frequently Asked Questions
The growth outlook for the water adventure tourism market is predicted to advance at a CAGR of 16.9% from 2022-to 2032.
The North American, European, and Asia-Pacific regions are anticipated to lead the water adventure tourism market during the forecast period.
The water adventure tourism market is likely to hold a valuation of US$ 845.8 billion by 2032.
Table of Content
1. Executive Summary
1.1. Global Market Outlook
1.2. Demand-side Trends
1.3. Supply-side Trends
1.4. Technology Roadmap Analysis
1.5. Analysis and Recommendations
2. Market Overview
2.1. Market Coverage / Taxonomy
2.2. Market Definition / Scope / Limitations
3. Market Background
3.1. Market Dynamics
3.1.1. Drivers
3.1.2. Restraints
3.1.3. Opportunity
3.1.4. Trends
3.2. Scenario Forecast
3.2.1. Demand in Optimistic Scenario
3.2.2. Demand in Likely Scenario
3.2.3. Demand in Conservative Scenario
3.3. Opportunity Map Analysis
3.4. Investment Feasibility Matrix
3.5. PESTLE and Porter’s Analysis
3.6. Regulatory Landscape
3.6.1. By Key Regions
3.6.2. By Key Countries
3.7. Regional Parent Market Outlook
4. Global Water Adventure Tourism Market Analysis 2017-2021 and Forecast, 2022-2032
4.1. Historical Market Size Value (US$ Mn) Analysis, 2017-2021
4.2. Current and Future Market Size Value (US$ Mn) Projections, 2022-2032
4.2.1. Y-o-Y Growth Trend Analysis
4.2.2. Absolute $ Opportunity Analysis
5. Global Water Adventure Tourism Market Analysis 2017-2021 and Forecast 2022-2032, By Traveller
5.1. Introduction / Key Findings
5.2. Historical Market Size Value (US$ Mn) Analysis By Traveller, 2017-2021
5.3. Current and Future Market Size Value (US$ Mn) Analysis and Forecast By Traveller, 2022-2032
5.3.1. Solo
5.3.2. Group
5.3.3. Couple
5.4. Y-o-Y Growth Trend Analysis By Traveller, 2017-2021
5.5. Absolute $ Opportunity Analysis By Traveller, 2022-2032
6. Global Water Adventure Tourism Market Analysis 2017-2021 and Forecast 2022-2032, By Booking Type
6.1. Introduction / Key Findings
6.2. Historical Market Size Value (US$ Mn) Analysis By Booking Type, 2017-2021
6.3. Current and Future Market Size Value (US$ Mn) Analysis and Forecast By Booking Type, 2022-2032
6.3.1. Travel Agent
6.3.2. Direct Booking
6.4. Y-o-Y Growth Trend Analysis By Booking Type, 2017-2021
6.5. Absolute $ Opportunity Analysis By Booking Type, 2022-2032
7. Global Water Adventure Tourism Market Analysis 2017-2021 and Forecast 2022-2032, By Activity
7.1. Introduction / Key Findings
7.2. Historical Market Size Value (US$ Mn) Analysis By Activity, 2017-2021
7.3. Current and Future Market Size Value (US$ Mn) Analysis and Forecast By Activity, 2022-2032
7.3.1. Wakeboarding
7.3.2. Kayaking
7.3.3. Knee Boarding
7.3.4. Sailing on a Yacht
7.3.5. Paddle Boarding
7.3.6. River Rafting
7.4. Y-o-Y Growth Trend Analysis By Activity, 2017-2021
7.5. Absolute $ Opportunity Analysis By Activity, 2022-2032
8. Global Water Adventure Tourism Market Analysis 2017-2021 and Forecast 2022-2032, By Region
8.1. Introduction
8.2. Historical Market Size Value (US$ Mn) Analysis By Region, 2017-2021
8.3. Current Market Size Value (US$ Mn) Analysis and Forecast By Region, 2022-2032
8.3.1. North America
8.3.2. Latin America
8.3.3. Europe
8.3.4. Asia Pacific
8.3.5. MEA
8.4. Market Attractiveness Analysis By Region
9. North America Water Adventure Tourism Market Analysis 2017-2021 and Forecast 2022-2032, By Country
9.1. Historical Market Size Value (US$ Mn) Trend Analysis By Market Taxonomy, 2017-2021
9.2. Market Size Value (US$ Mn) Forecast By Market Taxonomy, 2022-2032
9.2.1. By Country
9.2.1.1. US
9.2.1.2. Canada
9.2.2. By Traveller
9.2.3. By Booking Type
9.2.4. By Activity
9.3. Market Attractiveness Analysis
9.3.1. By Country
9.3.2. By Traveller
9.3.3. By Booking Type
9.3.4. By Activity
9.4. Key Takeaways
10. Latin America Water Adventure Tourism Market Analysis 2017-2021 and Forecast 2022-2032, By Country
10.1. Historical Market Size Value (US$ Mn) Trend Analysis By Market Taxonomy, 2017-2021
10.2. Market Size Value (US$ Mn) Forecast By Market Taxonomy, 2022-2032
10.2.1. By Country
10.2.1.1. Brazil
10.2.1.2. Mexico
10.2.1.3. Rest of Latin America
10.2.2. By Traveller
10.2.3. By Booking Type
10.2.4. By Activity
10.3. Market Attractiveness Analysis
10.3.1. By Country
10.3.2. By Traveller
10.3.3. By Booking Type
10.3.4. By Activity
10.4. Key Takeaways
11. Europe Water Adventure Tourism Market Analysis 2017-2021 and Forecast 2022-2032, By Country
11.1. Historical Market Size Value (US$ Mn) Trend Analysis By Market Taxonomy, 2017-2021
11.2. Market Size Value (US$ Mn) Forecast By Market Taxonomy, 2022-2032
11.2.1. By Country
11.2.1.1. Germany
11.2.1.2. U.K.
11.2.1.3. France
11.2.1.4. Spain
11.2.1.5. Italy
11.2.1.6. Rest of Europe
11.2.2. By Traveller
11.2.3. By Booking Type
11.2.4. By Activity
11.3. Market Attractiveness Analysis
11.3.1. By Country
11.3.2. By Traveller
11.3.3. By Booking Type
11.3.4. By Activity
11.4. Key Takeaways
12. Asia Pacific Water Adventure Tourism Market Analysis 2017-2021 and Forecast 2022-2032, By Country
12.1. Historical Market Size Value (US$ Mn) Trend Analysis By Market Taxonomy, 2017-2021
12.2. Market Size Value (US$ Mn) Forecast By Market Taxonomy, 2022-2032
12.2.1. By Country
12.2.1.1. China
12.2.1.2. Japan
12.2.1.3. South Korea
12.2.1.4. Rest of Asia Pacific
12.2.2. By Traveller
12.2.3. By Booking Type
12.2.4. By Activity
12.3. Market Attractiveness Analysis
12.3.1. By Country
12.3.2. By Traveller
12.3.3. By Booking Type
12.3.4. By Activity
12.4. Key Takeaways
13. MEA Water Adventure Tourism Market Analysis 2017-2021 and Forecast 2022-2032, By Country
13.1. Historical Market Size Value (US$ Mn) Trend Analysis By Market Taxonomy, 2017-2021
13.2. Market Size Value (US$ Mn) Forecast By Market Taxonomy, 2022-2032
13.2.1. By Country
13.2.1.1. GCC Countries
13.2.1.2. South Africa
13.2.1.3. Israel
13.2.1.4. Rest of MEA
13.2.2. By Traveller
13.2.3. By Booking Type
13.2.4. By Activity
13.3. Market Attractiveness Analysis
13.3.1. By Country
13.3.2. By Traveller
13.3.3. By Booking Type
13.3.4. By Activity
13.4. Key Takeaways
14. Key Countries Water Adventure Tourism Market Analysis
14.1. US
14.1.1. Pricing Analysis
14.1.2. Market Share Analysis, 2021
14.1.2.1. By Traveller
14.1.2.2. By Booking Type
14.1.2.3. By Activity
14.2. Canada
14.2.1. Pricing Analysis
14.2.2. Market Share Analysis, 2021
14.2.2.1. By Traveller
14.2.2.2. By Booking Type
14.2.2.3. By Activity
14.3. Brazil
14.3.1. Pricing Analysis
14.3.2. Market Share Analysis, 2021
14.3.2.1. By Traveller
14.3.2.2. By Booking Type
14.3.2.3. By Activity
14.4. Mexico
14.4.1. Pricing Analysis
14.4.2. Market Share Analysis, 2021
14.4.2.1. By Traveller
14.4.2.2. By Booking Type
14.4.2.3. By Activity
14.5. Germany
14.5.1. Pricing Analysis
14.5.2. Market Share Analysis, 2021
14.5.2.1. By Traveller
14.5.2.2. By Booking Type
14.5.2.3. By Activity
14.6. U.K.
14.6.1. Pricing Analysis
14.6.2. Market Share Analysis, 2021
14.6.2.1. By Traveller
14.6.2.2. By Booking Type
14.6.2.3. By Activity
14.7. France
14.7.1. Pricing Analysis
14.7.2. Market Share Analysis, 2021
14.7.2.1. By Traveller
14.7.2.2. By Booking Type
14.7.2.3. By Activity
14.8. Spain
14.8.1. Pricing Analysis
14.8.2. Market Share Analysis, 2021
14.8.2.1. By Traveller
14.8.2.2. By Booking Type
14.8.2.3. By Activity
14.9. Italy
14.9.1. Pricing Analysis
14.9.2. Market Share Analysis, 2021
14.9.2.1. By Traveller
14.9.2.2. By Booking Type
14.9.2.3. By Activity
14.10. China
14.10.1. Pricing Analysis
14.10.2. Market Share Analysis, 2021
14.10.2.1. By Traveller
14.10.2.2. By Booking Type
14.10.2.3. By Activity
14.11. Japan
14.11.1. Pricing Analysis
14.11.2. Market Share Analysis, 2021
14.11.2.1. By Traveller
14.11.2.2. By Booking Type
14.11.2.3. By Activity
14.12. South Korea
14.12.1. Pricing Analysis
14.12.2. Market Share Analysis, 2021
14.12.2.1. By Traveller
14.12.2.2. By Booking Type
14.12.2.3. By Activity
14.13. GCC Countries
14.13.1. Pricing Analysis
14.13.2. Market Share Analysis, 2021
14.13.2.1. By Traveller
14.13.2.2. By Booking Type
14.13.2.3. By Activity
14.14. South Africa
14.14.1. Pricing Analysis
14.14.2. Market Share Analysis, 2021
14.14.2.1. By Traveller
14.14.2.2. By Booking Type
14.14.2.3. By Activity
14.15. Israel
14.15.1. Pricing Analysis
14.15.2. Market Share Analysis, 2021
14.15.2.1. By Traveller
14.15.2.2. By Booking Type
14.15.2.3. By Activity
15. Market Structure Analysis
15.1. Competition Dashboard
15.2. Competition Benchmarking
15.3. Market Share Analysis of Top Players
15.3.1. By Regional
15.3.2. By Traveller
15.3.3. By Booking Type
15.3.4. By Activity
16. Competition Analysis
16.1. Competition Deep Dive
16.1.1. Intrepid Group
16.1.1.1. Overview
16.1.1.2. Product Portfolio
16.1.1.3. Profitability by Market Segments
16.1.1.4. Sales Footprint
16.1.1.5. Strategy Overview
16.1.1.5.1. Marketing Strategy
16.1.2. Ultimate Adventure Travel
16.1.2.1. Overview
16.1.2.2. Product Portfolio
16.1.2.3. Profitability by Market Segments
16.1.2.4. Sales Footprint
16.1.2.5. Strategy Overview
16.1.2.5.1. Marketing Strategy
16.1.3. Insight Vacations
16.1.3.1. Overview
16.1.3.2. Product Portfolio
16.1.3.3. Profitability by Market Segments
16.1.3.4. Sales Footprint
16.1.3.5. Strategy Overview
16.1.3.5.1. Marketing Strategy
16.1.4. Boundless Journeys
16.1.4.1. Overview
16.1.4.2. Product Portfolio
16.1.4.3. Profitability by Market Segments
16.1.4.4. Sales Footprint
16.1.4.5. Strategy Overview
16.1.4.5.1. Marketing Strategy
16.1.5. Contiki
16.1.5.1. Overview
16.1.5.2. Product Portfolio
16.1.5.3. Profitability by Market Segments
16.1.5.4. Sales Footprint
16.1.5.5. Strategy Overview
16.1.5.5.1. Marketing Strategy
16.1.6. Intro Travel
16.1.6.1. Overview
16.1.6.2. Product Portfolio
16.1.6.3. Profitability by Market Segments
16.1.6.4. Sales Footprint
16.1.6.5. Strategy Overview
16.1.6.5.1. Marketing Strategy
16.1.7. Austin Adventures
16.1.7.1. Overview
16.1.7.2. Product Portfolio
16.1.7.3. Profitability by Market Segments
16.1.7.4. Sales Footprint
16.1.7.5. Strategy Overview
16.1.7.5.1. Marketing Strategy
16.1.8. Explore Worldwide
16.1.8.1. Overview
16.1.8.2. Product Portfolio
16.1.8.3. Profitability by Market Segments
16.1.8.4. Sales Footprint
16.1.8.5. Strategy Overview
16.1.8.5.1. Marketing Strategy
17. Assumptions & Acronyms Used
18. Research Methodology
Let us know your requirement to get
100% FREE customization
List of Tables
Table 1: Global Water Adventure Tourism Market Value (US$ Mn) Forecast by Region, 2017-2032
Table 2: Global Water Adventure Tourism Market Value (US$ Mn) Forecast by Traveller, 2017-2032
Table 3: Global Water Adventure Tourism Market Value (US$ Mn) Forecast by Booking Type, 2017-2032
Table 4: Global Water Adventure Tourism Market Value (US$ Mn) Forecast by Activity, 2017-2032
Table 5: North America Water Adventure Tourism Market Value (US$ Mn) Forecast by Country, 2017-2032
Table 6: North America Water Adventure Tourism Market Value (US$ Mn) Forecast by Traveller, 2017-2032
Table 7: North America Water Adventure Tourism Market Value (US$ Mn) Forecast by Booking Type, 2017-2032
Table 8: North America Water Adventure Tourism Market Value (US$ Mn) Forecast by Activity, 2017-2032
Table 9: Latin America Water Adventure Tourism Market Value (US$ Mn) Forecast by Country, 2017-2032
Table 10: Latin America Water Adventure Tourism Market Value (US$ Mn) Forecast by Traveller, 2017-2032
Table 11: Latin America Water Adventure Tourism Market Value (US$ Mn) Forecast by Booking Type, 2017-2032
Table 12: Latin America Water Adventure Tourism Market Value (US$ Mn) Forecast by Activity, 2017-2032
Table 13: Europe Water Adventure Tourism Market Value (US$ Mn) Forecast by Country, 2017-2032
Table 14: Europe Water Adventure Tourism Market Value (US$ Mn) Forecast by Traveller, 2017-2032
Table 15: Europe Water Adventure Tourism Market Value (US$ Mn) Forecast by Booking Type, 2017-2032
Table 16: Europe Water Adventure Tourism Market Value (US$ Mn) Forecast by Activity, 2017-2032
Table 17: Asia Pacific Water Adventure Tourism Market Value (US$ Mn) Forecast by Country, 2017-2032
Table 18: Asia Pacific Water Adventure Tourism Market Value (US$ Mn) Forecast by Traveller, 2017-2032
Table 19: Asia Pacific Water Adventure Tourism Market Value (US$ Mn) Forecast by Booking Type, 2017-2032
Table 20: Asia Pacific Water Adventure Tourism Market Value (US$ Mn) Forecast by Activity, 2017-2032
Table 21: MEA Water Adventure Tourism Market Value (US$ Mn) Forecast by Country, 2017-2032
Table 22: MEA Water Adventure Tourism Market Value (US$ Mn) Forecast by Traveller, 2017-2032
Table 23: MEA Water Adventure Tourism Market Value (US$ Mn) Forecast by Booking Type, 2017-2032
Table 24: MEA Water Adventure Tourism Market Value (US$ Mn) Forecast by Activity, 2017-2032
Find your sweet spots for generating winning opportunities in this market.
Talk to AnalystList of Charts
Figure 1: Global Water Adventure Tourism Market Value (US$ Mn) by Traveller, 2022-2032
Figure 2: Global Water Adventure Tourism Market Value (US$ Mn) by Booking Type, 2022-2032
Figure 3: Global Water Adventure Tourism Market Value (US$ Mn) by Activity, 2022-2032
Figure 4: Global Water Adventure Tourism Market Value (US$ Mn) by Region, 2022-2032
Figure 5: Global Water Adventure Tourism Market Value (US$ Mn) Analysis by Region, 2017-2032
Figure 6: Global Water Adventure Tourism Market Value Share (%) and BPS Analysis by Region, 2022-2032
Figure 7: Global Water Adventure Tourism Market Y-o-Y Growth (%) Projections by Region, 2022-2032
Figure 8: Global Water Adventure Tourism Market Value (US$ Mn) Analysis by Traveller, 2017-2032
Figure 9: Global Water Adventure Tourism Market Value Share (%) and BPS Analysis by Traveller, 2022-2032
Figure 10: Global Water Adventure Tourism Market Y-o-Y Growth (%) Projections by Traveller, 2022-2032
Figure 11: Global Water Adventure Tourism Market Value (US$ Mn) Analysis by Booking Type, 2017-2032
Figure 12: Global Water Adventure Tourism Market Value Share (%) and BPS Analysis by Booking Type, 2022-2032
Figure 13: Global Water Adventure Tourism Market Y-o-Y Growth (%) Projections by Booking Type, 2022-2032
Figure 14: Global Water Adventure Tourism Market Value (US$ Mn) Analysis by Activity, 2017-2032
Figure 15: Global Water Adventure Tourism Market Value Share (%) and BPS Analysis by Activity, 2022-2032
Figure 16: Global Water Adventure Tourism Market Y-o-Y Growth (%) Projections by Activity, 2022-2032
Figure 17: Global Water Adventure Tourism Market Attractiveness by Traveller, 2022-2032
Figure 18: Global Water Adventure Tourism Market Attractiveness by Booking Type, 2022-2032
Figure 19: Global Water Adventure Tourism Market Attractiveness by Activity, 2022-2032
Figure 20: Global Water Adventure Tourism Market Attractiveness by Region, 2022-2032
Figure 21: North America Water Adventure Tourism Market Value (US$ Mn) by Traveller, 2022-2032
Figure 22: North America Water Adventure Tourism Market Value (US$ Mn) by Booking Type, 2022-2032
Figure 23: North America Water Adventure Tourism Market Value (US$ Mn) by Activity, 2022-2032
Figure 24: North America Water Adventure Tourism Market Value (US$ Mn) by Country, 2022-2032
Figure 25: North America Water Adventure Tourism Market Value (US$ Mn) Analysis by Country, 2017-2032
Figure 26: North America Water Adventure Tourism Market Value Share (%) and BPS Analysis by Country, 2022-2032
Figure 27: North America Water Adventure Tourism Market Y-o-Y Growth (%) Projections by Country, 2022-2032
Figure 28: North America Water Adventure Tourism Market Value (US$ Mn) Analysis by Traveller, 2017-2032
Figure 29: North America Water Adventure Tourism Market Value Share (%) and BPS Analysis by Traveller, 2022-2032
Figure 30: North America Water Adventure Tourism Market Y-o-Y Growth (%) Projections by Traveller, 2022-2032
Figure 31: North America Water Adventure Tourism Market Value (US$ Mn) Analysis by Booking Type, 2017-2032
Figure 32: North America Water Adventure Tourism Market Value Share (%) and BPS Analysis by Booking Type, 2022-2032
Figure 33: North America Water Adventure Tourism Market Y-o-Y Growth (%) Projections by Booking Type, 2022-2032
Figure 34: North America Water Adventure Tourism Market Value (US$ Mn) Analysis by Activity, 2017-2032
Figure 35: North America Water Adventure Tourism Market Value Share (%) and BPS Analysis by Activity, 2022-2032
Figure 36: North America Water Adventure Tourism Market Y-o-Y Growth (%) Projections by Activity, 2022-2032
Figure 37: North America Water Adventure Tourism Market Attractiveness by Traveller, 2022-2032
Figure 38: North America Water Adventure Tourism Market Attractiveness by Booking Type, 2022-2032
Figure 39: North America Water Adventure Tourism Market Attractiveness by Activity, 2022-2032
Figure 40: North America Water Adventure Tourism Market Attractiveness by Country, 2022-2032
Figure 41: Latin America Water Adventure Tourism Market Value (US$ Mn) by Traveller, 2022-2032
Figure 42: Latin America Water Adventure Tourism Market Value (US$ Mn) by Booking Type, 2022-2032
Figure 43: Latin America Water Adventure Tourism Market Value (US$ Mn) by Activity, 2022-2032
Figure 44: Latin America Water Adventure Tourism Market Value (US$ Mn) by Country, 2022-2032
Figure 45: Latin America Water Adventure Tourism Market Value (US$ Mn) Analysis by Country, 2017-2032
Figure 46: Latin America Water Adventure Tourism Market Value Share (%) and BPS Analysis by Country, 2022-2032
Figure 47: Latin America Water Adventure Tourism Market Y-o-Y Growth (%) Projections by Country, 2022-2032
Figure 48: Latin America Water Adventure Tourism Market Value (US$ Mn) Analysis by Traveller, 2017-2032
Figure 49: Latin America Water Adventure Tourism Market Value Share (%) and BPS Analysis by Traveller, 2022-2032
Figure 50: Latin America Water Adventure Tourism Market Y-o-Y Growth (%) Projections by Traveller, 2022-2032
Figure 51: Latin America Water Adventure Tourism Market Value (US$ Mn) Analysis by Booking Type, 2017-2032
Figure 52: Latin America Water Adventure Tourism Market Value Share (%) and BPS Analysis by Booking Type, 2022-2032
Figure 53: Latin America Water Adventure Tourism Market Y-o-Y Growth (%) Projections by Booking Type, 2022-2032
Figure 54: Latin America Water Adventure Tourism Market Value (US$ Mn) Analysis by Activity, 2017-2032
Figure 55: Latin America Water Adventure Tourism Market Value Share (%) and BPS Analysis by Activity, 2022-2032
Figure 56: Latin America Water Adventure Tourism Market Y-o-Y Growth (%) Projections by Activity, 2022-2032
Figure 57: Latin America Water Adventure Tourism Market Attractiveness by Traveller, 2022-2032
Figure 58: Latin America Water Adventure Tourism Market Attractiveness by Booking Type, 2022-2032
Figure 59: Latin America Water Adventure Tourism Market Attractiveness by Activity, 2022-2032
Figure 60: Latin America Water Adventure Tourism Market Attractiveness by Country, 2022-2032
Figure 61: Europe Water Adventure Tourism Market Value (US$ Mn) by Traveller, 2022-2032
Figure 62: Europe Water Adventure Tourism Market Value (US$ Mn) by Booking Type, 2022-2032
Figure 63: Europe Water Adventure Tourism Market Value (US$ Mn) by Activity, 2022-2032
Figure 64: Europe Water Adventure Tourism Market Value (US$ Mn) by Country, 2022-2032
Figure 65: Europe Water Adventure Tourism Market Value (US$ Mn) Analysis by Country, 2017-2032
Figure 66: Europe Water Adventure Tourism Market Value Share (%) and BPS Analysis by Country, 2022-2032
Figure 67: Europe Water Adventure Tourism Market Y-o-Y Growth (%) Projections by Country, 2022-2032
Figure 68: Europe Water Adventure Tourism Market Value (US$ Mn) Analysis by Traveller, 2017-2032
Figure 69: Europe Water Adventure Tourism Market Value Share (%) and BPS Analysis by Traveller, 2022-2032
Figure 70: Europe Water Adventure Tourism Market Y-o-Y Growth (%) Projections by Traveller, 2022-2032
Figure 71: Europe Water Adventure Tourism Market Value (US$ Mn) Analysis by Booking Type, 2017-2032
Figure 72: Europe Water Adventure Tourism Market Value Share (%) and BPS Analysis by Booking Type, 2022-2032
Figure 73: Europe Water Adventure Tourism Market Y-o-Y Growth (%) Projections by Booking Type, 2022-2032
Figure 74: Europe Water Adventure Tourism Market Value (US$ Mn) Analysis by Activity, 2017-2032
Figure 75: Europe Water Adventure Tourism Market Value Share (%) and BPS Analysis by Activity, 2022-2032
Figure 76: Europe Water Adventure Tourism Market Y-o-Y Growth (%) Projections by Activity, 2022-2032
Figure 77: Europe Water Adventure Tourism Market Attractiveness by Traveller, 2022-2032
Figure 78: Europe Water Adventure Tourism Market Attractiveness by Booking Type, 2022-2032
Figure 79: Europe Water Adventure Tourism Market Attractiveness by Activity, 2022-2032
Figure 80: Europe Water Adventure Tourism Market Attractiveness by Country, 2022-2032
Figure 81: Asia Pacific Water Adventure Tourism Market Value (US$ Mn) by Traveller, 2022-2032
Figure 82: Asia Pacific Water Adventure Tourism Market Value (US$ Mn) by Booking Type, 2022-2032
Figure 83: Asia Pacific Water Adventure Tourism Market Value (US$ Mn) by Activity, 2022-2032
Figure 84: Asia Pacific Water Adventure Tourism Market Value (US$ Mn) by Country, 2022-2032
Figure 85: Asia Pacific Water Adventure Tourism Market Value (US$ Mn) Analysis by Country, 2017-2032
Figure 86: Asia Pacific Water Adventure Tourism Market Value Share (%) and BPS Analysis by Country, 2022-2032
Figure 87: Asia Pacific Water Adventure Tourism Market Y-o-Y Growth (%) Projections by Country, 2022-2032
Figure 88: Asia Pacific Water Adventure Tourism Market Value (US$ Mn) Analysis by Traveller, 2017-2032
Figure 89: Asia Pacific Water Adventure Tourism Market Value Share (%) and BPS Analysis by Traveller, 2022-2032
Figure 90: Asia Pacific Water Adventure Tourism Market Y-o-Y Growth (%) Projections by Traveller, 2022-2032
Figure 91: Asia Pacific Water Adventure Tourism Market Value (US$ Mn) Analysis by Booking Type, 2017-2032
Figure 92: Asia Pacific Water Adventure Tourism Market Value Share (%) and BPS Analysis by Booking Type, 2022-2032
Figure 93: Asia Pacific Water Adventure Tourism Market Y-o-Y Growth (%) Projections by Booking Type, 2022-2032
Figure 94: Asia Pacific Water Adventure Tourism Market Value (US$ Mn) Analysis by Activity, 2017-2032
Figure 95: Asia Pacific Water Adventure Tourism Market Value Share (%) and BPS Analysis by Activity, 2022-2032
Figure 96: Asia Pacific Water Adventure Tourism Market Y-o-Y Growth (%) Projections by Activity, 2022-2032
Figure 97: Asia Pacific Water Adventure Tourism Market Attractiveness by Traveller, 2022-2032
Figure 98: Asia Pacific Water Adventure Tourism Market Attractiveness by Booking Type, 2022-2032
Figure 99: Asia Pacific Water Adventure Tourism Market Attractiveness by Activity, 2022-2032
Figure 100: Asia Pacific Water Adventure Tourism Market Attractiveness by Country, 2022-2032
Figure 101: MEA Water Adventure Tourism Market Value (US$ Mn) by Traveller, 2022-2032
Figure 102: MEA Water Adventure Tourism Market Value (US$ Mn) by Booking Type, 2022-2032
Figure 103: MEA Water Adventure Tourism Market Value (US$ Mn) by Activity, 2022-2032
Figure 104: MEA Water Adventure Tourism Market Value (US$ Mn) by Country, 2022-2032
Figure 105: MEA Water Adventure Tourism Market Value (US$ Mn) Analysis by Country, 2017-2032
Figure 106: MEA Water Adventure Tourism Market Value Share (%) and BPS Analysis by Country, 2022-2032
Figure 107: MEA Water Adventure Tourism Market Y-o-Y Growth (%) Projections by Country, 2022-2032
Figure 108: MEA Water Adventure Tourism Market Value (US$ Mn) Analysis by Traveller, 2017-2032
Figure 109: MEA Water Adventure Tourism Market Value Share (%) and BPS Analysis by Traveller, 2022-2032
Figure 110: MEA Water Adventure Tourism Market Y-o-Y Growth (%) Projections by Traveller, 2022-2032
Figure 111: MEA Water Adventure Tourism Market Value (US$ Mn) Analysis by Booking Type, 2017-2032
Figure 112: MEA Water Adventure Tourism Market Value Share (%) and BPS Analysis by Booking Type, 2022-2032
Figure 113: MEA Water Adventure Tourism Market Y-o-Y Growth (%) Projections by Booking Type, 2022-2032
Figure 114: MEA Water Adventure Tourism Market Value (US$ Mn) Analysis by Activity, 2017-2032
Figure 115: MEA Water Adventure Tourism Market Value Share (%) and BPS Analysis by Activity, 2022-2032
Figure 116: MEA Water Adventure Tourism Market Y-o-Y Growth (%) Projections by Activity, 2022-2032
Figure 117: MEA Water Adventure Tourism Market Attractiveness by Traveller, 2022-2032
Figure 118: MEA Water Adventure Tourism Market Attractiveness by Booking Type, 2022-2032
Figure 119: MEA Water Adventure Tourism Market Attractiveness by Activity, 2022-2032
Figure 120: MEA Water Adventure Tourism Market Attractiveness by Country, 2022-2032
Need specific information?
Request CustomizationExplore Travel and Tourism Insights
View Reports