Water Activated Tape Dispensers Market Size and Share Forecast Outlook 2025 to 2035

The Water Activated Tape Dispensers Market is estimated to be valued at USD 36.2 million in 2025 and is projected to reach USD 98.1 million by 2035, registering a compound annual growth rate (CAGR) of 10.5% over the forecast period.
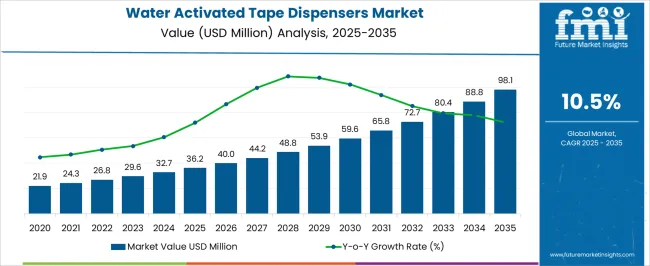
Quick Stats for Water Activated Tape Dispensers Market

  • Water Activated Tape Dispensers Market Industry Value (2025): USD 36.2 million
  • Water Activated Tape Dispensers Market Forecast Value (2035): USD 98.1 million
  • Water Activated Tape Dispensers Market Forecast CAGR: 10.5%
  • Leading Segment in Water Activated Tape Dispensers Market in 2025: Automatic (57.6%)
  • Key Growth Region in Water Activated Tape Dispensers Market: North America, Asia-Pacific, Europe
  • Top Key Players in Water Activated Tape Dispensers Market: 3M Company, Intertape Polymer Group Inc., Shurtape Technologies, LLC, LOYTAPE INDUSTRIES SDN. BHD., Papertec, Inc., LPS Industries, LLC, Windmill Tapes & Labels Ltd., Maxfel S.r.l, Neubronner GmbH & Co.

Water Activated Tape Dispensers Market Market Value Analysis

Metric Value
Water Activated Tape Dispensers Market Estimated Value in (2025E) USD 36.2 million
Water Activated Tape Dispensers Market Forecast Value in (2035F) USD 98.1 million
Forecast CAGR (2025 to 2035) 10.5%

Rationale for Segmental Growth in the Water Activated Tape Dispensers Market

The water activated tape dispensers market is witnessing consistent growth due to the increasing emphasis on secure and eco-friendly packaging solutions. The shift toward water activated tape is being supported by its strong adhesion, recyclability, and superior tamper-evidence, making it ideal for e-commerce shipments, industrial packaging, and global supply chain operations.

Businesses are increasingly investing in automated packaging lines to enhance operational efficiency and reduce manual labor, creating a strong demand for programmable and high-speed dispensers. Additionally, the rise in cross-border shipping and growing awareness of sustainable packaging practices have prompted manufacturers and distributors to adopt water activated tape systems that ensure safety during transit while meeting environmental standards.

Technological improvements in dispenser design, such as digital controls, variable length dispensing, and enhanced moisture application systems, have further improved performance and throughput As packaging automation becomes a strategic priority for high-volume distribution centers, the adoption of water activated tape dispensers is expected to expand significantly across both developed and emerging logistics markets.

Segmental Analysis

The market is segmented by Machines and End Use Industries and region. By Machines, the market is divided into Automatic and Manual. In terms of End Use Industries, the market is classified into Shipping & Logistics, Building & Construction, Food & Beverages, Electrical & Electronics, Healthcare, Automotive, Metalworking, Oil & Gas, General Industrial, and Consumer Goods. Regionally, the market is classified into North America, Latin America, Western Europe, Eastern Europe, Balkan & Baltic Countries, Russia & Belarus, Central Asia, East Asia, South Asia & Pacific, and the Middle East & Africa.
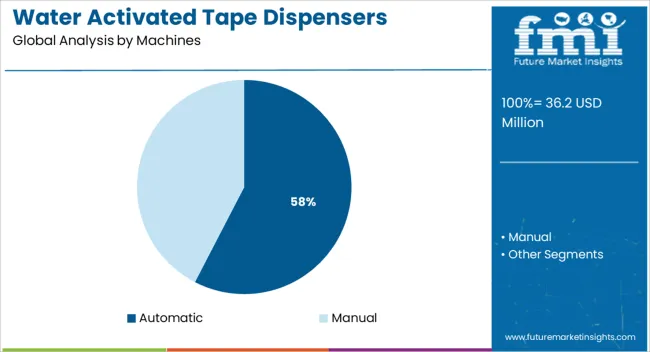
Insights into the Automatic Machines Segment

Water Activated Tape Dispensers Market Analysis By Machines

The automatic machines segment is projected to account for 57.6% of the total revenue share in the water activated tape dispensers market in 2025, establishing it as the leading machine type. This dominance has been driven by the growing need for speed, consistency, and reduced operator dependency in high-volume packaging operations. Automatic dispensers have been widely adopted across distribution centers and fulfillment hubs due to their ability to deliver precise tape lengths, consistent moisture application, and integration with automated conveyor systems.

Their programmable settings and user-friendly digital interfaces allow for minimal training and rapid deployment in dynamic warehouse environments. The increasing scale of e-commerce and retail logistics has further propelled the demand for high-speed packaging equipment that minimizes downtime and labor costs.

Automatic dispensers have also been preferred for their safety features, durability, and compatibility with various box sizes and tape widths As packaging lines move toward full automation, automatic dispensers are expected to retain their competitive edge due to their high throughput and reduced total cost of ownership.
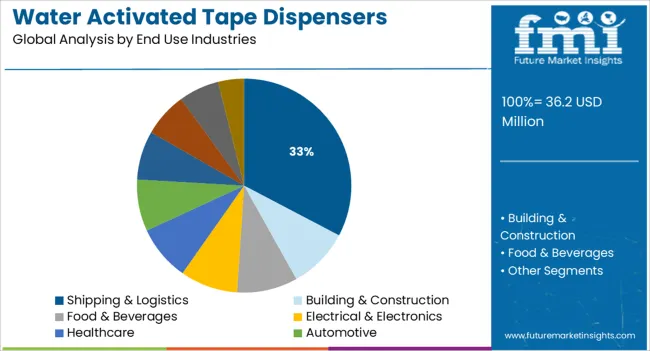
Insights into the Shipping and Logistics End Use Segment

Water Activated Tape Dispensers Market Analysis By End Use Industries

The shipping and logistics segment is expected to capture 32.7% of the total revenue share in the water activated tape dispensers market in 2025, making it the most prominent end use industry. Growth in this segment has been primarily driven by the surge in global parcel shipments, last-mile delivery operations, and warehouse automation.

The need for secure carton sealing solutions that deter tampering and withstand variable transit conditions has led logistics operators to favor water activated tape systems over traditional pressure-sensitive tapes. Water activated tape dispensers have enabled faster, cleaner, and more reliable sealing processes that align with the performance and compliance expectations of major logistics service providers.

In addition, increasing warehouse footprints and centralized fulfillment centers have accelerated the deployment of semi and fully automatic dispensers in packaging lines The emphasis on operational efficiency, sustainability, and reduced return rates has further cemented the role of water activated tape dispensers in modern logistics workflows, particularly in regions experiencing rapid e-commerce expansion.

Water Activated Tape Dispensers Market Overview

Rapid industrialization and increase in cross-border trade has created new opportunities for world trade. Companies are improving their supply chain capabilities and expanding their geographic base to tap the market potential. Carton boxes are the prominent mode of packaging used by manufacturers for packaging of light and heavy duty goods.

Water activated tapes or commonly known gummed tapes are the idle choice for the shipping companies as it can be applied even on dirty surfaces of cartons.

The bonding strength of water activated tapes on corrugated box surface is very strong making it suitable for packaging of heavy duty goods. However, for efficient use of water activated tapes the use of water activated tape dispensers is essential.

Water activated tape dispensers commonly are of two type manually operated and automatic. After setting the desired length in water activated tape dispensers it automatically cuts the tape in pieces of desired length. Use of water activated tape dispenser ensures that the tape get moist evenly and appropriately.

Water Activated Tape Dispensers Market: Market Dynamics

Water activated tape dispensers are solely used in the application of water activated tapes for carton sealing and other applications. The shift in the use of plastic tapes to biodegradable gummed tapes for sealing of cartons can increase the demand in water activated tape dispensers market.

The need of firmly sealing carton and boxes to avoid any theft or loss of property while goods being in transit is influencing manufacturers to use water activated tapes translating into the demand in water activated tape dispensers market. Increased consumer preference for procuring the goods through e-retail format is another important factor for generating the demand for water activated tapes.

Moreover, high printability and resistance to degradation on changing of heat and temperature in the external environment are promoting the use of water activated tape while generating the demand in water activated tape dispensers market.

However, the availability of pressure sensitive and self-adhesive tapes at similar prices can affect the use of water activated tapes while limiting the demand for water activated tape dispensers. The introduction of tamper evident technology in pressure sensitive tapes can limit the use of water activated tapes while hampering the growth in water activated tape dispensers market.

However, due to the rising concern of the regulatory authorities on the increasing plastic waste the use of water activated tapes is set to increase which can create new opportunities for water activated tape dispensers market.

Water Activated Tape Dispensers Market - Regional Outlook

Regionally global water activated tape dispensers market is segmented into

  • North America
  • Latin America
  • Eastern Europe
  • Western Europe
  • Asia-Pacific excluding Japan (APEJ)
  • Middle East & Africa (MEA)
  • Japan

Rapid industrialization in APEJ region is expected to drive the water activated tape market in the region hence accounting for most of the water activated tape dispensers market. North America is expected to follow APEJ region for demand in water activated tape dispensers market due to the presence of industry leaders in the region.

Western Europe is expected to exhibit moderate growth over the forecast period in water activated tape dispensers market attributed to the 100% biodegradability of water activated tapes. MEA and Eastern Europe are expected to account for the minimum share in water activated tape dispensers market.
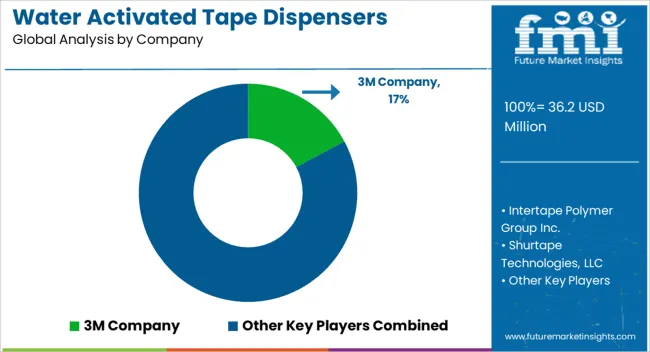
Water Activated Tape Dispensers Market - Key Players

Water Activated Tape Dispensers Market Analysis By Company

Some major players of the water activated tape dispensers market are Holland Manufacturing Co. Inc., 3M Company, Intertape Polymer Group. Inc., Shurtape Technologies, LLC, LOYTAPE INDUSTRIES SDN.BHD., Papertec, Inc., LPS Industries, LLC, Windmill Tapes & Labels Ltd., Maxfel S.r.l and Neubronner GmbH & Co.

The research report presents a comprehensive assessment of the market and contains thoughtful insights, facts, historical data, and statistically supported and industry-validated market data. It also contains projections using a suitable set of assumptions and methodologies.

The research report provides analysis and information according to categories such as market segments, geographies, type of product and applications.

The report covers exhaust analysis on

  • Market Segments
  • Market Dynamics
  • Market Size
  • Supply & Demand
  • Current Trends/Issues/Challenges
  • Competition & Companies involved
  • Technology
  • Value Chain

The report is a compilation of first-hand information, qualitative and quantitative assessment by industry analysts, inputs from industry experts and industry participants across the value chain.

The report provides in-depth analysis of parent market trends, macro-economic indicators and governing factors along with market attractiveness as per segments. The report also maps the qualitative impact of various market factors on market segments and geographies.

Water Activated Tape Dispensers Market: Market Segmentation

Based on the types of machines, water activated tape dispensers market is segmented into:

  • Automatic
  • Manual

Based on the end use industries, water activated tape dispensers market is segmented into:

  • Shipping & Logistics
  • Building & Construction
  • Food & Beverages
  • Electrical & Electronics
  • Healthcare
  • Automotive
  • Metalworking
  • Oil & Gas
  • General Industrial
  • Consumer goods

Table of Content

  1. Executive Summary
    • Global Market Outlook
    • Demand-side Trends
    • Supply-side Trends
    • Technology Roadmap Analysis
    • Analysis and Recommendations
  2. Market Overview
    • Market Coverage / Taxonomy
    • Market Definition / Scope / Limitations
  3. Market Background
    • Market Dynamics
      • Drivers
      • Restraints
      • Opportunity
      • Trends
    • Scenario Forecast
      • Demand in Optimistic Scenario
      • Demand in Likely Scenario
      • Demand in Conservative Scenario
    • Opportunity Map Analysis
    • Product Life Cycle Analysis
    • Supply Chain Analysis
    • Investment Feasibility Matrix
    • Value Chain Analysis
    • PESTLE and Porter’s Analysis
    • Regulatory Landscape
    • Regional Parent Market Outlook
    • Production and Consumption Statistics
    • Import and Export Statistics
  4. Global Market Analysis 2020 to 2024 and Forecast, 2025 to 2035
    • Historical Market Size Value (USD Million) Analysis, 2020 to 2024
    • Current and Future Market Size Value (USD Million) Projections, 2025 to 2035
      • Y-o-Y Growth Trend Analysis
      • Absolute $ Opportunity Analysis
  5. Global Market Pricing Analysis 2020 to 2024 and Forecast 2025 to 2035
  6. Global Market Analysis 2020 to 2024 and Forecast 2025 to 2035, By Machines
    • Introduction / Key Findings
    • Historical Market Size Value (USD Million) Analysis By Machines , 2020 to 2024
    • Current and Future Market Size Value (USD Million) Analysis and Forecast By Machines , 2025 to 2035
      • Automatic
      • Manual
    • Y-o-Y Growth Trend Analysis By Machines , 2020 to 2024
    • Absolute $ Opportunity Analysis By Machines , 2025 to 2035
  7. Global Market Analysis 2020 to 2024 and Forecast 2025 to 2035, By End Use Industries
    • Introduction / Key Findings
    • Historical Market Size Value (USD Million) Analysis By End Use Industries, 2020 to 2024
    • Current and Future Market Size Value (USD Million) Analysis and Forecast By End Use Industries, 2025 to 2035
      • Shipping & Logistics
      • Building & Construction
      • Food & Beverages
      • Electrical & Electronics
      • Healthcare
      • Automotive
      • Metalworking
      • Oil & Gas
      • General Industrial
      • Consumer Goods
    • Y-o-Y Growth Trend Analysis By End Use Industries, 2020 to 2024
    • Absolute $ Opportunity Analysis By End Use Industries, 2025 to 2035
  8. Global Market Analysis 2020 to 2024 and Forecast 2025 to 2035, By Region
    • Introduction
    • Historical Market Size Value (USD Million) Analysis By Region, 2020 to 2024
    • Current Market Size Value (USD Million) Analysis and Forecast By Region, 2025 to 2035
      • North America
      • Latin America
      • Western Europe
      • Eastern Europe
      • East Asia
      • South Asia and Pacific
      • Middle East & Africa
    • Market Attractiveness Analysis By Region
  9. North America Market Analysis 2020 to 2024 and Forecast 2025 to 2035, By Country
    • Historical Market Size Value (USD Million) Trend Analysis By Market Taxonomy, 2020 to 2024
    • Market Size Value (USD Million) Forecast By Market Taxonomy, 2025 to 2035
      • By Country
        • USA
        • Canada
        • Mexico
      • By Machines
      • By End Use Industries
    • Market Attractiveness Analysis
      • By Country
      • By Machines
      • By End Use Industries
    • Key Takeaways
  10. Latin America Market Analysis 2020 to 2024 and Forecast 2025 to 2035, By Country
    • Historical Market Size Value (USD Million) Trend Analysis By Market Taxonomy, 2020 to 2024
    • Market Size Value (USD Million) Forecast By Market Taxonomy, 2025 to 2035
      • By Country
        • Brazil
        • Chile
        • Rest of Latin America
      • By Machines
      • By End Use Industries
    • Market Attractiveness Analysis
      • By Country
      • By Machines
      • By End Use Industries
    • Key Takeaways
  11. Western Europe Market Analysis 2020 to 2024 and Forecast 2025 to 2035, By Country
    • Historical Market Size Value (USD Million) Trend Analysis By Market Taxonomy, 2020 to 2024
    • Market Size Value (USD Million) Forecast By Market Taxonomy, 2025 to 2035
      • By Country
        • Germany
        • UK
        • Italy
        • Spain
        • France
        • Nordic
        • BENELUX
        • Rest of Western Europe
      • By Machines
      • By End Use Industries
    • Market Attractiveness Analysis
      • By Country
      • By Machines
      • By End Use Industries
    • Key Takeaways
  12. Eastern Europe Market Analysis 2020 to 2024 and Forecast 2025 to 2035, By Country
    • Historical Market Size Value (USD Million) Trend Analysis By Market Taxonomy, 2020 to 2024
    • Market Size Value (USD Million) Forecast By Market Taxonomy, 2025 to 2035
      • By Country
        • Russia
        • Poland
        • Hungary
        • Balkan & Baltic
        • Rest of Eastern Europe
      • By Machines
      • By End Use Industries
    • Market Attractiveness Analysis
      • By Country
      • By Machines
      • By End Use Industries
    • Key Takeaways
  13. East Asia Market Analysis 2020 to 2024 and Forecast 2025 to 2035, By Country
    • Historical Market Size Value (USD Million) Trend Analysis By Market Taxonomy, 2020 to 2024
    • Market Size Value (USD Million) Forecast By Market Taxonomy, 2025 to 2035
      • By Country
        • China
        • Japan
        • South Korea
      • By Machines
      • By End Use Industries
    • Market Attractiveness Analysis
      • By Country
      • By Machines
      • By End Use Industries
    • Key Takeaways
  14. South Asia and Pacific Market Analysis 2020 to 2024 and Forecast 2025 to 2035, By Country
    • Historical Market Size Value (USD Million) Trend Analysis By Market Taxonomy, 2020 to 2024
    • Market Size Value (USD Million) Forecast By Market Taxonomy, 2025 to 2035
      • By Country
        • India
        • ASEAN
        • Australia & New Zealand
        • Rest of South Asia and Pacific
      • By Machines
      • By End Use Industries
    • Market Attractiveness Analysis
      • By Country
      • By Machines
      • By End Use Industries
    • Key Takeaways
  15. Middle East & Africa Market Analysis 2020 to 2024 and Forecast 2025 to 2035, By Country
    • Historical Market Size Value (USD Million) Trend Analysis By Market Taxonomy, 2020 to 2024
    • Market Size Value (USD Million) Forecast By Market Taxonomy, 2025 to 2035
      • By Country
        • Kingdom of Saudi Arabia
        • Other GCC Countries
        • Turkiye
        • South Africa
        • Other African Union
        • Rest of Middle East & Africa
      • By Machines
      • By End Use Industries
    • Market Attractiveness Analysis
      • By Country
      • By Machines
      • By End Use Industries
    • Key Takeaways
  16. Key Countries Market Analysis
    • USA
      • Pricing Analysis
      • Market Share Analysis, 2024
        • By Machines
        • By End Use Industries
    • Canada
      • Pricing Analysis
      • Market Share Analysis, 2024
        • By Machines
        • By End Use Industries
    • Mexico
      • Pricing Analysis
      • Market Share Analysis, 2024
        • By Machines
        • By End Use Industries
    • Brazil
      • Pricing Analysis
      • Market Share Analysis, 2024
        • By Machines
        • By End Use Industries
    • Chile
      • Pricing Analysis
      • Market Share Analysis, 2024
        • By Machines
        • By End Use Industries
    • Germany
      • Pricing Analysis
      • Market Share Analysis, 2024
        • By Machines
        • By End Use Industries
    • UK
      • Pricing Analysis
      • Market Share Analysis, 2024
        • By Machines
        • By End Use Industries
    • Italy
      • Pricing Analysis
      • Market Share Analysis, 2024
        • By Machines
        • By End Use Industries
    • Spain
      • Pricing Analysis
      • Market Share Analysis, 2024
        • By Machines
        • By End Use Industries
    • France
      • Pricing Analysis
      • Market Share Analysis, 2024
        • By Machines
        • By End Use Industries
    • India
      • Pricing Analysis
      • Market Share Analysis, 2024
        • By Machines
        • By End Use Industries
    • ASEAN
      • Pricing Analysis
      • Market Share Analysis, 2024
        • By Machines
        • By End Use Industries
    • Australia & New Zealand
      • Pricing Analysis
      • Market Share Analysis, 2024
        • By Machines
        • By End Use Industries
    • China
      • Pricing Analysis
      • Market Share Analysis, 2024
        • By Machines
        • By End Use Industries
    • Japan
      • Pricing Analysis
      • Market Share Analysis, 2024
        • By Machines
        • By End Use Industries
    • South Korea
      • Pricing Analysis
      • Market Share Analysis, 2024
        • By Machines
        • By End Use Industries
    • Russia
      • Pricing Analysis
      • Market Share Analysis, 2024
        • By Machines
        • By End Use Industries
    • Poland
      • Pricing Analysis
      • Market Share Analysis, 2024
        • By Machines
        • By End Use Industries
    • Hungary
      • Pricing Analysis
      • Market Share Analysis, 2024
        • By Machines
        • By End Use Industries
    • Kingdom of Saudi Arabia
      • Pricing Analysis
      • Market Share Analysis, 2024
        • By Machines
        • By End Use Industries
    • Turkiye
      • Pricing Analysis
      • Market Share Analysis, 2024
        • By Machines
        • By End Use Industries
    • South Africa
      • Pricing Analysis
      • Market Share Analysis, 2024
        • By Machines
        • By End Use Industries
  17. Market Structure Analysis
    • Competition Dashboard
    • Competition Benchmarking
    • Market Share Analysis of Top Players
      • By Regional
      • By Machines
      • By End Use Industries
  18. Competition Analysis
    • Competition Deep Dive
      • 3M Company
        • Overview
        • Product Portfolio
        • Profitability by Market Segments (Product/Age /Sales Channel/Region)
        • Sales Footprint
        • Strategy Overview
          • Marketing Strategy
          • Product Strategy
          • Channel Strategy
      • Intertape Polymer Group Inc.
      • Shurtape Technologies, LLC
      • LOYTAPE INDUSTRIES SDN. BHD.
      • Papertec, Inc.
      • LPS Industries, LLC
      • Windmill Tapes & Labels Ltd.
      • Maxfel S.r.l
      • Neubronner GmbH & Co.
  19. Assumptions & Acronyms Used
  20. Research Methodology

List of Tables

  • Table 1: Global Market Value (USD Million) Forecast by Region, 2020-2035
  • Table 2: Global Market Value (USD Million) Forecast by Machines , 2020-2035
  • Table 3: Global Market Value (USD Million) Forecast by End Use Industries, 2020-2035
  • Table 4: North America Market Value (USD Million) Forecast by Country, 2020-2035
  • Table 5: North America Market Value (USD Million) Forecast by Machines , 2020-2035
  • Table 6: North America Market Value (USD Million) Forecast by End Use Industries, 2020-2035
  • Table 7: Latin America Market Value (USD Million) Forecast by Country, 2020-2035
  • Table 8: Latin America Market Value (USD Million) Forecast by Machines , 2020-2035
  • Table 9: Latin America Market Value (USD Million) Forecast by End Use Industries, 2020-2035
  • Table 10: Western Europe Market Value (USD Million) Forecast by Country, 2020-2035
  • Table 11: Western Europe Market Value (USD Million) Forecast by Machines , 2020-2035
  • Table 12: Western Europe Market Value (USD Million) Forecast by End Use Industries, 2020-2035
  • Table 13: Eastern Europe Market Value (USD Million) Forecast by Country, 2020-2035
  • Table 14: Eastern Europe Market Value (USD Million) Forecast by Machines , 2020-2035
  • Table 15: Eastern Europe Market Value (USD Million) Forecast by End Use Industries, 2020-2035
  • Table 16: East Asia Market Value (USD Million) Forecast by Country, 2020-2035
  • Table 17: East Asia Market Value (USD Million) Forecast by Machines , 2020-2035
  • Table 18: East Asia Market Value (USD Million) Forecast by End Use Industries, 2020-2035
  • Table 19: South Asia and Pacific Market Value (USD Million) Forecast by Country, 2020-2035
  • Table 20: South Asia and Pacific Market Value (USD Million) Forecast by Machines , 2020-2035
  • Table 21: South Asia and Pacific Market Value (USD Million) Forecast by End Use Industries, 2020-2035
  • Table 22: Middle East & Africa Market Value (USD Million) Forecast by Country, 2020-2035
  • Table 23: Middle East & Africa Market Value (USD Million) Forecast by Machines , 2020-2035
  • Table 24: Middle East & Africa Market Value (USD Million) Forecast by End Use Industries, 2020-2035

List of Figures

  • Figure 1: Global Market Pricing Analysis
  • Figure 2: Global Market Value (USD Million) Forecast 2020-2035
  • Figure 3: Global Market Value (USD Million) Share and BPS Analysis by Region, 2025 and 2035
  • Figure 4: Global Market Y-o-Y Growth Comparison by Region, 2025-2035
  • Figure 5: Global Market Attractiveness Analysis by Region
  • Figure 6: North America Market Incremental Dollar Opportunity, 2025-2035
  • Figure 7: Latin America Market Incremental Dollar Opportunity, 2025-2035
  • Figure 8: Western Europe Market Incremental Dollar Opportunity, 2025-2035
  • Figure 9: Eastern Europe Market Incremental Dollar Opportunity, 2025-2035
  • Figure 10: East Asia Market Incremental Dollar Opportunity, 2025-2035
  • Figure 11: South Asia and Pacific Market Incremental Dollar Opportunity, 2025-2035
  • Figure 12: Middle East & Africa Market Incremental Dollar Opportunity, 2025-2035
  • Figure 13: North America Market Value Share and BPS Analysis by Country, 2025 and 2035
  • Figure 14: Latin America Market Value Share and BPS Analysis by Country, 2025 and 2035
  • Figure 15: Western Europe Market Value Share and BPS Analysis by Country, 2025 and 2035
  • Figure 16: Eastern Europe Market Value Share and BPS Analysis by Country, 2025 and 2035
  • Figure 17: East Asia Market Value Share and BPS Analysis by Country, 2025 and 2035
  • Figure 18: South Asia and Pacific Market Value Share and BPS Analysis by Country, 2025 and 2035
  • Figure 19: Middle East & Africa Market Value Share and BPS Analysis by Country, 2025 and 2035
  • Figure 20: Global Market - Tier Structure Analysis
  • Figure 21: Global Market - Company Share Analysis

Frequently Asked Questions

How big is the water activated tape dispensers market in 2025?

The global water activated tape dispensers market is estimated to be valued at USD 36.2 million in 2025.

What will be the size of water activated tape dispensers market in 2035?

The market size for the water activated tape dispensers market is projected to reach USD 98.1 million by 2035.

How much will be the water activated tape dispensers market growth between 2025 and 2035?

The water activated tape dispensers market is expected to grow at a 10.5% CAGR between 2025 and 2035.

What are the key product types in the water activated tape dispensers market?

The key product types in water activated tape dispensers market are automatic and manual.

Which end use industries segment to contribute significant share in the water activated tape dispensers market in 2025?

In terms of end use industries, shipping & logistics segment to command 32.7% share in the water activated tape dispensers market in 2025.

Explore Similar Insights

Future Market Insights

Water Activated Tape Dispensers Market