Waterway Transportation Software Market Size and Share Forecast Outlook 2025 to 2035

The waterway transportation software market is estimated to be valued at USD 86.7 billion in 2025 and is projected to reach USD 178.6 billion by 2035, registering a compound annual growth rate (CAGR) of 7.5% over the forecast period.

The waterway transportation software market, with an estimated value of USD 86.7 billion in 2025 and projected to reach USD 178.6 billion by 2035 at a CAGR of 7.5%, demonstrates characteristics consistent with a market transitioning from early growth to a more mature adoption phase. Initial uptake, represented by the modest increase from USD 86.7 billion to USD 100.2 billion in the first three years, reflects early adoption by forward-looking shipping operators, port authorities, and logistics integrators seeking operational efficiency, route optimization, and regulatory compliance. This period is indicative of the early majority segment beginning to adopt software solutions that integrate scheduling, cargo tracking, and performance analytics.

From the mid-period of 2028 to 2032, the market experiences accelerated adoption, moving from USD 107.7 billion to USD 124.4 billion, signaling that technology acceptance has broadened across the industry. Factors such as integration with IoT-enabled sensors, AI-based predictive maintenance, and regulatory compliance modules contribute to higher adoption rates, corresponding to the late majority phase in the lifecycle.

The latter phase, covering 2033 to 2035, shows a continued but slightly tempered growth reaching USD 178.6 billion, characteristic of a market approaching maturity with widespread deployment and saturation among large-scale operators. The trajectory suggests that adoption is steadily moving through the early and late majority phases, with incremental gains driven by technological innovation, regulatory alignment, and operational efficiency requirements in global waterway transport.
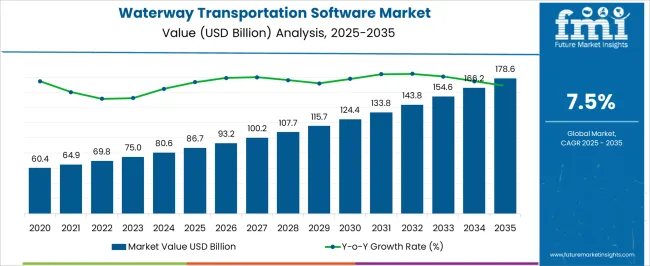
Quick Stats for Waterway Transportation Software Market

  • Waterway Transportation Software Market Value (2025): USD 86.7 billion
  • Waterway Transportation Software Market Forecast Value (2035): USD 178.6 billion
  • Waterway Transportation Software Market Forecast CAGR: 7.5%
  • Leading Segment in Waterway Transportation Software Market in 2025: Software (48.6%)
  • Key Growth Regions in Waterway Transportation Software Market: North America, Asia-Pacific, Europe
  • Top Players in Waterway Transportation Software Market: ABS Wavesight, Accenture Plc, Bass Software Ltd., Cognizant Technology Solutions Corp., Descartes Systems Group, DNV GL, Flexport Inc., IBS Software, Oracle Corporation, SAP SE

Waterway Transportation Software Market Market Value Analysis

Waterway Transportation Software Market Key Takeaways

Metric Value
Waterway Transportation Software Market Estimated Value in (2025 E) USD 86.7 billion
Waterway Transportation Software Market Forecast Value in (2035 F) USD 178.6 billion
Forecast CAGR (2025 to 2035) 7.5%

The waterway transportation software market represents a specialized segment within the global maritime logistics and transportation management industry, emphasizing operational efficiency, route optimization, and cargo tracking. Within the broader transportation management systems sector, it accounts for about 5.3%, driven by adoption across shipping companies, port operators, and inland waterway networks. In the fleet management and logistics software segment, it holds nearly 4.7%, reflecting demand for scheduling, monitoring, and real-time performance analytics. Across the smart shipping and digital maritime solutions market, the share is 4.2%, supporting integration with IoT devices, sensors, and automated reporting systems. Within the port and terminal operations category, it represents 3.8%, highlighting its role in berth allocation, cargo handling, and efficiency improvement.

In the supply chain visibility and maritime compliance sector, it secures 3.4%, emphasizing regulatory adherence, safety monitoring, and predictive maintenance capabilities. Recent developments in this market have focused on cloud-based platforms, AI analytics, and digital twin integration. Innovations include automated route planning, predictive vessel maintenance, and real-time cargo tracking solutions to enhance operational efficiency. Key players are collaborating with shipping companies, port authorities, and technology providers to deploy end-to-end digital solutions for waterway transport. Adoption of blockchain-enabled cargo documentation, IoT sensor networks, and AI-driven performance analytics is gaining traction to improve transparency, reduce delays, and optimize fuel consumption. The integration with smart port infrastructure and sustainable shipping initiatives is being deployed to support emission reduction and operational efficiency. These trends demonstrate how technology, data-driven decision-making, and connectivity are shaping the market.

Why is the Waterway Transportation Software Market Growing?

The waterway transportation software market is experiencing steady growth driven by the increasing need for efficient fleet management, route optimization, and real time cargo tracking in maritime operations. Rising global trade volumes, coupled with the push for digital transformation in the shipping industry, are encouraging adoption of advanced software solutions.

Integration of analytics, artificial intelligence, and IoT capabilities is enhancing operational visibility, reducing fuel costs, and improving delivery accuracy. Regulatory compliance requirements related to environmental standards and safety are further supporting the shift toward technology enabled management platforms.

As shipping companies seek to modernize infrastructure and optimize resource utilization, the market outlook remains positive, with continued investments expected in software innovation and integration across global maritime supply chains.

Segmental Analysis

The waterway transportation software market is segmented by component, deployment model, industry vertical, and geographic regions. By component, waterway transportation software market is divided into software and services. In terms of deployment model, waterway transportation software market is classified into on-premises, cloud, and hybrid. Based on industry vertical, waterway transportation software market is segmented into consumer & retail, oil & gas, industrial & manufacturing, energy & mining, aerospace & defense, construction, pharmaceuticals & healthcare, food & beverages, and others. Regionally, the waterway transportation software industry is classified into North America, Latin America, Western Europe, Eastern Europe, Balkan & Baltic Countries, Russia & Belarus, Central Asia, East Asia, South Asia & Pacific, and the Middle East & Africa.
Insights into the Software Component Segment

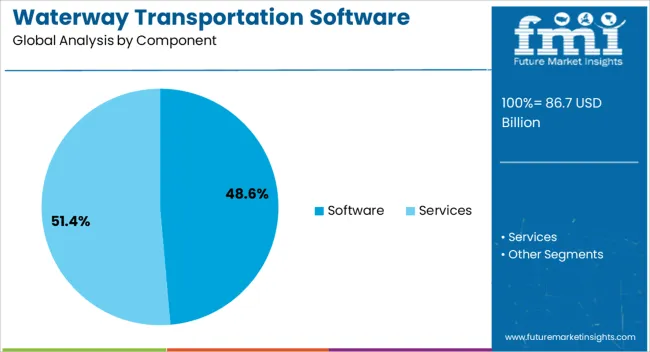
Waterway Transportation Software Market Analysis By Component

The software segment is expected to account for 48.6% of total revenue by 2025 within the component category, making it the most significant contributor. Growth is being driven by increasing demand for solutions that enable real time tracking, route optimization, and automated scheduling.

Software platforms provide operational transparency, enhance decision making, and reduce downtime, resulting in cost savings for shipping operators. Their scalability and adaptability across diverse vessel types and cargo operations have further boosted adoption.

As maritime logistics increasingly shift toward data driven operations, the software segment continues to maintain its leading position.
Insights into the On premises Deployment Model Segment

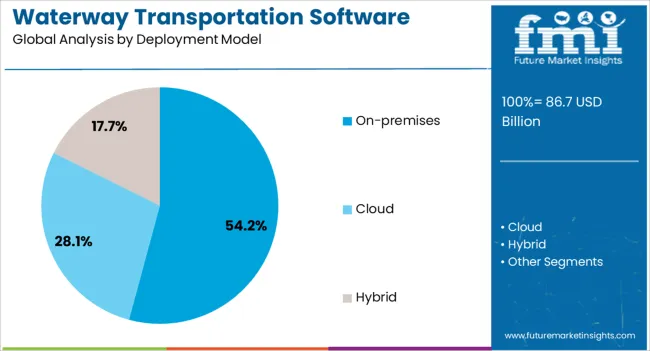
Waterway Transportation Software Market Analysis By Deployment Model

The on premises deployment model segment is projected to represent 54.2% of total market revenue by 2025, positioning it as the dominant deployment approach. This preference is influenced by the need for enhanced data security, control over system customization, and compliance with internal IT governance standards.

Large shipping enterprises and government port authorities often choose on premises solutions to maintain direct oversight of sensitive operational data. Additionally, robust integration with legacy systems and minimized reliance on internet connectivity make this deployment model particularly suitable for critical maritime operations.

These advantages continue to support its market leadership.
Insights into the Consumer and Retail Industry Vertical Segment

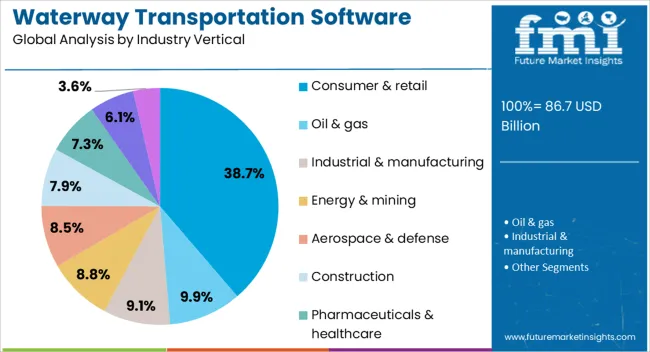
Waterway Transportation Software Market Analysis By Industry Vertical

The consumer and retail industry vertical is expected to hold 38.7% of total revenue by 2025, making it the largest industry segment. Growth is supported by increasing global demand for fast, reliable, and traceable delivery of consumer goods through maritime routes.

Retailers rely on waterway transportation software to manage inventory flows, optimize delivery schedules, and ensure product availability across international markets. The ability to integrate transportation data with broader supply chain systems has improved efficiency and reduced delays, further strengthening adoption.

As e commerce and cross border retail trade expand, this segment’s reliance on advanced transportation software is expected to deepen, sustaining its leading position in the market.

What are the Drivers, Restraints, and Key Trends of the Waterway Transportation Software Market?

The market has grown significantly due to the increasing demand for digitization, automation, and operational efficiency in shipping, ports, and inland waterways. These software solutions streamline vessel scheduling, cargo tracking, route optimization, and regulatory compliance while enhancing safety and resource management. Growth has been fueled by the global expansion of maritime trade, adoption of smart shipping technologies, and the need for real-time operational visibility. Integration with IoT devices, GPS systems, and cloud platforms has enabled improved fleet management, predictive maintenance, and data-driven decision-making, allowing shipping companies to optimize costs, reduce downtime, and improve customer satisfaction across commercial and industrial waterborne transportation networks.

Operational Efficiency and Fleet Management Driving Adoption

Waterway transportation software has been increasingly adopted to optimize fleet operations and enhance efficiency. Features such as automated route planning, cargo load balancing, and vessel performance monitoring enable operators to reduce fuel consumption, turnaround time, and operational costs. Integration with telematics and GPS tracking provides real-time insights into vessel location, speed, and engine performance, facilitating proactive maintenance and scheduling. Port operators and shipping companies leverage these solutions to manage berth allocation, docking schedules, and cargo handling. The automation of repetitive tasks and data-driven analysis reduces human error, improves resource utilization, and supports compliance with maritime regulations, driving broader adoption across commercial and industrial shipping networks.

Technological Innovations Enhancing Software Capabilities

Technological advancements have transformed waterway transportation software, expanding its functionalities and improving operational outcomes. Cloud-based platforms, machine learning, and predictive analytics have enabled advanced performance forecasting, anomaly detection, and proactive decision-making. IoT-enabled sensors collect vessel and cargo data, supporting route optimization, energy efficiency, and maintenance scheduling. Blockchain integration has facilitated secure documentation, cargo tracking, and compliance verification. Furthermore, real-time weather monitoring and automated risk assessment tools have improved navigational safety and cargo integrity. These innovations have enhanced operational efficiency, reduced costs, and strengthened compliance, positioning software solutions as indispensable tools for modern waterborne transport operations across ports, shipping companies, and inland waterway authorities.

Regulatory Compliance and Safety Management

Compliance with international maritime regulations, environmental standards, and safety protocols has driven demand for waterway transportation software. Operators are required to maintain accurate records, track emissions, and implement safety measures for vessels and crew. Software solutions enable automated reporting, regulatory adherence, and monitoring of environmental parameters such as fuel emissions, ballast water management, and waste disposal. Safety modules provide risk assessment, incident reporting, and emergency response management, ensuring crew protection and operational reliability. Adoption of these tools has become crucial for minimizing legal penalties, improving transparency, and enhancing operational credibility, particularly in global shipping and freight transport segments, where adherence to international standards is mandatory.

Integration Challenges and Cost Constraints

Despite growing demand, waterway transportation software adoption faces challenges related to integration and cost. Implementing advanced solutions across legacy systems, multiple vessels, and diverse fleet operations requires technical expertise and upfront investment. Smaller shipping companies may find subscription fees, licensing costs, and implementation expenses prohibitive. Compatibility with existing telematics, IoT sensors, and port systems can create operational hurdles, delaying full utilization. Training personnel to use complex software tools and ensuring cybersecurity further contribute to operational complexity. Addressing these challenges through modular, scalable solutions, technical support, and cost optimization strategies is critical for enabling wider adoption and maximizing the efficiency and benefits of waterway transportation software.
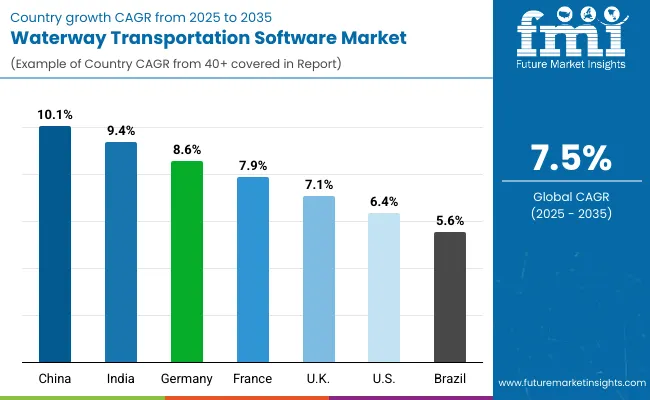
Analysis of Waterway Transportation Software Market By Key Countries

Waterway Transportation Software Market

Countries CAGR
China 10.1%
India 9.4%
Germany 8.6%
France 7.9%
U.K. 7.1%
U.S. 6.4%
Brazil 5.6%

The market is expected to expand at a CAGR of 7.5% from 2025 to 2035, driven by growing digitalization in logistics and fleet management. Germany recorded 8.6%, reflecting adoption of advanced route optimization and cargo tracking systems. China reached 10.1%, fueled by large-scale investments in port automation and inland waterway management. India achieved 9.4%, supported by increasing deployment of integrated software solutions across commercial shipping networks. The United Kingdom reached 7.1%, where modernization of inland and coastal transportation systems spurred software utilization. The United States posted 6.4%, with growth concentrated in smart port solutions and maritime data analytics. Collectively, these markets represent key hubs of technological deployment, operational efficiency, and software innovation in waterway transportation. This report includes insights on 40+ countries; the top markets are shown here for reference.

Market Expansion of Waterway Transportation Software in China

China is projected to grow at a CAGR of 10.1%, driven by the modernization of inland waterways, port digitization, and increasing adoption of fleet management and logistics optimization software. Adoption has been reinforced by government initiatives aimed at improving shipping efficiency, reducing congestion, and integrating smart port systems. Domestic software providers focus on cloud based, AI enabled, and IoT integrated platforms tailored for cargo tracking, route optimization, and port management. Demand is further supported by growth in domestic shipping and cross border trade along major rivers such as Yangtze and Pearl River.

  • China implemented over 120 smart waterway management systems in 2023.
  • Fleet optimization and cargo tracking solutions contributed to nearly 55% of software adoption.
  • Domestic providers such as Sinotrans Digital and COSCO Shipping Technology expanded AI based platforms in 2023.

Growth Outlook on Waterway Transportation Software in India

India is expected to expand at a CAGR of 9.4%, supported by rising inland shipping volumes, modernization of ports, and increased investment in digital logistics. Adoption has been reinforced by cloud based and mobile integrated platforms for fleet tracking, cargo management, and performance analytics. Domestic software companies are partnering with public and private shipping operators to provide scalable solutions across the Ganga, Brahmaputra, and coastal shipping networks. Government initiatives such as Sagarmala contribute to technology adoption and efficiency improvements.
  • India implemented over 60 waterway software solutions in 2023, covering cargo and fleet operations.
  • Fleet monitoring and route optimization contributed to nearly 50% of demand.
  • Public private collaborations for port digitization increased by 15% year on year in 2023.

Market Dynamics of Waterway Transportation Software in Germany

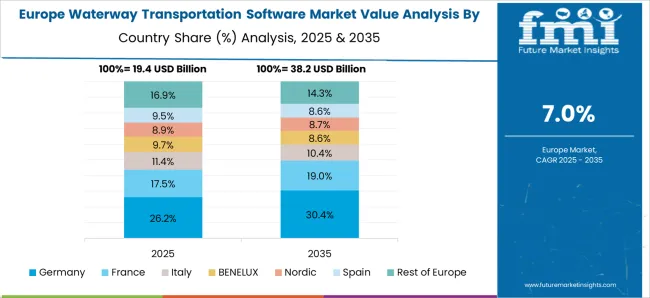
Waterway Transportation Software Market Europe Country Market Share Analysis, 2025 & 2035

Germany is forecast to grow at a CAGR of 8.6%, driven by river and canal traffic management, fleet digitalization, and port operations optimization. Adoption has been reinforced by integration with logistics management systems, IoT enabled monitoring, and automated reporting. Domestic software developers focus on high reliability, security, and compliance with European inland shipping regulations. The Rhine, Elbe, and Danube waterways remain key drivers of software deployment for cargo, passenger, and bulk shipping operations.

  • Germany implemented over 40 inland waterway software solutions in 2023.
  • Port operation management and fleet tracking accounted for nearly 45% of adoption.
  • Integration with automated logistics platforms increased by 12% year on year in 2023.

Demand Forecast for Waterway Transportation Software in the United Kingdom

The United Kingdom is projected to grow at a CAGR of 7.1%, supported by adoption in commercial ports, inland navigation, and river transport operations. Imports of specialized software platforms complement domestic offerings, while integration with fleet analytics, cargo tracking, and energy efficiency modules drives adoption. Growth is reinforced by regulatory focus on maritime safety, efficient cargo handling, and automation in port operations.
  • The U K deployed over 25 software solutions for inland waterways and port management in 2023.
  • Fleet monitoring and cargo tracking accounted for nearly 40% of adoption.
  • Integration with energy efficient vessel operations increased by 10% in 2023.

Future Growth of Waterway Transportation Software in the United States

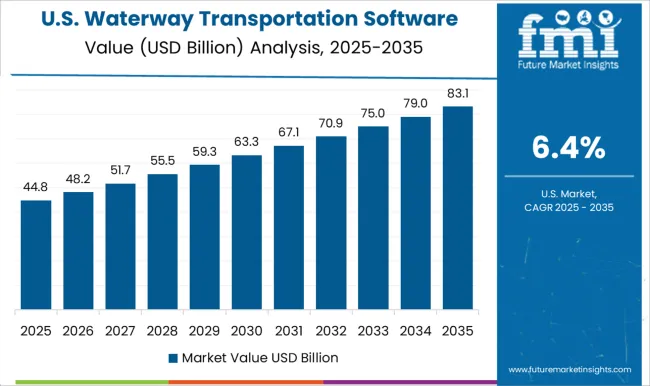
Waterway Transportation Software Market Country Value Analysis

The United States is anticipated to grow at a CAGR of 6.4%, supported by modernization of inland waterways, digitization of fleet management, and adoption of cargo and port management software. Domestic developers focus on cloud based platforms, predictive analytics, and IoT enabled monitoring for barges, cargo vessels, and inland ports. Government programs promoting inland waterway efficiency and safety, particularly along the Mississippi, Ohio, and Columbia rivers, drive market expansion.
  • The U S implemented over 50 software solutions for fleet and cargo management in 2023.
  • Inland port operations and fleet optimization contributed to nearly 45% of adoption.
  • Predictive analytics and IoT enabled monitoring solutions grew by 12% year on year in 2023.

Competitive Landscape of Waterway Transportation Software Market

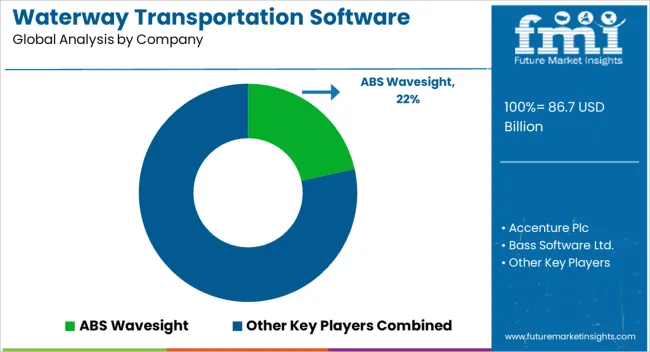
Waterway Transportation Software Market Analysis By Company

The market is driven by global software providers, technology integrators, and maritime-focused solution developers. ABS Wavesight leverages specialized analytics and fleet performance monitoring tools, providing actionable insights to shipping operators. Accenture Plc and Cognizant Technology Solutions Corp. emphasize digital transformation, integrating predictive analytics, logistics optimization, and operational efficiency for maritime clients. Bass Software Ltd. and Descartes Systems Group focus on cargo management, port operations, and compliance solutions, helping shipping companies streamline documentation and improve supply chain visibility. DNV GL combines risk management, vessel performance monitoring, and regulatory compliance tools, establishing a strong presence in safety-focused software solutions.

Flexport Inc. and IBS Software deliver cloud-based platforms enabling end-to-end tracking, scheduling, and optimization for containerized and bulk shipping. Major ERP and enterprise solution providers such as Oracle Corporation and SAP SE integrate waterway transport modules with broader logistics and supply chain systems, enhancing operational planning and resource management. Competitive dynamics in this market emphasize software interoperability, real-time data analytics, cloud adoption, regulatory compliance, and the ability to provide scalable solutions across fleets, ports, and shipping networks worldwide.

Key Players in the Waterway Transportation Software Market

  • ABS Wavesight
  • Accenture Plc
  • Bass Software Ltd.
  • Cognizant Technology Solutions Corp.
  • Descartes Systems Group
  • DNV GL
  • Flexport Inc.
  • IBS Software
  • Oracle Corporation
  • SAP SE

Scope of the Report

Item Value
Quantitative Units USD 86.7 billion
Component Software and Services
Deployment Model On-premises, Cloud, and Hybrid
Industry Vertical Consumer & retail, Oil & gas, Industrial & manufacturing, Energy & mining, Aerospace & defense, Construction, Pharmaceuticals & healthcare, Food & beverages, and Others
Regions Covered North America, Europe, Asia-Pacific, Latin America, Middle East & Africa
Country Covered United States, Canada, Germany, France, United Kingdom, China, Japan, India, Brazil, South Africa
Key Companies Profiled ABS Wavesight, Accenture Plc, Bass Software Ltd., Cognizant Technology Solutions Corp., Descartes Systems Group, DNV GL, Flexport Inc., IBS Software, Oracle Corporation, and SAP SE
Additional Attributes Dollar sales by software type and application, demand dynamics across cargo shipping, passenger transport, and port operations, regional trends in maritime digitalization adoption, innovation in route optimization, fleet monitoring, and predictive analytics, environmental impact of fuel efficiency improvements and emissions reduction, and emerging use cases in smart ports, automated scheduling, and integrated logistics management.

Waterway Transportation Software Market by Segments

Component:

  • Software
  • Services

Deployment Model:

  • On-premises
  • Cloud
  • Hybrid

Industry Vertical:

  • Consumer & retail
  • Oil & gas
  • Industrial & manufacturing
  • Energy & mining
  • Aerospace & defense
  • Construction
  • Pharmaceuticals & healthcare
  • Food & beverages
  • Others

Region:

  • North America
    • U.S.
    • Canada
    • Mexico
  • Latin America
    • Brazil
    • Chile
    • Rest of Latin America
  • Western Europe
    • Germany
    • U.K.
    • Italy
    • Spain
    • France
    • Nordic
    • BENELUX
    • Rest of Western Europe
  • Eastern Europe
    • Russia
    • Poland
    • Hungary
    • Balkan & Baltic
    • Rest of Eastern Europe
  • East Asia
    • China
    • Japan
    • South Korea
  • South Asia and Pacific
    • India
    • ASEAN
    • Australia & New Zealand
    • Rest of South Asia and Pacific
  • Middle East & Africa
    • Kingdom of Saudi Arabia
    • Other GCC Countries
    • Turkiye
    • South Africa
    • Other African Union
    • Rest of Middle East & Africa

Table of Content

  1. Executive Summary
    • Global Market Outlook
    • Demand-side Trends
    • Supply-side Trends
    • Technology Roadmap Analysis
    • Analysis and Recommendations
  2. Market Overview
    • Market Coverage / Taxonomy
    • Market Definition / Scope / Limitations
  3. Market Background
    • Market Dynamics
      • Drivers
      • Restraints
      • Opportunity
      • Trends
    • Scenario Forecast
      • Demand in Optimistic Scenario
      • Demand in Likely Scenario
      • Demand in Conservative Scenario
    • Opportunity Map Analysis
    • Product Life Cycle Analysis
    • Supply Chain Analysis
    • Investment Feasibility Matrix
    • Value Chain Analysis
    • PESTLE and Porter’s Analysis
    • Regulatory Landscape
    • Regional Parent Market Outlook
    • Production and Consumption Statistics
    • Import and Export Statistics
  4. Global Waterway Transportation Software Market Analysis 2020-2024 and Forecast, 2025-2035
    • Historical Market Size Value (USD Mn) Analysis, 2020-2024
    • Current and Future Market Size Value (USD Mn) Projections, 2025-2035
      • Y-o-Y Growth Trend Analysis
      • Absolute $ Opportunity Analysis
  5. Global Waterway Transportation Software Market Pricing Analysis 2020-2024 and Forecast 2025-2035
  6. Global Waterway Transportation Software Market Analysis 2020-2024 and Forecast 2025-2035, By Component
    • Introduction / Key Findings
    • Historical Market Size Value (USD Mn) Analysis By Component , 2020-2024
    • Current and Future Market Size Value (USD Mn) Analysis and Forecast By Component , 2025-2035
      • Software
        • Warehousing
        • Vessel tracking
        • Freight security
        • Yard management
        • Audit & claim
        • Ship broker software
        • Maritime software
        • Others
      • Services
        • Managed services
        • Consulting/customization services
        • Training services
    • Y-o-Y Growth Trend Analysis By Component , 2020-2024
    • Absolute $ Opportunity Analysis By Component , 2025-2035
  7. Global Waterway Transportation Software Market Analysis 2020-2024 and Forecast 2025-2035, By Deployment Model
    • Introduction / Key Findings
    • Historical Market Size Value (USD Mn) Analysis By Deployment Model, 2020-2024
    • Current and Future Market Size Value (USD Mn) Analysis and Forecast By Deployment Model, 2025-2035
      • On-premises
      • Cloud
      • Hybrid
    • Y-o-Y Growth Trend Analysis By Deployment Model, 2020-2024
    • Absolute $ Opportunity Analysis By Deployment Model, 2025-2035
  8. Global Waterway Transportation Software Market Analysis 2020-2024 and Forecast 2025-2035, By Industry Vertical
    • Introduction / Key Findings
    • Historical Market Size Value (USD Mn) Analysis By Industry Vertical, 2020-2024
    • Current and Future Market Size Value (USD Mn) Analysis and Forecast By Industry Vertical, 2025-2035
      • Consumer & retail
      • Oil & gas
      • Industrial & manufacturing
      • Energy & mining
      • Aerospace & defense
      • Construction
      • Pharmaceuticals & healthcare
      • Food & beverages
      • Others
    • Y-o-Y Growth Trend Analysis By Industry Vertical, 2020-2024
    • Absolute $ Opportunity Analysis By Industry Vertical, 2025-2035
  9. Global Waterway Transportation Software Market Analysis 2020-2024 and Forecast 2025-2035, By Region
    • Introduction
    • Historical Market Size Value (USD Mn) Analysis By Region, 2020-2024
    • Current Market Size Value (USD Mn) Analysis and Forecast By Region, 2025-2035
      • North America
      • Latin America
      • Western Europe
      • Eastern Europe
      • East Asia
      • South Asia and Pacific
      • Middle East & Africa
    • Market Attractiveness Analysis By Region
  10. North America Waterway Transportation Software Market Analysis 2020-2024 and Forecast 2025-2035, By Country
    • Historical Market Size Value (USD Mn) Trend Analysis By Market Taxonomy, 2020-2024
    • Market Size Value (USD Mn) Forecast By Market Taxonomy, 2025-2035
      • By Country
        • U.S.
        • Canada
        • Mexico
      • By Component
      • By Deployment Model
      • By Industry Vertical
    • Market Attractiveness Analysis
      • By Country
      • By Component
      • By Deployment Model
      • By Industry Vertical
    • Key Takeaways
  11. Latin America Waterway Transportation Software Market Analysis 2020-2024 and Forecast 2025-2035, By Country
    • Historical Market Size Value (USD Mn) Trend Analysis By Market Taxonomy, 2020-2024
    • Market Size Value (USD Mn) Forecast By Market Taxonomy, 2025-2035
      • By Country
        • Brazil
        • Chile
        • Rest of Latin America
      • By Component
      • By Deployment Model
      • By Industry Vertical
    • Market Attractiveness Analysis
      • By Country
      • By Component
      • By Deployment Model
      • By Industry Vertical
    • Key Takeaways
  12. Western Europe Waterway Transportation Software Market Analysis 2020-2024 and Forecast 2025-2035, By Country
    • Historical Market Size Value (USD Mn) Trend Analysis By Market Taxonomy, 2020-2024
    • Market Size Value (USD Mn) Forecast By Market Taxonomy, 2025-2035
      • By Country
        • Germany
        • U.K.
        • Italy
        • Spain
        • France
        • Nordic
        • BENELUX
        • Rest of Western Europe
      • By Component
      • By Deployment Model
      • By Industry Vertical
    • Market Attractiveness Analysis
      • By Country
      • By Component
      • By Deployment Model
      • By Industry Vertical
    • Key Takeaways
  13. Eastern Europe Waterway Transportation Software Market Analysis 2020-2024 and Forecast 2025-2035, By Country
    • Historical Market Size Value (USD Mn) Trend Analysis By Market Taxonomy, 2020-2024
    • Market Size Value (USD Mn) Forecast By Market Taxonomy, 2025-2035
      • By Country
        • Russia
        • Poland
        • Hungary
        • Balkan & Baltic
        • Rest of Eastern Europe
      • By Component
      • By Deployment Model
      • By Industry Vertical
    • Market Attractiveness Analysis
      • By Country
      • By Component
      • By Deployment Model
      • By Industry Vertical
    • Key Takeaways
  14. East Asia Waterway Transportation Software Market Analysis 2020-2024 and Forecast 2025-2035, By Country
    • Historical Market Size Value (USD Mn) Trend Analysis By Market Taxonomy, 2020-2024
    • Market Size Value (USD Mn) Forecast By Market Taxonomy, 2025-2035
      • By Country
        • China
        • Japan
        • South Korea
      • By Component
      • By Deployment Model
      • By Industry Vertical
    • Market Attractiveness Analysis
      • By Country
      • By Component
      • By Deployment Model
      • By Industry Vertical
    • Key Takeaways
  15. South Asia and Pacific Waterway Transportation Software Market Analysis 2020-2024 and Forecast 2025-2035, By Country
    • Historical Market Size Value (USD Mn) Trend Analysis By Market Taxonomy, 2020-2024
    • Market Size Value (USD Mn) Forecast By Market Taxonomy, 2025-2035
      • By Country
        • India
        • ASEAN
        • Australia & New Zealand
        • Rest of South Asia and Pacific
      • By Component
      • By Deployment Model
      • By Industry Vertical
    • Market Attractiveness Analysis
      • By Country
      • By Component
      • By Deployment Model
      • By Industry Vertical
    • Key Takeaways
  16. Middle East & Africa Waterway Transportation Software Market Analysis 2020-2024 and Forecast 2025-2035, By Country
    • Historical Market Size Value (USD Mn) Trend Analysis By Market Taxonomy, 2020-2024
    • Market Size Value (USD Mn) Forecast By Market Taxonomy, 2025-2035
      • By Country
        • Kingdom of Saudi Arabia
        • Other GCC Countries
        • Turkiye
        • South Africa
        • Other African Union
        • Rest of Middle East & Africa
      • By Component
      • By Deployment Model
      • By Industry Vertical
    • Market Attractiveness Analysis
      • By Country
      • By Component
      • By Deployment Model
      • By Industry Vertical
    • Key Takeaways
  17. Key Countries Waterway Transportation Software Market Analysis
    • U.S.
      • Pricing Analysis
      • Market Share Analysis, 2024
        • By Component
        • By Deployment Model
        • By Industry Vertical
    • Canada
      • Pricing Analysis
      • Market Share Analysis, 2024
        • By Component
        • By Deployment Model
        • By Industry Vertical
    • Mexico
      • Pricing Analysis
      • Market Share Analysis, 2024
        • By Component
        • By Deployment Model
        • By Industry Vertical
    • Brazil
      • Pricing Analysis
      • Market Share Analysis, 2024
        • By Component
        • By Deployment Model
        • By Industry Vertical
    • Chile
      • Pricing Analysis
      • Market Share Analysis, 2024
        • By Component
        • By Deployment Model
        • By Industry Vertical
    • Germany
      • Pricing Analysis
      • Market Share Analysis, 2024
        • By Component
        • By Deployment Model
        • By Industry Vertical
    • U.K.
      • Pricing Analysis
      • Market Share Analysis, 2024
        • By Component
        • By Deployment Model
        • By Industry Vertical
    • Italy
      • Pricing Analysis
      • Market Share Analysis, 2024
        • By Component
        • By Deployment Model
        • By Industry Vertical
    • Spain
      • Pricing Analysis
      • Market Share Analysis, 2024
        • By Component
        • By Deployment Model
        • By Industry Vertical
    • France
      • Pricing Analysis
      • Market Share Analysis, 2024
        • By Component
        • By Deployment Model
        • By Industry Vertical
    • India
      • Pricing Analysis
      • Market Share Analysis, 2024
        • By Component
        • By Deployment Model
        • By Industry Vertical
    • ASEAN
      • Pricing Analysis
      • Market Share Analysis, 2024
        • By Component
        • By Deployment Model
        • By Industry Vertical
    • Australia & New Zealand
      • Pricing Analysis
      • Market Share Analysis, 2024
        • By Component
        • By Deployment Model
        • By Industry Vertical
    • China
      • Pricing Analysis
      • Market Share Analysis, 2024
        • By Component
        • By Deployment Model
        • By Industry Vertical
    • Japan
      • Pricing Analysis
      • Market Share Analysis, 2024
        • By Component
        • By Deployment Model
        • By Industry Vertical
    • South Korea
      • Pricing Analysis
      • Market Share Analysis, 2024
        • By Component
        • By Deployment Model
        • By Industry Vertical
    • Russia
      • Pricing Analysis
      • Market Share Analysis, 2024
        • By Component
        • By Deployment Model
        • By Industry Vertical
    • Poland
      • Pricing Analysis
      • Market Share Analysis, 2024
        • By Component
        • By Deployment Model
        • By Industry Vertical
    • Hungary
      • Pricing Analysis
      • Market Share Analysis, 2024
        • By Component
        • By Deployment Model
        • By Industry Vertical
    • Kingdom of Saudi Arabia
      • Pricing Analysis
      • Market Share Analysis, 2024
        • By Component
        • By Deployment Model
        • By Industry Vertical
    • Turkiye
      • Pricing Analysis
      • Market Share Analysis, 2024
        • By Component
        • By Deployment Model
        • By Industry Vertical
    • South Africa
      • Pricing Analysis
      • Market Share Analysis, 2024
        • By Component
        • By Deployment Model
        • By Industry Vertical
  18. Market Structure Analysis
    • Competition Dashboard
    • Competition Benchmarking
    • Market Share Analysis of Top Players
      • By Regional
      • By Component
      • By Deployment Model
      • By Industry Vertical
  19. Competition Analysis
    • Competition Deep Dive
      • ABS Wavesight
        • Overview
        • Product Portfolio
        • Profitability by Market Segments (Product/Age /Sales Channel/Region)
        • Sales Footprint
        • Strategy Overview
          • Marketing Strategy
          • Product Strategy
          • Channel Strategy
      • Accenture Plc
      • Bass Software Ltd.
      • Cognizant Technology Solutions Corp.
      • Descartes Systems Group
      • DNV GL
      • Flexport Inc.
      • IBS Software
      • Oracle Corporation
      • SAP SE
  20. Assumptions & Acronyms Used
  21. Research Methodology

List of Tables

  • Table 1: Global Waterway Transportation Software Market Value (USD Mn) Forecast by Region, 2020-2035
  • Table 2: Global Waterway Transportation Software Market Value (USD Mn) Forecast by Component , 2020-2035
  • Table 3: Global Waterway Transportation Software Market Value (USD Mn) Forecast by Deployment Model, 2020-2035
  • Table 4: Global Waterway Transportation Software Market Value (USD Mn) Forecast by Industry Vertical, 2020-2035
  • Table 5: North America Waterway Transportation Software Market Value (USD Mn) Forecast by Country, 2020-2035
  • Table 6: North America Waterway Transportation Software Market Value (USD Mn) Forecast by Component , 2020-2035
  • Table 7: North America Waterway Transportation Software Market Value (USD Mn) Forecast by Deployment Model, 2020-2035
  • Table 8: North America Waterway Transportation Software Market Value (USD Mn) Forecast by Industry Vertical, 2020-2035
  • Table 9: Latin America Waterway Transportation Software Market Value (USD Mn) Forecast by Country, 2020-2035
  • Table 10: Latin America Waterway Transportation Software Market Value (USD Mn) Forecast by Component , 2020-2035
  • Table 11: Latin America Waterway Transportation Software Market Value (USD Mn) Forecast by Deployment Model, 2020-2035
  • Table 12: Latin America Waterway Transportation Software Market Value (USD Mn) Forecast by Industry Vertical, 2020-2035
  • Table 13: Western Europe Waterway Transportation Software Market Value (USD Mn) Forecast by Country, 2020-2035
  • Table 14: Western Europe Waterway Transportation Software Market Value (USD Mn) Forecast by Component , 2020-2035
  • Table 15: Western Europe Waterway Transportation Software Market Value (USD Mn) Forecast by Deployment Model, 2020-2035
  • Table 16: Western Europe Waterway Transportation Software Market Value (USD Mn) Forecast by Industry Vertical, 2020-2035
  • Table 17: Eastern Europe Waterway Transportation Software Market Value (USD Mn) Forecast by Country, 2020-2035
  • Table 18: Eastern Europe Waterway Transportation Software Market Value (USD Mn) Forecast by Component , 2020-2035
  • Table 19: Eastern Europe Waterway Transportation Software Market Value (USD Mn) Forecast by Deployment Model, 2020-2035
  • Table 20: Eastern Europe Waterway Transportation Software Market Value (USD Mn) Forecast by Industry Vertical, 2020-2035
  • Table 21: East Asia Waterway Transportation Software Market Value (USD Mn) Forecast by Country, 2020-2035
  • Table 22: East Asia Waterway Transportation Software Market Value (USD Mn) Forecast by Component , 2020-2035
  • Table 23: East Asia Waterway Transportation Software Market Value (USD Mn) Forecast by Deployment Model, 2020-2035
  • Table 24: East Asia Waterway Transportation Software Market Value (USD Mn) Forecast by Industry Vertical, 2020-2035
  • Table 25: South Asia and Pacific Waterway Transportation Software Market Value (USD Mn) Forecast by Country, 2020-2035
  • Table 26: South Asia and Pacific Waterway Transportation Software Market Value (USD Mn) Forecast by Component , 2020-2035
  • Table 27: South Asia and Pacific Waterway Transportation Software Market Value (USD Mn) Forecast by Deployment Model, 2020-2035
  • Table 28: South Asia and Pacific Waterway Transportation Software Market Value (USD Mn) Forecast by Industry Vertical, 2020-2035
  • Table 29: Middle East & Africa Waterway Transportation Software Market Value (USD Mn) Forecast by Country, 2020-2035
  • Table 30: Middle East & Africa Waterway Transportation Software Market Value (USD Mn) Forecast by Component , 2020-2035
  • Table 31: Middle East & Africa Waterway Transportation Software Market Value (USD Mn) Forecast by Deployment Model, 2020-2035
  • Table 32: Middle East & Africa Waterway Transportation Software Market Value (USD Mn) Forecast by Industry Vertical, 2020-2035

List of Figures

  • Figure 1: Global Waterway Transportation Software Market Pricing Analysis
  • Figure 2: Global Waterway Transportation Software Market Value (USD Mn) Forecast 2020–2035
  • Figure 3: Global Waterway Transportation Software Market Value Share and BPS Analysis by Component , 2025 and 2035
  • Figure 4: Global Waterway Transportation Software Market Y-o-Y Growth Comparison by Component , 2025–2035
  • Figure 5: Global Waterway Transportation Software Market Attractiveness Analysis by Component
  • Figure 6: Global Waterway Transportation Software Market Value Share and BPS Analysis by Deployment Model, 2025 and 2035
  • Figure 7: Global Waterway Transportation Software Market Y-o-Y Growth Comparison by Deployment Model, 2025–2035
  • Figure 8: Global Waterway Transportation Software Market Attractiveness Analysis by Deployment Model
  • Figure 9: Global Waterway Transportation Software Market Value Share and BPS Analysis by Industry Vertical, 2025 and 2035
  • Figure 10: Global Waterway Transportation Software Market Y-o-Y Growth Comparison by Industry Vertical, 2025–2035
  • Figure 11: Global Waterway Transportation Software Market Attractiveness Analysis by Industry Vertical
  • Figure 12: Global Waterway Transportation Software Market Value (USD Mn) Share and BPS Analysis by Region, 2025 and 2035
  • Figure 13: Global Waterway Transportation Software Market Y-o-Y Growth Comparison by Region, 2025–2035
  • Figure 14: Global Waterway Transportation Software Market Attractiveness Analysis by Region
  • Figure 15: North America Waterway Transportation Software Market Incremental Dollar Opportunity, 2025–2035
  • Figure 16: Latin America Waterway Transportation Software Market Incremental Dollar Opportunity, 2025–2035
  • Figure 17: Western Europe Waterway Transportation Software Market Incremental Dollar Opportunity, 2025–2035
  • Figure 18: Eastern Europe Waterway Transportation Software Market Incremental Dollar Opportunity, 2025–2035
  • Figure 19: East Asia Waterway Transportation Software Market Incremental Dollar Opportunity, 2025–2035
  • Figure 20: South Asia and Pacific Waterway Transportation Software Market Incremental Dollar Opportunity, 2025–2035
  • Figure 21: Middle East & Africa Waterway Transportation Software Market Incremental Dollar Opportunity, 2025–2035
  • Figure 22: North America Waterway Transportation Software Market Value Share and BPS Analysis by Country, 2025 and 2035
  • Figure 23: North America Waterway Transportation Software Market Value Share and BPS Analysis by Component , 2025 and 2035
  • Figure 24: North America Waterway Transportation Software Market Y-o-Y Growth Comparison by Component , 2025–2035
  • Figure 25: North America Waterway Transportation Software Market Attractiveness Analysis by Component
  • Figure 26: North America Waterway Transportation Software Market Value Share and BPS Analysis by Deployment Model, 2025 and 2035
  • Figure 27: North America Waterway Transportation Software Market Y-o-Y Growth Comparison by Deployment Model, 2025–2035
  • Figure 28: North America Waterway Transportation Software Market Attractiveness Analysis by Deployment Model
  • Figure 29: North America Waterway Transportation Software Market Value Share and BPS Analysis by Industry Vertical, 2025 and 2035
  • Figure 30: North America Waterway Transportation Software Market Y-o-Y Growth Comparison by Industry Vertical, 2025–2035
  • Figure 31: North America Waterway Transportation Software Market Attractiveness Analysis by Industry Vertical
  • Figure 32: Latin America Waterway Transportation Software Market Value Share and BPS Analysis by Country, 2025 and 2035
  • Figure 33: Latin America Waterway Transportation Software Market Value Share and BPS Analysis by Component , 2025 and 2035
  • Figure 34: Latin America Waterway Transportation Software Market Y-o-Y Growth Comparison by Component , 2025–2035
  • Figure 35: Latin America Waterway Transportation Software Market Attractiveness Analysis by Component
  • Figure 36: Latin America Waterway Transportation Software Market Value Share and BPS Analysis by Deployment Model, 2025 and 2035
  • Figure 37: Latin America Waterway Transportation Software Market Y-o-Y Growth Comparison by Deployment Model, 2025–2035
  • Figure 38: Latin America Waterway Transportation Software Market Attractiveness Analysis by Deployment Model
  • Figure 39: Latin America Waterway Transportation Software Market Value Share and BPS Analysis by Industry Vertical, 2025 and 2035
  • Figure 40: Latin America Waterway Transportation Software Market Y-o-Y Growth Comparison by Industry Vertical, 2025–2035
  • Figure 41: Latin America Waterway Transportation Software Market Attractiveness Analysis by Industry Vertical
  • Figure 42: Western Europe Waterway Transportation Software Market Value Share and BPS Analysis by Country, 2025 and 2035
  • Figure 43: Western Europe Waterway Transportation Software Market Value Share and BPS Analysis by Component , 2025 and 2035
  • Figure 44: Western Europe Waterway Transportation Software Market Y-o-Y Growth Comparison by Component , 2025–2035
  • Figure 45: Western Europe Waterway Transportation Software Market Attractiveness Analysis by Component
  • Figure 46: Western Europe Waterway Transportation Software Market Value Share and BPS Analysis by Deployment Model, 2025 and 2035
  • Figure 47: Western Europe Waterway Transportation Software Market Y-o-Y Growth Comparison by Deployment Model, 2025–2035
  • Figure 48: Western Europe Waterway Transportation Software Market Attractiveness Analysis by Deployment Model
  • Figure 49: Western Europe Waterway Transportation Software Market Value Share and BPS Analysis by Industry Vertical, 2025 and 2035
  • Figure 50: Western Europe Waterway Transportation Software Market Y-o-Y Growth Comparison by Industry Vertical, 2025–2035
  • Figure 51: Western Europe Waterway Transportation Software Market Attractiveness Analysis by Industry Vertical
  • Figure 52: Eastern Europe Waterway Transportation Software Market Value Share and BPS Analysis by Country, 2025 and 2035
  • Figure 53: Eastern Europe Waterway Transportation Software Market Value Share and BPS Analysis by Component , 2025 and 2035
  • Figure 54: Eastern Europe Waterway Transportation Software Market Y-o-Y Growth Comparison by Component , 2025–2035
  • Figure 55: Eastern Europe Waterway Transportation Software Market Attractiveness Analysis by Component
  • Figure 56: Eastern Europe Waterway Transportation Software Market Value Share and BPS Analysis by Deployment Model, 2025 and 2035
  • Figure 57: Eastern Europe Waterway Transportation Software Market Y-o-Y Growth Comparison by Deployment Model, 2025–2035
  • Figure 58: Eastern Europe Waterway Transportation Software Market Attractiveness Analysis by Deployment Model
  • Figure 59: Eastern Europe Waterway Transportation Software Market Value Share and BPS Analysis by Industry Vertical, 2025 and 2035
  • Figure 60: Eastern Europe Waterway Transportation Software Market Y-o-Y Growth Comparison by Industry Vertical, 2025–2035
  • Figure 61: Eastern Europe Waterway Transportation Software Market Attractiveness Analysis by Industry Vertical
  • Figure 62: East Asia Waterway Transportation Software Market Value Share and BPS Analysis by Country, 2025 and 2035
  • Figure 63: East Asia Waterway Transportation Software Market Value Share and BPS Analysis by Component , 2025 and 2035
  • Figure 64: East Asia Waterway Transportation Software Market Y-o-Y Growth Comparison by Component , 2025–2035
  • Figure 65: East Asia Waterway Transportation Software Market Attractiveness Analysis by Component
  • Figure 66: East Asia Waterway Transportation Software Market Value Share and BPS Analysis by Deployment Model, 2025 and 2035
  • Figure 67: East Asia Waterway Transportation Software Market Y-o-Y Growth Comparison by Deployment Model, 2025–2035
  • Figure 68: East Asia Waterway Transportation Software Market Attractiveness Analysis by Deployment Model
  • Figure 69: East Asia Waterway Transportation Software Market Value Share and BPS Analysis by Industry Vertical, 2025 and 2035
  • Figure 70: East Asia Waterway Transportation Software Market Y-o-Y Growth Comparison by Industry Vertical, 2025–2035
  • Figure 71: East Asia Waterway Transportation Software Market Attractiveness Analysis by Industry Vertical
  • Figure 72: South Asia and Pacific Waterway Transportation Software Market Value Share and BPS Analysis by Country, 2025 and 2035
  • Figure 73: South Asia and Pacific Waterway Transportation Software Market Value Share and BPS Analysis by Component , 2025 and 2035
  • Figure 74: South Asia and Pacific Waterway Transportation Software Market Y-o-Y Growth Comparison by Component , 2025–2035
  • Figure 75: South Asia and Pacific Waterway Transportation Software Market Attractiveness Analysis by Component
  • Figure 76: South Asia and Pacific Waterway Transportation Software Market Value Share and BPS Analysis by Deployment Model, 2025 and 2035
  • Figure 77: South Asia and Pacific Waterway Transportation Software Market Y-o-Y Growth Comparison by Deployment Model, 2025–2035
  • Figure 78: South Asia and Pacific Waterway Transportation Software Market Attractiveness Analysis by Deployment Model
  • Figure 79: South Asia and Pacific Waterway Transportation Software Market Value Share and BPS Analysis by Industry Vertical, 2025 and 2035
  • Figure 80: South Asia and Pacific Waterway Transportation Software Market Y-o-Y Growth Comparison by Industry Vertical, 2025–2035
  • Figure 81: South Asia and Pacific Waterway Transportation Software Market Attractiveness Analysis by Industry Vertical
  • Figure 82: Middle East & Africa Waterway Transportation Software Market Value Share and BPS Analysis by Country, 2025 and 2035
  • Figure 83: Middle East & Africa Waterway Transportation Software Market Value Share and BPS Analysis by Component , 2025 and 2035
  • Figure 84: Middle East & Africa Waterway Transportation Software Market Y-o-Y Growth Comparison by Component , 2025–2035
  • Figure 85: Middle East & Africa Waterway Transportation Software Market Attractiveness Analysis by Component
  • Figure 86: Middle East & Africa Waterway Transportation Software Market Value Share and BPS Analysis by Deployment Model, 2025 and 2035
  • Figure 87: Middle East & Africa Waterway Transportation Software Market Y-o-Y Growth Comparison by Deployment Model, 2025–2035
  • Figure 88: Middle East & Africa Waterway Transportation Software Market Attractiveness Analysis by Deployment Model
  • Figure 89: Middle East & Africa Waterway Transportation Software Market Value Share and BPS Analysis by Industry Vertical, 2025 and 2035
  • Figure 90: Middle East & Africa Waterway Transportation Software Market Y-o-Y Growth Comparison by Industry Vertical, 2025–2035
  • Figure 91: Middle East & Africa Waterway Transportation Software Market Attractiveness Analysis by Industry Vertical
  • Figure 92: Global Waterway Transportation Software Market – Tier Structure Analysis
  • Figure 93: Global Waterway Transportation Software Market – Company Share Analysis

Frequently Asked Questions

How big is the waterway transportation software market in 2025?

The global waterway transportation software market is estimated to be valued at USD 86.7 billion in 2025.

What will be the size of waterway transportation software market in 2035?

The market size for the waterway transportation software market is projected to reach USD 178.6 billion by 2035.

How much will be the waterway transportation software market growth between 2025 and 2035?

The waterway transportation software market is expected to grow at a 7.5% CAGR between 2025 and 2035.

What are the key product types in the waterway transportation software market?

The key product types in waterway transportation software market are software, _warehousing, _vessel tracking, _freight security, _yard management, _audit & claim, _ship broker software, _maritime software, _others, services, _managed services, _consulting/customization services and _training services.

Which deployment model segment to contribute significant share in the waterway transportation software market in 2025?

In terms of deployment model, on-premises segment to command 54.2% share in the waterway transportation software market in 2025.

Explore Similar Insights

Future Market Insights

Waterway Transportation Software Market

Chat With

MaRIA

Hi There, I am MaRIA, Your Market Research Intelligence Assistant. How may I help you?