Reports

- Global Locations -

Headquarters

Future Market Insights, Inc.

Christiana Corporate, 200
Continental Drive, Suite 401,
Newark, Delaware - 19713,
United States

T: +1-347-918-3531

Americas

Future Market Insights, Inc.

616 Corporate Way, Suite 2-9018,
Valley Cottage, NY 10989, United States

MEA

Future Market Insights

1602-6 Jumeirah Bay X2 Tower, Plot No: JLT-PH2-X2A,
Jumeirah Lakes Towers, Dubai,
United Arab Emirates

Europe

Future Market Insights

3rd Floor, 207 Regent Street,
W1B 3HH London
United Kingdom

T: + 44 (0) 20 8123 9659

Asia Pacific

Future Market Insights

IndiaLand Global Tech Park, Unit UG-1, Behind Grand HighStreet, Phase 1, Hinjawadi, MH, Pune – 411057, India

Transportation and Security System Market Snapshot (2023 to 2033)

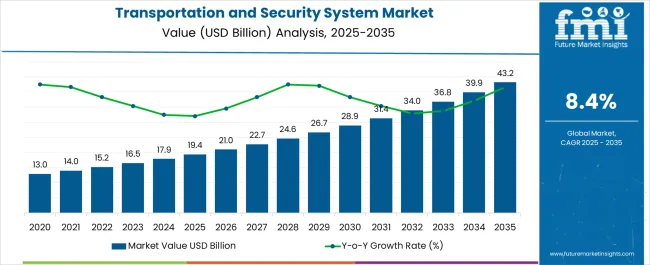
The global transportation and security system market is estimated to reach US$ 17.8 billion in 2023 and is expected to grow to US$ 41.1 billion by 2033, trailing a CAGR of 8.8% during the forecast period.

Surface transportation users expect a certain level of security. Intelligent transportation systems (ITS) provide services like surveillance, control, communications, and information collection and dissemination in real-time, which can help safeguard against threats.

Economic development and sustainability have always been closely linked with transportation, and economies at every level are increasingly dependent on reliable and efficient transportation systems. Employees use transportation systems to get to work, and businesses use them to provide and receive support services and supplies.

Economies in a region are often interconnected by transportation systems. Interstate highways play an essential role in the United States. economy, connecting goods from one region to another. In addition to its importance to national defense, interstate travel also plays an important role in the development of the transportation system.

Attribute Details
Expected Market Value (2023) US$ 17.8 billion
Anticipated Forecast Value (2033) US$ 41.1 billion
Projected Growth Rate (2023 to 2033) CAGR of 8.8%

Don't pay for what you don't need

Customize your report by selecting specific countries or regions and save 30%!

How Does Historical and Future Outlook for Transportation and Security System Market Compare?

According to FMI, transportation and security systems grew at a CAGR of 11.7% between 2018 to 2022. Interconnected systems are being created within transportation networks using the Internet of Things.

Through the integration of sensors and devices, the Internet of Things enables real-time monitoring and control of transportation infrastructure, such as roads, bridges, railways, and airports. As a result, the transportation system becomes more efficient, safer, and easier to maintain.

Due to the increasing reliance on digital infrastructure in transportation systems, protecting them from cyber threats is of paramount importance. Data breaches and hacks are common in transportation networks due to interconnected systems and IoT devices. In order to protect transportation systems, it is critical to use robust encryption, network monitoring, and vulnerability assessments.

With blockchain technology, supply chain security is made more secure and transparent. With blockchain technology, transportation can be more traceable and accountable by recording goods' origins, ownerships, and handlings immutably. By implementing this technology, counterfeiting will be prevented, cargo tracking will be improved, and customs processes will be streamlined. According to FMI’s analysis, transportation and security system market sales are expected to grow at an 8.8% CAGR between 2023 and 2033.

Transport and Security System Market Opportunities?

With the goal of improving transportation efficiency and safety, ITS integrates various technologies, including sensors, communication networks, and data analytics. Connected vehicles, traffic management, real-time information, and automated toll collection are some of the features that are included in the system. Traffic flow is being optimized, congestion is being reduced, and overall transportation experience is being improved by integrating ITS into existing infrastructure.

A revolution in transportation systems could be brought about by the development of self-driving cars and trucks. The use of AVs can reduce traffic congestion, increase safety, and make transportation more efficient. Fully autonomous vehicles are in the process of developing rapidly, with a large number of companies investing in their research and development.

Advanced security systems are continually explored at airports to ensure passenger safety while minimizing inconveniences. Security screening processes are being streamlined through the use of biometric identification methods, such as facial recognition and fingerprint scanning. The system analyzes passenger behavior and detects potential threats using machine learning algorithms as well.
Nikhil Kaitwade
Nikhil Kaitwade

Principal Consultant

Talk to Analyst

Find your sweet spots for generating winning opportunities in this market.

What is the Impact of Rising Demand from Diverse Sectors on Growth?

  • Achieving optimum transportation efficiency and security through the use of advanced technologies including machine learning, data analytics, artificial intelligence, and other advanced technologies.
  • Automation is a promising method to reduce accidents and fatalities, so investment is increasing.
  • New solutions for transportation and security are being created as the freight industry migrates from manual to digital and automated logistics.
  • Increasing efficiency, reducing traffic congestion, and improving user experience through smart transport systems to grow the market.
  • Highways, airports, and public transportation infrastructure are increasingly dependent on video surveillance and security systems.
  • Reducing carbon dioxide emissions and improving energy efficiency in the transportation sector through the development of hydrogen fuel-cell vehicles as sustainable transportation solutions.
  • Integrating transportation and security systems with emerging technologies, such as the Internet of Things (IoT), to improve visibility and control.

Key Restraints to the Transportation and Security System Market

  • Inconvenience to passengers and expensive infrastructure investments are two of the main limitations of the worldwide transportation and security market.
  • A lack of testing for new and emerging technologies and different regulations by governments hamper the market growth.
  • Security application implementation problems stifle market growth in all forms of transportation.
  • Systems and components can be expensive, which hinders growth.
  • Security systems generate false alarms and erroneous alerts, which reduce confidence in security solutions and cause losses.
  • Videos surveillance and other monitoring technologies may pose privacy and security risks.
  • Adaptability of existing security systems to changing threat patterns is limited due to limited technological capabilities.
  • Business compliance costs are high due to complex regulations and compliance requirements.
  • System downtime and power outages caused by operational challenges and power outages.
  • Security systems require skilled personnel to operate and maintain, resulting in additional company costs.

Get the data you need at a Fraction of the cost

Personalize your report by choosing insights you need
and save 40%!

Comparative View of Adjacent Markets

Transportation and Security System Market:

Attributes Transportation and Security System Market
CAGR (2023 to 2033) 8.8%
Market Value (2033) US$ 41.1 billion
Growth Factor Demand for transportation infrastructure is expected to increase due to massive public safety developments and the growth of massive transportation infrastructure.
Opportunity Technology advancements in video surveillance and screening, as well as high returns on investment from enhanced security provides lucrative opportunities in the market.

Car Security System Market:

Attributes Car Security System Market
CAGR (2023 to 2033) 11.4%
Market Value (2033) US$ 40 billion
Growth Factor As car thefts rise and government regulations on integration of anti-theft systems, the market is expected to grow during the forecast period.
Opportunity A range of benefits are expected from the development and innovation of new products by key manufacturers in order to enhance vehicle security and numerous growth opportunities.

Transportation Condensing Units Market:

Attributes Transportation Condensing Units Market
CAGR (2023 to 2033) 6.5%
Market Value (2033) US$ 5.6 billion
Growth Factor Rapid urbanization is set to boost sales in the cold storage industry as a result of the increased use of cold chains, especially in developing countries to grow the market.
Opportunity Concerns about perishable food safety are increasing, as attempt to slow down the growth of bacteria on these foods and reduce the risk for foodborne illness lucrative opportunities in the market.

Country-wise Insights

How Stable is the Supply Capacity of Transportation and Security Systems in China?

Expanding Infrastructure and Accelerating Economies to Grow the Market

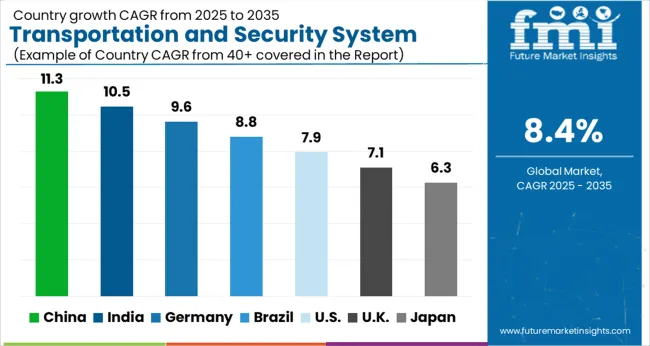
With its increasing number of automotive manufacturers, China will continue to be a significant exporter and importer of transportation and security systems. The market is expected to grow at a CAGR of 10.2% during the forecast period.

The rapid growth of China's economy and urbanization have created a significant demand for transportation systems. Several significant investments have been made in the country's transportation infrastructure, such as high-speed railways, extensive roads, modern airports, and expanded ports. Due to its massive population and growing economy, China's demand for transportation systems continues to rise.

China has also increased its demand for security systems in order to protect its critical assets and enhance public safety. Chinese authorities have implemented a variety of security initiatives, such as video surveillance and facial recognition technology. In order to maintain social stability and ensure safety within the country, advanced security systems have been designed for transportation hubs, public areas, and critical infrastructure.

How do Governmental Regulations in the United States Affect the Transportation and Security System Market?

Government Support and Growing Investments to Grow Demand

Transport and security system are among the top consumers in the United States; however, government regulations are expected to affect their demand. According to the forecast, transport and security system demand will grow at a CAGR of 7.6% in the United States.

Considering the country's vast size and population, transportation systems are in high demand in the United States. Roadways, railways, air transportation, and waterways are all modes of transportation in the transportation sector. Highways, bridges, airports, and ports, which provide efficient and sustainable transportation, remain in high demand.

Intelligent transportation systems (ITS) utilizing technologies such as traffic management, tolling, and vehicle-to-infrastructure communication are increasingly in demand. For public safety and the protection of critical infrastructure, security systems are crucial in the United States.

Cybersecurity, access control, intrusion detection, perimeter security, and video surveillance are among the security systems that are in demand. Transportation hubs, airports, seaports, and public spaces are among the sectors with an increasing demand for advanced security technologies and systems due to concerns about terrorism, crime, and cybersecurity threats.

A recent investment of nearly US$ 1 billion by the United States government in airport security systems may also contribute to demand growth. The United States transportation and security systems market, though lacking a clear consensus, is likely to grow in demand.

How is the United Kingdom expected to Lead the Market for Transportation and Security Systems?

Global Air Travel is Expected to Drive Growth for Transportation and Security Systems Market

According to FMI, the market for transportation and security systems is expected to hold a market share of 13.1% during the forecast period. Increasing demand for roadway vehicles in this country will result in an increase in market growth. Due to the growth of oil and gas industries in the market, demand is expected to increase.

Several major companies have substantial operations in the United Kingdom, including Thales and G4S. Airport security is governed by the United Kingdom Department for Transport, and the country has well-connected air transport. Transport and security solutions could also be driven by smart transportation systems in the United Kingdom.

Category-wise Insights

Which Modes of Transportation and Security Systems Dominate the Market?

A Growing Population and Demand for Automobiles will lead to an Increase in Demand for Transportation and Security Systems

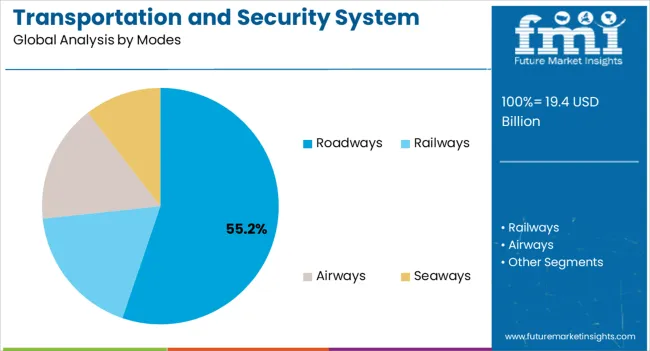
Roadways transportation and security system modes are projected to hold a dominant position throughout the forecast period. This can be attributed to the growing demand for logistic industries and transportation vehicles. The market is projected to grow at a CAGR of 8.6% during the forecast period.

A traffic management system monitors and manages traffic flow with the goal of reducing congestion and improving overall efficiency. Their strategy involves collecting real-time data, analyzing traffic patterns, and implementing strategies like adaptive traffic signal control using technologies like traffic cameras, loop detectors, and vehicle-to-infrastructure communication.

Roadway surveillance cameras monitor traffic, detect incidents, and provide evidence for investigations. Advanced video analytics can be used to identify suspicious or illegal activities with these cameras, including license plate recognition and object tracking.

With the aid of technologies like automatic license plate recognition (ALPR), vehicles can be identified for a variety of purposes, such as law enforcement, toll collection, and traffic management. From images or video footage, ALPR systems extract license plate information using optical character recognition.

Which Top System Influences the Transportation and Security System Market?

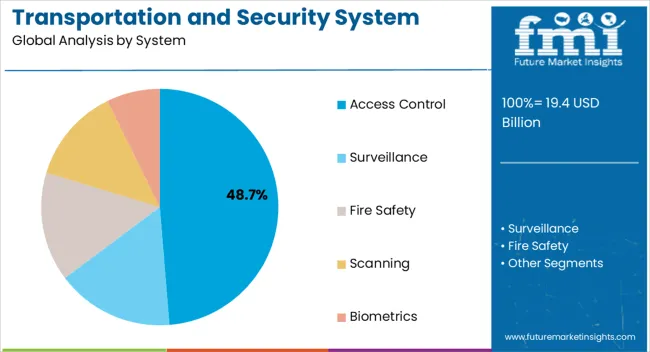
Physical Barriers are expected to Increase Demand for Access Controls in the Market

Entry and exit points have physical barriers like gates, bollards, and barriers to control car traffic. To verify and authorize access, access control gates are either manual or automated and usually equipped with sensors, card readers, or biometrics.

The use of card readers is common when individuals or vehicles are trying to gain access to controlled areas. An RFID card reader reads RFID cards, key fobs, or access codes issued to authorized employees or vehicles. The use of biometrics, such as fingerprint scanners or iris scanners, may also improve security.

Automated License Plate Recognition (ALPR) and Radio Frequency Identification (RFID) are technologies that enable automatic identification and authentication of vehicles. While ALPR systems capture license plate information, dedicated readers at access points can read RFID tags attached to vehicles.

Start-ups in the Transportation and Security System Market

Start-ups play a key role in identifying opportunities for growth in transportation and security. Adapting to market uncertainties and transforming them into results contributes to the industry's expansion. Market growth for transportation and security systems is being driven by a few start-up companies.
  • CargoGuard, a global supply chain network security company, offers a wide range of security products and solutions. A secure intermodal supply chain provides protection against loss, theft, spying, and manipulation of valuable goods, high-end products, and confidential documents throughout all gaps. Integrated with the CargoGaurd portal, some products, such as CargoTainer, CargoKit, and CargoGet, allow easy tracking of goods.
  • Freight Management System specializes in IoT. Among its capabilities are supply chain management, logistics, cargo tracking, and people tracking. In addition to predictive analytics, the solutions are able to map visitor behavior, manage inventory in real-time, and trigger safety and environmental alarms. In addition to warehousing, supply chain management, and transport logistics, the supply chain solutions are also able to handle cargo management. Monitoring fleets and cargo is part of the fleet management solution offered by the company. Devices connected to the Internet of Things are deployed on trucks, trailers, containers, and warehouses.

Competitive Landscape

For key players to maintain a competitive edge and keep their dominance in the market, new and innovative products, solutions, and technologies are needed.

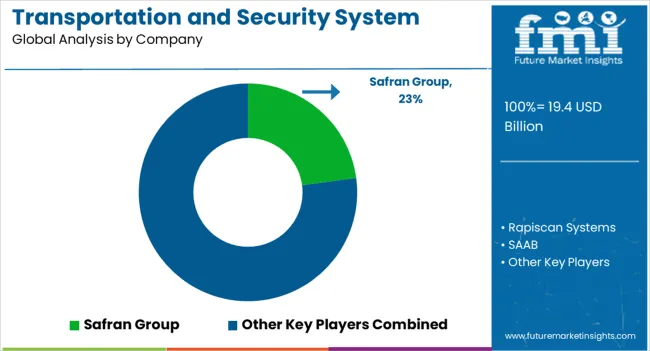
Considering that a small percentage of the market is dominated by a few key players across the globe, the global market can be considered fairly consolidated. The excellent scope of demand creates a high level of participation in the market.

Some of the leading companies operating in the market are:

  • Safran Group
  • Rapiscan Systems
  • SAAB
  • ABB
  • Smiths Group
  • ORBCOMM Inc.
  • Lockheed Martin
  • L-3 Communications
  • Kapsch Group
  • Honeywell International
  • Alstom S.A. (France)
  • Raytheon Company
  • Cisco Systems Inc.
  • ASSA Abloy
  • FLIR Systems
  • Bosch Security Systems
  • ADT Corporation
  • Broadcom Limited
  • Fortinet

Market developments in recent years are:

  • In June 2023, Moore Strategic Ventures announced a $33 million investment into a startup that has been founded by officers who were instrumental in establishing the USA. Army Cyber Command. Washington, D.C.-area Shift5 will be able to expand from protecting military equipment to protecting commercial vehicles, such as locomotives and passenger aircraft.
  • In July 2023, the Transportation Security Administration (TSA) will roll out facial recognition technology at 430 domestic airports, which will be used to screen the United States, air passengers. A number of civil rights and privacy organizations have criticized the TSA's use of Idemia's biometric technology, arguing that it is a method of mass surveillance that does not contribute to preventing terrorism. In 25 airports across the country, the government agency is testing facial-recognition systems, which are proving controversial.

Scope of the Report

Attribute Details
Forecast Period 2023 to 2033
Historical Data Available for 2018 to 2022
Market Analysis US$ billion for value
Key Regions Covered
  • North America
  • Latin America
  • Europe
  • Asia Pacific
  • Middle East & Africa
Key Countries Covered
  • United States
  • Canada
  • Brazil
  • Mexico
  • Germany
  • United Kingdom
  • France
  • Italy
  • Spain
  • China
  • Japan
  • South Korea
  • Singapore
  • Thailand
  • Indonesia
  • Australia
  • New Zealand
  • GCC Countries
  • South Africa
  • Israel
Kay Segments Covered
  • System
  • Modes
  • Region
Key Companies Profiles
  • Safran Group
  • Rapiscan Systems
  • SAAB
  • ABB
  • Smiths Group
  • ORBCOMM Inc.
  • Lockheed Martin
  • L-3 Communications
  • Kapsch Group
  • Honeywell International
  • Alstom S.A. (France)
  • Raytheon Company
  • Cisco Systems Inc.
  • ASSA Abloy
  • FLIR systems
  • Bosch security systems
  • ADT Corporation
  • Broadcom Limited
  • Fortinet
Customization & Pricing Available Upon Request

Key Segments in Transportation and Security System Market

By System:

  • Access Control
  • Surveillance
  • Fire Safety
  • Scanning
  • Biometrics

By Modes:

  • Roadways
  • Railways
  • Airways
  • Seaways

By Region:

  • North America
  • Latin America
  • Asia Pacific
  • Middle East & Africa
  • Europe

Frequently Asked Questions

How did the market perform previously?

Between 2018 and 2022, sales surged at a CAGR of 11.7%.

What will be the market's CAGR between 2023 and 2033?

The market to continue to evolve at an 8.8% CAGR through 2033.

How huge may the market be in 2033?

The market to climb to US$ 41.1 billion by 2033.

What is the current market valuation?

The market is to be valued at US$ 17.8 billion in 2023.

What factor acts as a major market opportunity?

Improved safety yields high returns on investment and lucrative earnings opportunities.

What is the CAGR for China's market growth?

The forecast period is expected to experience a CAGR of 10.2% for the China market.

What is the market expansion CAGR in the United States?

In the United States, demand shall boost at a CAGR of 7.6%.

Table of Content

1. Executive Summary

    1.1. Global Market Outlook

    1.2. Demand-side Trends

    1.3. Supply-side Trends

    1.4. Technology Roadmap Analysis

    1.5. Analysis and Recommendations

2. Market Overview

    2.1. Market Coverage / Taxonomy

    2.2. Market Definition / Scope / Limitations

3. Market Background

    3.1. Market Dynamics

        3.1.1. Drivers

        3.1.2. Restraints

        3.1.3. Opportunity

        3.1.4. Trends

    3.2. Scenario Forecast

        3.2.1. Demand in Optimistic Scenario

        3.2.2. Demand in Likely Scenario

        3.2.3. Demand in Conservative Scenario

    3.3. Opportunity Map Analysis

    3.4. Investment Feasibility Matrix

    3.5. PESTLE and Porter’s Analysis

    3.6. Regulatory Landscape

        3.6.1. By Key Regions

        3.6.2. By Key Countries

    3.7. Regional Parent Market Outlook

4. Global Market Analysis 2018 to 2022 and Forecast, 2023 to 2033

    4.1. Historical Market Size Value (US$ Million) Analysis, 2018 to 2022

    4.2. Current and Future Market Size Value (US$ Million) Projections, 2023 to 2033

        4.2.1. Y-o-Y Growth Trend Analysis

        4.2.2. Absolute $ Opportunity Analysis

5. Global Market Analysis 2018 to 2022 and Forecast 2023 to 2033, By System

    5.1. Introduction / Key Findings

    5.2. Historical Market Size Value (US$ Million) Analysis By System, 2018 to 2022

    5.3. Current and Future Market Size Value (US$ Million) Analysis and Forecast By System, 2023 to 2033

        5.3.1. Access Control

        5.3.2. Surveillance

        5.3.3. Fire Safety

        5.3.4. Scanning

        5.3.5. Biometrics

    5.4. Y-o-Y Growth Trend Analysis By System, 2018 to 2022

    5.5. Absolute $ Opportunity Analysis By System, 2023 to 2033

6. Global Market Analysis 2018 to 2022 and Forecast 2023 to 2033, By Modes

    6.1. Introduction / Key Findings

    6.2. Historical Market Size Value (US$ Million) Analysis By Modes, 2018 to 2022

    6.3. Current and Future Market Size Value (US$ Million) Analysis and Forecast By Modes, 2023 to 2033

        6.3.1. Roadways

        6.3.2. Railways

        6.3.3. Airways

        6.3.4. Seaways

    6.4. Y-o-Y Growth Trend Analysis By Modes, 2018 to 2022

    6.5. Absolute $ Opportunity Analysis By Modes, 2023 to 2033

7. Global Market Analysis 2018 to 2022 and Forecast 2023 to 2033, By Region

    7.1. Introduction

    7.2. Historical Market Size Value (US$ Million) Analysis By Region, 2018 to 2022

    7.3. Current Market Size Value (US$ Million) Analysis and Forecast By Region, 2023 to 2033

        7.3.1. North America

        7.3.2. Latin America

        7.3.3. Europe

        7.3.4. Asia Pacific

        7.3.5. MEA

    7.4. Market Attractiveness Analysis By Region

8. North America Market Analysis 2018 to 2022 and Forecast 2023 to 2033, By Country

    8.1. Historical Market Size Value (US$ Million) Trend Analysis By Market Taxonomy, 2018 to 2022

    8.2. Market Size Value (US$ Million) Forecast By Market Taxonomy, 2023 to 2033

        8.2.1. By Country

            8.2.1.1. The USA

            8.2.1.2. Canada

        8.2.2. By System

        8.2.3. By Modes

    8.3. Market Attractiveness Analysis

        8.3.1. By Country

        8.3.2. By System

        8.3.3. By Modes

    8.4. Key Takeaways

9. Latin America Market Analysis 2018 to 2022 and Forecast 2023 to 2033, By Country

    9.1. Historical Market Size Value (US$ Million) Trend Analysis By Market Taxonomy, 2018 to 2022

    9.2. Market Size Value (US$ Million) Forecast By Market Taxonomy, 2023 to 2033

        9.2.1. By Country

            9.2.1.1. Brazil

            9.2.1.2. Mexico

            9.2.1.3. Rest of Latin America

        9.2.2. By System

        9.2.3. By Modes

    9.3. Market Attractiveness Analysis

        9.3.1. By Country

        9.3.2. By System

        9.3.3. By Modes

    9.4. Key Takeaways

10. Europe Market Analysis 2018 to 2022 and Forecast 2023 to 2033, By Country

    10.1. Historical Market Size Value (US$ Million) Trend Analysis By Market Taxonomy, 2018 to 2022

    10.2. Market Size Value (US$ Million) Forecast By Market Taxonomy, 2023 to 2033

        10.2.1. By Country

            10.2.1.1. Germany

            10.2.1.2. United Kingdom

            10.2.1.3. France

            10.2.1.4. Spain

            10.2.1.5. Italy

            10.2.1.6. Rest of Europe

        10.2.2. By System

        10.2.3. By Modes

    10.3. Market Attractiveness Analysis

        10.3.1. By Country

        10.3.2. By System

        10.3.3. By Modes

    10.4. Key Takeaways

11. Asia Pacific Market Analysis 2018 to 2022 and Forecast 2023 to 2033, By Country

    11.1. Historical Market Size Value (US$ Million) Trend Analysis By Market Taxonomy, 2018 to 2022

    11.2. Market Size Value (US$ Million) Forecast By Market Taxonomy, 2023 to 2033

        11.2.1. By Country

            11.2.1.1. China

            11.2.1.2. Japan

            11.2.1.3. South Korea

            11.2.1.4. Singapore

            11.2.1.5. Thailand

            11.2.1.6. Indonesia

            11.2.1.7. Australia

            11.2.1.8. New Zealand

            11.2.1.9. Rest of Asia Pacific

        11.2.2. By System

        11.2.3. By Modes

    11.3. Market Attractiveness Analysis

        11.3.1. By Country

        11.3.2. By System

        11.3.3. By Modes

    11.4. Key Takeaways

12. MEA Market Analysis 2018 to 2022 and Forecast 2023 to 2033, By Country

    12.1. Historical Market Size Value (US$ Million) Trend Analysis By Market Taxonomy, 2018 to 2022

    12.2. Market Size Value (US$ Million) Forecast By Market Taxonomy, 2023 to 2033

        12.2.1. By Country

            12.2.1.1. GCC Countries

            12.2.1.2. South Africa

            12.2.1.3. Israel

            12.2.1.4. Rest of MEA

        12.2.2. By System

        12.2.3. By Modes

    12.3. Market Attractiveness Analysis

        12.3.1. By Country

        12.3.2. By System

        12.3.3. By Modes

    12.4. Key Takeaways

13. Key Countries Market Analysis

    13.1. USA

        13.1.1. Pricing Analysis

        13.1.2. Market Share Analysis, 2022

            13.1.2.1. By System

            13.1.2.2. By Modes

    13.2. Canada

        13.2.1. Pricing Analysis

        13.2.2. Market Share Analysis, 2022

            13.2.2.1. By System

            13.2.2.2. By Modes

    13.3. Brazil

        13.3.1. Pricing Analysis

        13.3.2. Market Share Analysis, 2022

            13.3.2.1. By System

            13.3.2.2. By Modes

    13.4. Mexico

        13.4.1. Pricing Analysis

        13.4.2. Market Share Analysis, 2022

            13.4.2.1. By System

            13.4.2.2. By Modes

    13.5. Germany

        13.5.1. Pricing Analysis

        13.5.2. Market Share Analysis, 2022

            13.5.2.1. By System

            13.5.2.2. By Modes

    13.6. United Kingdom

        13.6.1. Pricing Analysis

        13.6.2. Market Share Analysis, 2022

            13.6.2.1. By System

            13.6.2.2. By Modes

    13.7. France

        13.7.1. Pricing Analysis

        13.7.2. Market Share Analysis, 2022

            13.7.2.1. By System

            13.7.2.2. By Modes

    13.8. Spain

        13.8.1. Pricing Analysis

        13.8.2. Market Share Analysis, 2022

            13.8.2.1. By System

            13.8.2.2. By Modes

    13.9. Italy

        13.9.1. Pricing Analysis

        13.9.2. Market Share Analysis, 2022

            13.9.2.1. By System

            13.9.2.2. By Modes

    13.10. China

        13.10.1. Pricing Analysis

        13.10.2. Market Share Analysis, 2022

            13.10.2.1. By System

            13.10.2.2. By Modes

    13.11. Japan

        13.11.1. Pricing Analysis

        13.11.2. Market Share Analysis, 2022

            13.11.2.1. By System

            13.11.2.2. By Modes

    13.12. South Korea

        13.12.1. Pricing Analysis

        13.12.2. Market Share Analysis, 2022

            13.12.2.1. By System

            13.12.2.2. By Modes

    13.13. Singapore

        13.13.1. Pricing Analysis

        13.13.2. Market Share Analysis, 2022

            13.13.2.1. By System

            13.13.2.2. By Modes

    13.14. Thailand

        13.14.1. Pricing Analysis

        13.14.2. Market Share Analysis, 2022

            13.14.2.1. By System

            13.14.2.2. By Modes

    13.15. Indonesia

        13.15.1. Pricing Analysis

        13.15.2. Market Share Analysis, 2022

            13.15.2.1. By System

            13.15.2.2. By Modes

    13.16. Australia

        13.16.1. Pricing Analysis

        13.16.2. Market Share Analysis, 2022

            13.16.2.1. By System

            13.16.2.2. By Modes

    13.17. New Zealand

        13.17.1. Pricing Analysis

        13.17.2. Market Share Analysis, 2022

            13.17.2.1. By System

            13.17.2.2. By Modes

    13.18. GCC Countries

        13.18.1. Pricing Analysis

        13.18.2. Market Share Analysis, 2022

            13.18.2.1. By System

            13.18.2.2. By Modes

    13.19. South Africa

        13.19.1. Pricing Analysis

        13.19.2. Market Share Analysis, 2022

            13.19.2.1. By System

            13.19.2.2. By Modes

    13.20. Israel

        13.20.1. Pricing Analysis

        13.20.2. Market Share Analysis, 2022

            13.20.2.1. By System

            13.20.2.2. By Modes

14. Market Structure Analysis

    14.1. Competition Dashboard

    14.2. Competition Benchmarking

    14.3. Market Share Analysis of Top Players

        14.3.1. By Regional

        14.3.2. By System

        14.3.3. By Modes

15. Competition Analysis

    15.1. Competition Deep Dive

        15.1.1. Safran Group

            15.1.1.1. Overview

            15.1.1.2. Product Portfolio

            15.1.1.3. Profitability by Market Segments

            15.1.1.4. Sales Footprint

            15.1.1.5. Strategy Overview

                15.1.1.5.1. Marketing Strategy

        15.1.2. Rapiscan Systems

            15.1.2.1. Overview

            15.1.2.2. Product Portfolio

            15.1.2.3. Profitability by Market Segments

            15.1.2.4. Sales Footprint

            15.1.2.5. Strategy Overview

                15.1.2.5.1. Marketing Strategy

        15.1.3. SAAB

            15.1.3.1. Overview

            15.1.3.2. Product Portfolio

            15.1.3.3. Profitability by Market Segments

            15.1.3.4. Sales Footprint

            15.1.3.5. Strategy Overview

                15.1.3.5.1. Marketing Strategy

        15.1.4. ABB

            15.1.4.1. Overview

            15.1.4.2. Product Portfolio

            15.1.4.3. Profitability by Market Segments

            15.1.4.4. Sales Footprint

            15.1.4.5. Strategy Overview

                15.1.4.5.1. Marketing Strategy

        15.1.5. Smiths Group

            15.1.5.1. Overview

            15.1.5.2. Product Portfolio

            15.1.5.3. Profitability by Market Segments

            15.1.5.4. Sales Footprint

            15.1.5.5. Strategy Overview

                15.1.5.5.1. Marketing Strategy

        15.1.6. ORBCOMM Inc.

            15.1.6.1. Overview

            15.1.6.2. Product Portfolio

            15.1.6.3. Profitability by Market Segments

            15.1.6.4. Sales Footprint

            15.1.6.5. Strategy Overview

                15.1.6.5.1. Marketing Strategy

        15.1.7. Lockheed Martin

            15.1.7.1. Overview

            15.1.7.2. Product Portfolio

            15.1.7.3. Profitability by Market Segments

            15.1.7.4. Sales Footprint

            15.1.7.5. Strategy Overview

                15.1.7.5.1. Marketing Strategy

        15.1.8. L-3 Communications

            15.1.8.1. Overview

            15.1.8.2. Product Portfolio

            15.1.8.3. Profitability by Market Segments

            15.1.8.4. Sales Footprint

            15.1.8.5. Strategy Overview

                15.1.8.5.1. Marketing Strategy

        15.1.9. Kapsch Group

            15.1.9.1. Overview

            15.1.9.2. Product Portfolio

            15.1.9.3. Profitability by Market Segments

            15.1.9.4. Sales Footprint

            15.1.9.5. Strategy Overview

                15.1.9.5.1. Marketing Strategy

        15.1.10. Honeywell International

            15.1.10.1. Overview

            15.1.10.2. Product Portfolio

            15.1.10.3. Profitability by Market Segments

            15.1.10.4. Sales Footprint

            15.1.10.5. Strategy Overview

                15.1.10.5.1. Marketing Strategy

        15.1.11. Alstom S.A. (France)

            15.1.11.1. Overview

            15.1.11.2. Product Portfolio

            15.1.11.3. Profitability by Market Segments

            15.1.11.4. Sales Footprint

            15.1.11.5. Strategy Overview

                15.1.11.5.1. Marketing Strategy

        15.1.12. Raytheon Company

            15.1.12.1. Overview

            15.1.12.2. Product Portfolio

            15.1.12.3. Profitability by Market Segments

            15.1.12.4. Sales Footprint

            15.1.12.5. Strategy Overview

                15.1.12.5.1. Marketing Strategy

        15.1.13. Cisco Systems Inc.

            15.1.13.1. Overview

            15.1.13.2. Product Portfolio

            15.1.13.3. Profitability by Market Segments

            15.1.13.4. Sales Footprint

            15.1.13.5. Strategy Overview

                15.1.13.5.1. Marketing Strategy

        15.1.14. ASSA Abloy

            15.1.14.1. Overview

            15.1.14.2. Product Portfolio

            15.1.14.3. Profitability by Market Segments

            15.1.14.4. Sales Footprint

            15.1.14.5. Strategy Overview

                15.1.14.5.1. Marketing Strategy

        15.1.15. FLIR Systems

            15.1.15.1. Overview

            15.1.15.2. Product Portfolio

            15.1.15.3. Profitability by Market Segments

            15.1.15.4. Sales Footprint

            15.1.15.5. Strategy Overview

                15.1.15.5.1. Marketing Strategy

        15.1.16. Bosch Security Systems

            15.1.16.1. Overview

            15.1.16.2. Product Portfolio

            15.1.16.3. Profitability by Market Segments

            15.1.16.4. Sales Footprint

            15.1.16.5. Strategy Overview

                15.1.16.5.1. Marketing Strategy

        15.1.17. ADT Corporation

            15.1.17.1. Overview

            15.1.17.2. Product Portfolio

            15.1.17.3. Profitability by Market Segments

            15.1.17.4. Sales Footprint

            15.1.17.5. Strategy Overview

                15.1.17.5.1. Marketing Strategy

        15.1.18. Broadcom Limited

            15.1.18.1. Overview

            15.1.18.2. Product Portfolio

            15.1.18.3. Profitability by Market Segments

            15.1.18.4. Sales Footprint

            15.1.18.5. Strategy Overview

                15.1.18.5.1. Marketing Strategy

        15.1.19. Fortinet

            15.1.19.1. Overview

            15.1.19.2. Product Portfolio

            15.1.19.3. Profitability by Market Segments

            15.1.19.4. Sales Footprint

            15.1.19.5. Strategy Overview

                15.1.19.5.1. Marketing Strategy

16. Assumptions & Acronyms Used

17. Research Methodology

List of Tables

Table 1: Global Market Value (US$ Million) Forecast by Region, 2018 to 2033

Table 2: Global Market Value (US$ Million) Forecast by System, 2018 to 2033

Table 3: Global Market Value (US$ Million) Forecast by Modes, 2018 to 2033

Table 4: North America Market Value (US$ Million) Forecast by Country, 2018 to 2033

Table 5: North America Market Value (US$ Million) Forecast by System, 2018 to 2033

Table 6: North America Market Value (US$ Million) Forecast by Modes, 2018 to 2033

Table 7: Latin America Market Value (US$ Million) Forecast by Country, 2018 to 2033

Table 8: Latin America Market Value (US$ Million) Forecast by System, 2018 to 2033

Table 9: Latin America Market Value (US$ Million) Forecast by Modes, 2018 to 2033

Table 10: Europe Market Value (US$ Million) Forecast by Country, 2018 to 2033

Table 11: Europe Market Value (US$ Million) Forecast by System, 2018 to 2033

Table 12: Europe Market Value (US$ Million) Forecast by Modes, 2018 to 2033

Table 13: Asia Pacific Market Value (US$ Million) Forecast by Country, 2018 to 2033

Table 14: Asia Pacific Market Value (US$ Million) Forecast by System, 2018 to 2033

Table 15: Asia Pacific Market Value (US$ Million) Forecast by Modes, 2018 to 2033

Table 16: MEA Market Value (US$ Million) Forecast by Country, 2018 to 2033

Table 17: MEA Market Value (US$ Million) Forecast by System, 2018 to 2033

Table 18: MEA Market Value (US$ Million) Forecast by Modes, 2018 to 2033

List of Charts

Figure 1: Global Market Value (US$ Million) by System, 2023 to 2033

Figure 2: Global Market Value (US$ Million) by Modes, 2023 to 2033

Figure 3: Global Market Value (US$ Million) by Region, 2023 to 2033

Figure 4: Global Market Value (US$ Million) Analysis by Region, 2018 to 2033

Figure 5: Global Market Value Share (%) and BPS Analysis by Region, 2023 to 2033

Figure 6: Global Market Y-o-Y Growth (%) Projections by Region, 2023 to 2033

Figure 7: Global Market Value (US$ Million) Analysis by System, 2018 to 2033

Figure 8: Global Market Value Share (%) and BPS Analysis by System, 2023 to 2033

Figure 9: Global Market Y-o-Y Growth (%) Projections by System, 2023 to 2033

Figure 10: Global Market Value (US$ Million) Analysis by Modes, 2018 to 2033

Figure 11: Global Market Value Share (%) and BPS Analysis by Modes, 2023 to 2033

Figure 12: Global Market Y-o-Y Growth (%) Projections by Modes, 2023 to 2033

Figure 13: Global Market Attractiveness by System, 2023 to 2033

Figure 14: Global Market Attractiveness by Modes, 2023 to 2033

Figure 15: Global Market Attractiveness by Region, 2023 to 2033

Figure 16: North America Market Value (US$ Million) by System, 2023 to 2033

Figure 17: North America Market Value (US$ Million) by Modes, 2023 to 2033

Figure 18: North America Market Value (US$ Million) by Country, 2023 to 2033

Figure 19: North America Market Value (US$ Million) Analysis by Country, 2018 to 2033

Figure 20: North America Market Value Share (%) and BPS Analysis by Country, 2023 to 2033

Figure 21: North America Market Y-o-Y Growth (%) Projections by Country, 2023 to 2033

Figure 22: North America Market Value (US$ Million) Analysis by System, 2018 to 2033

Figure 23: North America Market Value Share (%) and BPS Analysis by System, 2023 to 2033

Figure 24: North America Market Y-o-Y Growth (%) Projections by System, 2023 to 2033

Figure 25: North America Market Value (US$ Million) Analysis by Modes, 2018 to 2033

Figure 26: North America Market Value Share (%) and BPS Analysis by Modes, 2023 to 2033

Figure 27: North America Market Y-o-Y Growth (%) Projections by Modes, 2023 to 2033

Figure 28: North America Market Attractiveness by System, 2023 to 2033

Figure 29: North America Market Attractiveness by Modes, 2023 to 2033

Figure 30: North America Market Attractiveness by Country, 2023 to 2033

Figure 31: Latin America Market Value (US$ Million) by System, 2023 to 2033

Figure 32: Latin America Market Value (US$ Million) by Modes, 2023 to 2033

Figure 33: Latin America Market Value (US$ Million) by Country, 2023 to 2033

Figure 34: Latin America Market Value (US$ Million) Analysis by Country, 2018 to 2033

Figure 35: Latin America Market Value Share (%) and BPS Analysis by Country, 2023 to 2033

Figure 36: Latin America Market Y-o-Y Growth (%) Projections by Country, 2023 to 2033

Figure 37: Latin America Market Value (US$ Million) Analysis by System, 2018 to 2033

Figure 38: Latin America Market Value Share (%) and BPS Analysis by System, 2023 to 2033

Figure 39: Latin America Market Y-o-Y Growth (%) Projections by System, 2023 to 2033

Figure 40: Latin America Market Value (US$ Million) Analysis by Modes, 2018 to 2033

Figure 41: Latin America Market Value Share (%) and BPS Analysis by Modes, 2023 to 2033

Figure 42: Latin America Market Y-o-Y Growth (%) Projections by Modes, 2023 to 2033

Figure 43: Latin America Market Attractiveness by System, 2023 to 2033

Figure 44: Latin America Market Attractiveness by Modes, 2023 to 2033

Figure 45: Latin America Market Attractiveness by Country, 2023 to 2033

Figure 46: Europe Market Value (US$ Million) by System, 2023 to 2033

Figure 47: Europe Market Value (US$ Million) by Modes, 2023 to 2033

Figure 48: Europe Market Value (US$ Million) by Country, 2023 to 2033

Figure 49: Europe Market Value (US$ Million) Analysis by Country, 2018 to 2033

Figure 50: Europe Market Value Share (%) and BPS Analysis by Country, 2023 to 2033

Figure 51: Europe Market Y-o-Y Growth (%) Projections by Country, 2023 to 2033

Figure 52: Europe Market Value (US$ Million) Analysis by System, 2018 to 2033

Figure 53: Europe Market Value Share (%) and BPS Analysis by System, 2023 to 2033

Figure 54: Europe Market Y-o-Y Growth (%) Projections by System, 2023 to 2033

Figure 55: Europe Market Value (US$ Million) Analysis by Modes, 2018 to 2033

Figure 56: Europe Market Value Share (%) and BPS Analysis by Modes, 2023 to 2033

Figure 57: Europe Market Y-o-Y Growth (%) Projections by Modes, 2023 to 2033

Figure 58: Europe Market Attractiveness by System, 2023 to 2033

Figure 59: Europe Market Attractiveness by Modes, 2023 to 2033

Figure 60: Europe Market Attractiveness by Country, 2023 to 2033

Figure 61: Asia Pacific Market Value (US$ Million) by System, 2023 to 2033

Figure 62: Asia Pacific Market Value (US$ Million) by Modes, 2023 to 2033

Figure 63: Asia Pacific Market Value (US$ Million) by Country, 2023 to 2033

Figure 64: Asia Pacific Market Value (US$ Million) Analysis by Country, 2018 to 2033

Figure 65: Asia Pacific Market Value Share (%) and BPS Analysis by Country, 2023 to 2033

Figure 66: Asia Pacific Market Y-o-Y Growth (%) Projections by Country, 2023 to 2033

Figure 67: Asia Pacific Market Value (US$ Million) Analysis by System, 2018 to 2033

Figure 68: Asia Pacific Market Value Share (%) and BPS Analysis by System, 2023 to 2033

Figure 69: Asia Pacific Market Y-o-Y Growth (%) Projections by System, 2023 to 2033

Figure 70: Asia Pacific Market Value (US$ Million) Analysis by Modes, 2018 to 2033

Figure 71: Asia Pacific Market Value Share (%) and BPS Analysis by Modes, 2023 to 2033

Figure 72: Asia Pacific Market Y-o-Y Growth (%) Projections by Modes, 2023 to 2033

Figure 73: Asia Pacific Market Attractiveness by System, 2023 to 2033

Figure 74: Asia Pacific Market Attractiveness by Modes, 2023 to 2033

Figure 75: Asia Pacific Market Attractiveness by Country, 2023 to 2033

Figure 76: MEA Market Value (US$ Million) by System, 2023 to 2033

Figure 77: MEA Market Value (US$ Million) by Modes, 2023 to 2033

Figure 78: MEA Market Value (US$ Million) by Country, 2023 to 2033

Figure 79: MEA Market Value (US$ Million) Analysis by Country, 2018 to 2033

Figure 80: MEA Market Value Share (%) and BPS Analysis by Country, 2023 to 2033

Figure 81: MEA Market Y-o-Y Growth (%) Projections by Country, 2023 to 2033

Figure 82: MEA Market Value (US$ Million) Analysis by System, 2018 to 2033

Figure 83: MEA Market Value Share (%) and BPS Analysis by System, 2023 to 2033

Figure 84: MEA Market Y-o-Y Growth (%) Projections by System, 2023 to 2033

Figure 85: MEA Market Value (US$ Million) Analysis by Modes, 2018 to 2033

Figure 86: MEA Market Value Share (%) and BPS Analysis by Modes, 2023 to 2033

Figure 87: MEA Market Y-o-Y Growth (%) Projections by Modes, 2023 to 2033

Figure 88: MEA Market Attractiveness by System, 2023 to 2033

Figure 89: MEA Market Attractiveness by Modes, 2023 to 2033

Figure 90: MEA Market Attractiveness by Country, 2023 to 2033

Recommendations

Automotive

Car Security System Market

Published : June 2023

Automotive

APAC Automotive Telematics Market

Published : June 2023

Automotive

Automotive Sensors Market

Published : June 2023

Explore Automotive Insights

View Reports

Transportation and Security System Market