Transportation Analytics Market Size, Share & Forecast 2025 to 2035

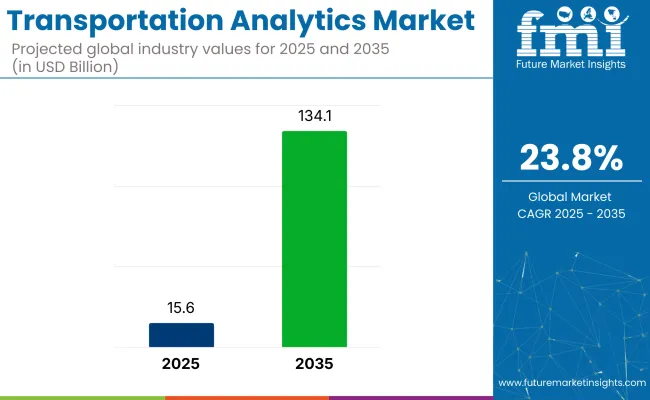
The transportation analytics market is expected to reach USD 15.6 billion in 2025 and grow to USD 134.1 billion by 2035, expanding at a CAGR of 23.8%. Growth is being shaped by rising use of predictive traffic models, logistics network simulations, and multi-modal data platforms across freight corridors and metro systems.
Quick Stats of the Transportation Analytics Market

  • Industry Size (2025): USD 15.6 billion
  • Industry Size (2035): USD 134.1 billion
  • CAGR (2025 to 2035): 23.8%
  • Leading Segment: Cloud deployment (50%)
  • Key Growth Region: Asia Pacific (India)
  • Key Players: IBM Corporation, Oracle Corporation, Cubic Corporation, INRIX, Inc., and Alteryx, Inc.

Transportation Analytics Market

Advanced route planning and congestion forecasting have been integrated into fleet telematics by logistics providers seeking lower fuel costs and tighter ETAs. Data from sensors, GPS, and connected infrastructure is being processed through AI-driven analytics engines that support smart tolling and dynamic signal control.

Stronger traction has been observed in North America and East Asia, where transport departments are standardizing open-data ecosystems. Vendor competition is intensifying around real-time event detection, capacity modeling, and cost-to-serve analytics.

In an interview with Women in Transport, Deborah Kobewka, CEO of Ito World, emphasized the importance of data analytics in the transit sector, stating, “Ensuring the availability of mission-critical data analytics to the transit sector is really important, and I believe Ito has a crucial role to play in this. Our vision is to transform the future of transport through innovative transit intelligence, helping our customers solve challenges and improve communities.”

The industry holds a specialized but growing share within its parent markets. In the transportation market, its share is approximately 2-3%, as transportation analytics is a niche segment focused on optimizing operations across various modes of transport. Within the big data and analytics market, the share is around 1-2%, as the analytics leverages large datasets but is just one aspect of the broader data analytics field.

In the fleet management market, the share is about 5-7%, as analytics are essential for optimizing fleet operations and logistics. In the supply chain and logistics market, its share is approximately 3-4%, driven by the need to improve supply chain efficiency using transportation data. In the Internet of Things (IoT) market, the analytics contributes around 3-5%, as IoT devices generate valuable real-time data for analysis in transportation systems.

Analyzing Transportation Analytics Market by Top Investment Segments

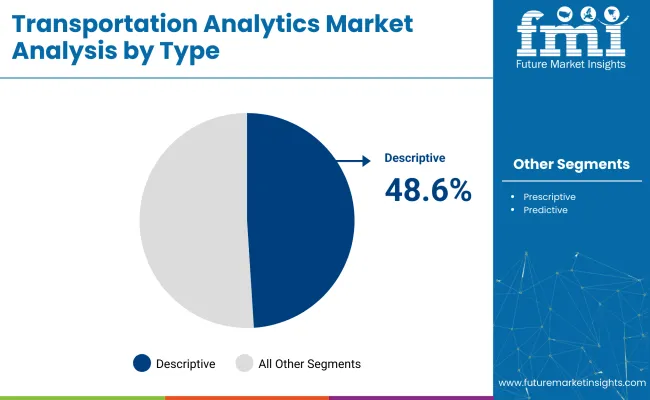
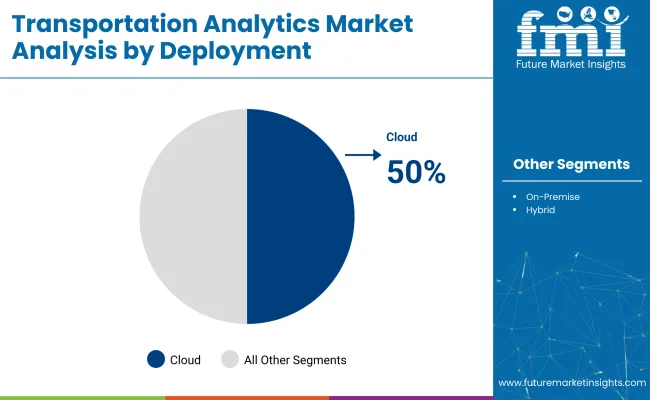
The industry is projected to grow, with descriptive analytics capturing 48.6% of the industry share in 2025. Cloud deployment will hold 50%, while traffic management will dominate the application segment with 43.5% share.
Descriptive analytics to lead with 48.6% industry share in 2025

Transportation Analytics Market Analysis By Type

Descriptive analytics is expected to dominate the industry, capturing 48.6% of the industry share in 2025. This segment focuses on analyzing historical data to uncover patterns and trends that help stakeholders understand past transportation performance.

Descriptive analytics is widely used to generate reports and visualizations that support decision-making processes in areas like route optimization, fleet management, and infrastructure planning. By summarizing past events, this type of analytics provides valuable insights for transportation operators looking to improve efficiency and reduce costs.
  • Focuses on historical data to uncover patterns and trends
  • Generates reports and visualizations to support decision-making in transportation
  • Valuable for route optimization, fleet management, and infrastructure planning

Cloud deployment to capture 50% of the industry share in 2025

Transportation Analytics Market Analysis By Deployment

Cloud deployment is projected to hold 50% of the industry share in 2025, driven by the flexibility, scalability, and cost-efficiency it offers to transportation analytics. Cloud-based platforms enable real-time data processing, easier integration with other systems, and the ability to scale operations according to demand.

With transportation networks becoming increasingly complex, the cloud’s ability to provide centralized data access across various stakeholders-such as traffic management centers, logistics providers, and municipalities-plays a key role in improving operational efficiency. The growing adoption of cloud computing across industries is expected to continue driving the growth of this segment.

  • Centralized data access for various stakeholders across the transportation network
  • Scalable and flexible, supporting demand-driven operations
  • Real-time data processing improves operational efficiency across the industry

Traffic management to lead application segment with 43.5% industry share in 2025

Traffic management is expected to capture 43.5% of the application segment in 2025, as cities and municipalities continue to seek solutions for optimizing traffic flow and reducing congestion. The analytics plays a critical role in managing real-time traffic data, analyzing congestion patterns, and providing actionable insights for better traffic control.

By using traffic management systems powered by data analytics, cities can optimize traffic signal timing, monitor road usage, and predict traffic bottlenecks. The demand for these solutions is rising due to the increasing need to manage transportation systems efficiently.

  • Optimizes traffic flow and reduces congestion in urban areas
  • Analyzes real-time data to improve traffic signal timing and road usage
  • Increasing demand due to the need for efficient transportation systems

Top Transportation Analytics Market Dynamics

The industry is growing due to increasing urban congestion and the rise of smart mobility, with real-time analytics improving traffic flow and efficiency. However, high implementation costs, data integration issues, and regulatory challenges limit scalability, particularly in smaller cities and developing industries.

Smart Mobility Adoption and Urban Congestion Fueling Transportation Analytics Integration

The industry is expanding due to the rising urban congestion and the growth of smart mobility ecosystems. Cities worldwide are adopting intelligent traffic systems, connected vehicle platforms, and AI-powered route optimization to manage traffic and improve commuter experience.

Real-time analytics are being utilized to reduce travel time, improve fuel efficiency, and enable predictive maintenance across public and private transit networks. As smart city initiatives gain traction, transportation agencies are leveraging cloud-based analytics to streamline operations and enhance safety, boosting the sector’s integration across metropolitan transport systems.

  • Smart mobility is driving the demand for transportation analytics.
  • Real-time analytics are improving traffic flow, fuel efficiency, and predictive maintenance.
  • Cloud-based analytics platforms are accelerating smart city integration in transportation networks.

High Implementation Costs and Fragmented Data Systems Restrict Industry Scalability

Despite strong demand, the scalability is restricted by high implementation costs and data integration challenges. Governments and logistics firms face difficulties in modernizing legacy systems, dealing with siloed databases, and the absence of unified standards, which hinder effective deployment of advanced analytics.

High upfront investments in IoT devices, cloud storage, and skilled personnel make implementation expensive, particularly for smaller cities and mid-sized operators. Additionally, ensuring data security and meeting regional privacy regulations adds complexity, slowing adoption, especially in developing sectors with inconsistent infrastructure.
  • High infrastructure costs and data integration issues hinder scalability in transportation analytics.
  • Smaller cities and operators face financial barriers due to high upfront investments in technology.
  • Regulatory and data security challenges further complicate analytics deployment, particularly in developing regions.

Analyzing Top Countries Formulating, Distributing, and Supplying Transportation Analytics

Country Wise Analysis Of Transportation Analytics Market Cagr 2025 To 2035

Countries CAGR (2025 to 2035)
India 23.2%
China 22.5%
United States 21.8%
United Kingdom 10.2%
Brazil 10.2%

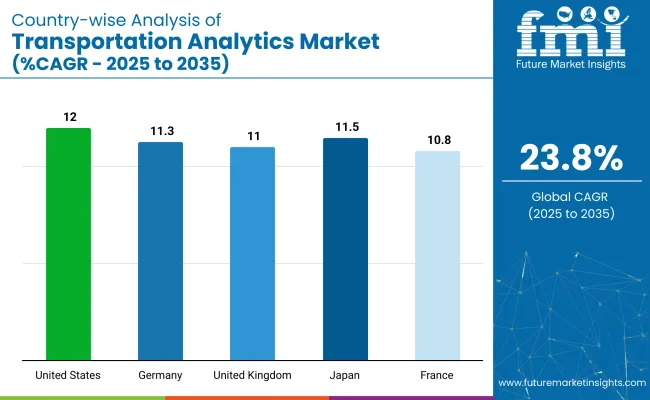
The industry demand is projected to rise at a 23.8% CAGR from 2025 to 2035. Of the five profiled countries out of 40 covered, India leads at 23.2%, followed closely by China at 22.5%, and the United States at 21.8%, while both the United Kingdom and Brazil post 10.2%.

These rates translate to a growth premium of -2% for India, -5% for China, and -8% for the United States versus the baseline, while the United Kingdom and Brazil show slower growth. Divergence reflects local catalysts: rapidly advancing transportation infrastructure and adoption of analytics in India and China, along with steady demand in the United States driven by technological advancements, and more moderate growth in the United Kingdom and Brazil due to existing infrastructure and industry saturation.

Growth Analysis of Transportation Analytics Market in the United States

The industry in the United States is projected to grow at a CAGR of 21.8% through 2035. Nationwide investment in intelligent transportation systems, cloud-integrated mobility platforms, and AI-driven decision tools has reshaped traffic management, freight routing, and multimodal scheduling.

Public-private programs such as the Smart City Challenge have linked municipal data lakes with edge-computing sensors, enabling predictive congestion control and autonomous-vehicle simulations. Major suppliers-including IBM, Oracle, and INRIX-package prescriptive dashboards that support transit-safety metrics and infrastructure-funding benchmarks.

  • State DOTs deploy machine-learning models that adjust traffic-signal timing within 15-second feedback loops.
  • Logistics carriers integrate weather-aware route analytics to lift on-time performance under FMCSA reporting.
  • Mobility-as-a-Service pilots bundle fare payment, trip planning, and carbon-impact scores for commuters.

Future Outlook for Transportation Analytics Market in the United Kingdom

Sales of transportation analytics solutions in the United Kingdom are forecast to rise at a CAGR of 10.2% through 2035. Net-zero transport goals and the Future of Mobility regulatory framework steer agencies toward data-sharing platforms and 5 G-powered vehicle networks.

Transport for London leverages geospatial analytics to balance bus headways, pedestrian flows, and congestion-charging zones. Cloud providers, telecom operators, and start-ups co-create real-time dashboards for last-mile logistics and active-travel corridors.

  • Front-of-pack transport-scorecards help cities publish live emissions savings from optimized routing.
  • 5 G roadside units feed high-resolution telemetry into autonomous-shuttle trials.
  • Rail franchisers use predictive analytics to allocate rolling-stock capacity under peak-demand scenarios.

Demand Forecast for Transportation Analytics Market in China

Demand for transportation analytics platforms in China is projected to expand at a CAGR of 22.5% between 2025 and 2035. “Digital China” and “Smart Transportation” policies underpin large-scale AI deployments across high-speed rail, metro, and express-delivery networks.

Providers such as Alibaba Cloud, Baidu, and Huawei fuse 5G, computer vision, and IoT sensors to forecast traffic density and freight-lane utilization. E-commerce growth and multi-city logistics corridors intensify need for dynamic route optimization.

  • Smart-signal grids in tier-one metros adjust lane priorities based on 30-second vehicle-counts.
  • AI cameras on expressways flag accident risk and auto-dispatch patrol units within two minutes.
  • Logistic-park control towers integrate port, rail, and truck schedules to cut container dwell time.

Growth Outlook of Transportation Analytics Market in India

The industry in India is anticipated to grow at a CAGR of 23.2% through 2035. Smart Cities Mission and Gati Shakti initiatives generate high-resolution mobility datasets, allowing cloud vendors-TCS, Tech Mahindra, MapmyIndia-to deliver fleet-tracking and traffic-simulation suites.

FASTag toll platforms and expanding EV infrastructure create granular transaction feeds for predictive maintenance and tariff planning. Public-transit agencies adopt AI dashboards to forecast ridership and fine-tune timetable adherence.

  • City traffic police leverage video analytics to automate signal enforcement in congestion hot spots.
  • Inter-city bus operators embed fuel-optimization algorithms that lower per-trip diesel use.
  • E-commerce hubs deploy digital twins to balance first-mile pickup and last-mile drop density.

Transportation Analytics Market Growth Outlook in Brazil

The industry in Brazil is expected to increase at a CAGR of 10.2% from 2025 to 2035. Urban-congestion and safety imperatives prompt municipalities in São Paulo and Rio to adopt AI-based traffic-control suites and emergency-response predictors.

Toll-operator Sem Parar digitizes user data streams for dynamic-pricing pilots, while fleet-management firms optimize fuel burn and driver shifts. Regional transit agencies integrate scheduling analytics to raise bus reliability under federal mobility-funding targets.

  • Smart-camera networks feed crash-risk heat maps into city traffic-operation centers.
  • Digital tolling analytics support variable pricing tied to peak-hour lane occupancy.
  • Data partnerships with multilateral banks fund open-API transit dashboards for citizen apps.

Leading Transportation Analytics Suppliers

Leading Company - IBM Corporation Industry Share - 15%
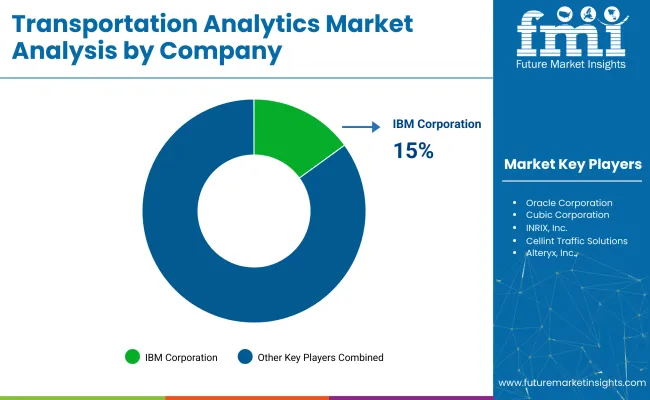
Transportation Analytics Market Analysis By Company

The global industry features a competitive landscape with dominant players, key players, and emerging players. Dominant players such as IBM Corporation, Oracle Corporation, and Cubic Corporation lead the industry with extensive product portfolios, strong R&D capabilities, and robust distribution networks across urban mobility, logistics, and infrastructure sectors.

Key players including Sisense Ltd., INRIX, Inc., and Cellint Traffic Solutions offer specialized solutions tailored to specific applications and regional industries. Emerging players, such as Alteryx, Inc., Hitachi, Ltd., and SmartDrive Systems, Inc., focus on innovative technologies and cost-effective solutions, expanding their presence in the global industry.

Recent Transportation Analytics Industry News

  • In November 2024, Transoft Solutions acquired the Advanced Mobility Analytics Group, significantly boosting its road safety AI capabilities. This acquisition strengthens Transoft’s position in the autonomous vehicle and smart infrastructure sectors, advancing innovation in road safety solutions.
  • At CES 2025, May Mobility introduced the Technobus, an autonomous electric vehicle (EV) bus, and partnered with Deloitte for a data analytics alliance. This collaboration emphasizes the growing intersection of autonomous vehicles and data analytics in the development of smart city ecosystems.

Report Scope - Transportation Analytics Market

Report Attributes Details
Industry Size (2025) USD 15.61 billion
Projected Industry Size (2035) USD 134.14 billion
CAGR (2025 to 2035) 23.8%
Base Year for Estimation 2024
Historical Period 2020 to 2024
Projections Period 2025 to 2035
Quantitative Units USD billion for value
Type Outlook (Segment 1) Descriptive, Predictive, Prescriptive
Deployment Outlook (Segment 2) On-premise, Cloud, Hybrid
Application Outlook (Segment 3) Traffic Management, Logistics Management, Planning & Maintenance, Others
Regions Covered North America, Europe, Asia Pacific, Latin America, Middle East & Africa
Countries Covered United States, Canada, Mexico, Germany, United Kingdom, France, China, Japan, India, South Korea, Australia, Brazil, Saudi Arabia, United Arab Emirates, South Africa
Key Players Influencing the Industry IBM Corporation, Oracle Corporation, Cubic Corporation, INRIX, Inc., Cellint Traffic Solutions, Alteryx, Inc., Hitachi, Ltd., SmartDrive Systems, Inc., Omnitracs, Sisense Ltd.
Additional Attributes Dollar sales by analytics type and deployment model, Growth in predictive and prescriptive use cases, Role of AI and big data in traffic and logistics insights, Regional infrastructure adoption trends, Government investment in smart mobility, Integration of analytics in connected and autonomous transport systems

Key Players in Transportation Analytics Market

  • IBM Corporation
  • Oracle Corporation
  • Cubic Corporation
  • INRIX, Inc.
  • Cellint Traffic Solutions
  • Alteryx, Inc.
  • Hitachi, Ltd.
  • SmartDrive Systems, Inc.
  • Omnitracs
  • Sisense Ltd.

Transportation Analytics Market Analyzed by Key Investment Segments

By Type:

Segmentation by type includes descriptive, predictive, and prescriptive analytics.

By Deployment:

Deployment models comprise on-premise, cloud, and hybrid configurations.

By Application:

Applications span traffic management, logistics management, planning & maintenance, and other use cases.

By Region:

Regional coverage includes North America, Europe, Asia Pacific, Latin America, and the Middle East & Africa.

Table of Content

  1. Executive Summary
    • Global Market Outlook
    • Demand-side Trends
    • Supply-side Trends
    • Technology Roadmap Analysis
    • Analysis and Recommendations
  2. Market Overview
    • Market Coverage / Taxonomy
    • Market Definition / Scope / Limitations
  3. Market Background
    • Market Dynamics
      • Drivers
      • Restraints
      • Opportunity
      • Trends
    • Scenario Forecast
      • Demand in Optimistic Scenario
      • Demand in Likely Scenario
      • Demand in Conservative Scenario
    • Opportunity Map Analysis
    • Product Life Cycle Analysis
    • Supply Chain Analysis
      • Supply Side Participants and their Roles
        • Producers
        • Mid-Level Participants (Traders/ Agents/ Brokers)
        • Wholesalers and Distributors
      • Value Added and Value Created at Node in the Supply Chain
      • List of Raw Material Suppliers
      • List of Existing and Potential Buyer’s
    • Investment Feasibility Matrix
    • Value Chain Analysis
      • Profit Margin Analysis
      • Wholesalers and Distributors
      • Retailers
    • PESTLE and Porter’s Analysis
    • Regulatory Landscape
      • By Key Regions
      • By Key Countries
    • Regional Parent Market Outlook
    • Production and Consumption Statistics
    • Import and Export Statistics
  4. Global Market Analysis 2020 to 2024 and Forecast, 2025 to 2035
    • Historical Market Size Value (USD Billion) Analysis, 2020 to 2024
    • Current and Future Market Size Value (USD Billion) Projections, 2025 to 2035
      • Y-o-Y Growth Trend Analysis
      • Absolute $ Opportunity Analysis
  5. Global Market Pricing Analysis 2020 to 2024 and Forecast 2025 to 2035
  6. Global Market Analysis 2020 to 2024 and Forecast 2025 to 2035, By Type
    • Introduction / Key Findings
    • Historical Market Size Value (USD Billion) Analysis By Type, 2020 to 2024
    • Current and Future Market Size Value (USD Billion) Analysis and Forecast By Type, 2025 to 2035
      • Descriptive
      • Predictive
      • Prescriptive
    • Y-o-Y Growth Trend Analysis By Type, 2020 to 2024
    • Absolute $ Opportunity Analysis By Type, 2025 to 2035
  7. Global Market Analysis 2020 to 2024 and Forecast 2025 to 2035, By Deployment
    • Introduction / Key Findings
    • Historical Market Size Value (USD Billion) Analysis By Deployment, 2020 to 2024
    • Current and Future Market Size Value (USD Billion) Analysis and Forecast By Deployment, 2025 to 2035
      • On-premise
      • Cloud
      • Hybrid
    • Y-o-Y Growth Trend Analysis By Deployment, 2020 to 2024
    • Absolute $ Opportunity Analysis By Deployment, 2025 to 2035
  8. Global Market Analysis 2020 to 2024 and Forecast 2025 to 2035, By Application
    • Introduction / Key Findings
    • Historical Market Size Value (USD Billion) Analysis By Application, 2020 to 2024
    • Current and Future Market Size Value (USD Billion) Analysis and Forecast By Application, 2025 to 2035
      • Traffic Management
      • Logistics Management
      • Planning & Maintenance
      • Others
    • Y-o-Y Growth Trend Analysis By Application, 2020 to 2024
    • Absolute $ Opportunity Analysis By Application, 2025 to 2035
  9. Global Market Analysis 2020 to 2024 and Forecast 2025 to 2035, By Region
    • Introduction
    • Historical Market Size Value (USD Billion) Analysis By Region, 2020 to 2024
    • Current Market Size Value (USD Billion) Analysis and Forecast By Region, 2025 to 2035
      • North America
      • Latin America
      • Western Europe
      • Eastern Europe
      • East Asia
      • South Asia & Pacific
      • Middle East and Africa
    • Market Attractiveness Analysis By Region
  10. North America Market Analysis 2020 to 2024 and Forecast 2025 to 2035, By Country
    • Historical Market Size Value (USD Billion) Trend Analysis By Market Taxonomy, 2020 to 2024
    • Market Size Value (USD Billion) Forecast By Market Taxonomy, 2025 to 2035
      • By Country
        • USA
        • Canada
        • Mexico
      • By Type
      • By Deployment
      • By Application
    • Market Attractiveness Analysis
      • By Country
      • By Type
      • By Deployment
      • By Application
    • Key Takeaways
  11. Latin America Market Analysis 2020 to 2024 and Forecast 2025 to 2035, By Country
    • Historical Market Size Value (USD Billion) Trend Analysis By Market Taxonomy, 2020 to 2024
    • Market Size Value (USD Billion) Forecast By Market Taxonomy, 2025 to 2035
      • By Country
        • Brazil
        • Argentina
        • Rest of LATAM
      • By Type
      • By Deployment
      • By Application
    • Market Attractiveness Analysis
      • By Country
      • By Type
      • By Deployment
      • By Application
    • Key Takeaways
  12. Western Europe Market Analysis 2020 to 2024 and Forecast 2025 to 2035, By Country
    • Historical Market Size Value (USD Billion) Trend Analysis By Market Taxonomy, 2020 to 2024
    • Market Size Value (USD Billion) Forecast By Market Taxonomy, 2025 to 2035
      • By Country
        • Germany
        • Italy
        • France
        • UK
        • Spain
        • BENELUX
        • Nordic
        • Rest of W.Europe
      • By Type
      • By Deployment
      • By Application
    • Market Attractiveness Analysis
      • By Country
      • By Type
      • By Deployment
      • By Application
    • Key Takeaways
  13. Eastern Europe Market Analysis 2020 to 2024 and Forecast 2025 to 2035, By Country
    • Historical Market Size Value (USD Billion) Trend Analysis By Market Taxonomy, 2020 to 2024
    • Market Size Value (USD Billion) Forecast By Market Taxonomy, 2025 to 2035
      • By Country
        • Russia
        • Hungary
        • Poland
        • Balkan & Baltics
        • Rest of E. Europe
      • By Type
      • By Deployment
      • By Application
    • Market Attractiveness Analysis
      • By Country
      • By Type
      • By Deployment
      • By Application
    • Key Takeaways
  14. East Asia Market Analysis 2020 to 2024 and Forecast 2025 to 2035, By Country
    • Historical Market Size Value (USD Billion) Trend Analysis By Market Taxonomy, 2020 to 2024
    • Market Size Value (USD Billion) Forecast By Market Taxonomy, 2025 to 2035
      • By Country
        • China
        • Japan
        • South Korea
      • By Type
      • By Deployment
      • By Application
    • Market Attractiveness Analysis
      • By Country
      • By Type
      • By Deployment
      • By Application
    • Key Takeaways
  15. South Asia & Pacific Market Analysis 2020 to 2024 and Forecast 2025 to 2035, By Country
    • Historical Market Size Value (USD Billion) Trend Analysis By Market Taxonomy, 2020 to 2024
    • Market Size Value (USD Billion) Forecast By Market Taxonomy, 2025 to 2035
      • By Country
        • India
        • Australia & New Zealand
        • ASEAN
        • Rest of SAP
      • By Type
      • By Deployment
      • By Application
    • Market Attractiveness Analysis
      • By Country
      • By Type
      • By Deployment
      • By Application
    • Key Takeaways
  16. Middle East and Africa Market Analysis 2020 to 2024 and Forecast 2025 to 2035, By Country
    • Historical Market Size Value (USD Billion) Trend Analysis By Market Taxonomy, 2020 to 2024
    • Market Size Value (USD Billion) Forecast By Market Taxonomy, 2025 to 2035
      • By Country
        • GCC Countries
        • Northern Africa
        • South Africa
        • Turkiye
        • Rest of MEA
      • By Type
      • By Deployment
      • By Application
    • Market Attractiveness Analysis
      • By Country
      • By Type
      • By Deployment
      • By Application
    • Key Takeaways
  17. Key Countries Market Analysis
    • USA
      • Pricing Analysis
      • Market Share Analysis, 2024
        • By Type
        • By Deployment
        • By Application
    • Canada
      • Pricing Analysis
      • Market Share Analysis, 2024
        • By Type
        • By Deployment
        • By Application
    • Brazil
      • Pricing Analysis
      • Market Share Analysis, 2024
        • By Type
        • By Deployment
        • By Application
    • Mexico
      • Pricing Analysis
      • Market Share Analysis, 2024
        • By Type
        • By Deployment
        • By Application
    • Argentina
      • Pricing Analysis
      • Market Share Analysis, 2024
        • By Type
        • By Deployment
        • By Application
  18. Market Structure Analysis
    • Competition Dashboard
    • Competition Benchmarking
    • Market Share Analysis of Top Players
      • By Regional
      • By Type
      • By Deployment
      • By Application
  19. Competition Analysis
    • Competition Deep Dive
      • IBM Corporation
        • Overview
        • Product Portfolio
        • Profitability by Market Segments (Product/Age /Sales Channel/Region)
        • Sales Footprint
        • Strategy Overview
          • Marketing Strategy
          • Product Strategy
          • Channel Strategy
      • Oracle Corporation
        • Overview
        • Product Portfolio
        • Profitability by Market Segments (Product/Age /Sales Channel/Region)
        • Sales Footprint
        • Strategy Overview
          • Marketing Strategy
          • Product Strategy
          • Channel Strategy
      • Cubic Corporation
        • Overview
        • Product Portfolio
        • Profitability by Market Segments (Product/Age /Sales Channel/Region)
        • Sales Footprint
        • Strategy Overview
          • Marketing Strategy
          • Product Strategy
          • Channel Strategy
      • INRIX, Inc.
        • Overview
        • Product Portfolio
        • Profitability by Market Segments (Product/Age /Sales Channel/Region)
        • Sales Footprint
        • Strategy Overview
          • Marketing Strategy
          • Product Strategy
          • Channel Strategy
      • Cellint Traffic Solutions
        • Overview
        • Product Portfolio
        • Profitability by Market Segments (Product/Age /Sales Channel/Region)
        • Sales Footprint
        • Strategy Overview
          • Marketing Strategy
          • Product Strategy
          • Channel Strategy
      • Alteryx, Inc.
        • Overview
        • Product Portfolio
        • Profitability by Market Segments (Product/Age /Sales Channel/Region)
        • Sales Footprint
        • Strategy Overview
          • Marketing Strategy
          • Product Strategy
          • Channel Strategy
      • Hitachi, Ltd.
        • Overview
        • Product Portfolio
        • Profitability by Market Segments (Product/Age /Sales Channel/Region)
        • Sales Footprint
        • Strategy Overview
          • Marketing Strategy
          • Product Strategy
          • Channel Strategy
      • SmartDrive Systems, Inc.
        • Overview
        • Product Portfolio
        • Profitability by Market Segments (Product/Age /Sales Channel/Region)
        • Sales Footprint
        • Strategy Overview
          • Marketing Strategy
          • Product Strategy
          • Channel Strategy
      • Omnitracs
        • Overview
        • Product Portfolio
        • Profitability by Market Segments (Product/Age /Sales Channel/Region)
        • Sales Footprint
        • Strategy Overview
          • Marketing Strategy
          • Product Strategy
          • Channel Strategy
      • Sisense Ltd.
        • Overview
        • Product Portfolio
        • Profitability by Market Segments (Product/Age /Sales Channel/Region)
        • Sales Footprint
        • Strategy Overview
          • Marketing Strategy
          • Product Strategy
          • Channel Strategy
  20. Assumptions & Acronyms Used
  21. Research Methodology

List of Tables

  • Table 1: Global Market Value (USD Billion) Forecast by Region, 2020 to 2035
  • Table 2: Global Market Value (USD Billion) Forecast by Type, 2020 to 2035
  • Table 3: Global Market Value (USD Billion) Forecast by Deployment, 2020 to 2035
  • Table 4: Global Market Value (USD Billion) Forecast by Application, 2020 to 2035
  • Table 5: North America Market Value (USD Billion) Forecast by Country, 2020 to 2035
  • Table 6: North America Market Value (USD Billion) Forecast by Type, 2020 to 2035
  • Table 7: North America Market Value (USD Billion) Forecast by Deployment, 2020 to 2035
  • Table 8: North America Market Value (USD Billion) Forecast by Application, 2020 to 2035
  • Table 9: Latin America Market Value (USD Billion) Forecast by Country, 2020 to 2035
  • Table 10: Latin America Market Value (USD Billion) Forecast by Type, 2020 to 2035
  • Table 11: Latin America Market Value (USD Billion) Forecast by Deployment, 2020 to 2035
  • Table 12: Latin America Market Value (USD Billion) Forecast by Application, 2020 to 2035
  • Table 13: Western Europe Market Value (USD Billion) Forecast by Country, 2020 to 2035
  • Table 14: Western Europe Market Value (USD Billion) Forecast by Type, 2020 to 2035
  • Table 15: Western Europe Market Value (USD Billion) Forecast by Deployment, 2020 to 2035
  • Table 16: Western Europe Market Value (USD Billion) Forecast by Application, 2020 to 2035
  • Table 17: Eastern Europe Market Value (USD Billion) Forecast by Country, 2020 to 2035
  • Table 18: Eastern Europe Market Value (USD Billion) Forecast by Type, 2020 to 2035
  • Table 19: Eastern Europe Market Value (USD Billion) Forecast by Deployment, 2020 to 2035
  • Table 20: Eastern Europe Market Value (USD Billion) Forecast by Application, 2020 to 2035
  • Table 21: East Asia Market Value (USD Billion) Forecast by Country, 2020 to 2035
  • Table 22: East Asia Market Value (USD Billion) Forecast by Type, 2020 to 2035
  • Table 23: East Asia Market Value (USD Billion) Forecast by Deployment, 2020 to 2035
  • Table 24: East Asia Market Value (USD Billion) Forecast by Application, 2020 to 2035
  • Table 25: South Asia & Pacific Market Value (USD Billion) Forecast by Country, 2020 to 2035
  • Table 26: South Asia & Pacific Market Value (USD Billion) Forecast by Type, 2020 to 2035
  • Table 27: South Asia & Pacific Market Value (USD Billion) Forecast by Deployment, 2020 to 2035
  • Table 28: South Asia & Pacific Market Value (USD Billion) Forecast by Application, 2020 to 2035
  • Table 29: Middle East and Africa Market Value (USD Billion) Forecast by Country, 2020 to 2035
  • Table 30: Middle East and Africa Market Value (USD Billion) Forecast by Type, 2020 to 2035
  • Table 31: Middle East and Africa Market Value (USD Billion) Forecast by Deployment, 2020 to 2035
  • Table 32: Middle East and Africa Market Value (USD Billion) Forecast by Application, 2020 to 2035

List of Figures

  • Figure 1: Global Market Pricing Analysis
  • Figure 2: Global Market Value (USD Billion) Forecast 2020 to 2035
  • Figure 3: Global Market Value Share and BPS Analysis by Type, 2025 and 2035
  • Figure 4: Global Market Y-o-Y Growth Comparison by Type, 2025 to 2035
  • Figure 5: Global Market Attractiveness Analysis by Type
  • Figure 6: Global Market Value Share and BPS Analysis by Deployment, 2025 and 2035
  • Figure 7: Global Market Y-o-Y Growth Comparison by Deployment, 2025 to 2035
  • Figure 8: Global Market Attractiveness Analysis by Deployment
  • Figure 9: Global Market Value Share and BPS Analysis by Application, 2025 and 2035
  • Figure 10: Global Market Y-o-Y Growth Comparison by Application, 2025 to 2035
  • Figure 11: Global Market Attractiveness Analysis by Application
  • Figure 12: Global Market Value (USD Billion) Share and BPS Analysis by Region, 2025 and 2035
  • Figure 13: Global Market Y-o-Y Growth Comparison by Region, 2025 to 2035
  • Figure 14: Global Market Attractiveness Analysis by Region
  • Figure 15: North America Market Incremental $ Opportunity, 2025 to 2035
  • Figure 16: Latin America Market Incremental $ Opportunity, 2025 to 2035
  • Figure 17: Western Europe Market Incremental $ Opportunity, 2025 to 2035
  • Figure 18: Eastern Europe Market Incremental $ Opportunity, 2025 to 2035
  • Figure 19: East Asia Market Incremental $ Opportunity, 2025 to 2035
  • Figure 20: South Asia & Pacific Market Incremental $ Opportunity, 2025 to 2035
  • Figure 21: Middle East and Africa Market Incremental $ Opportunity, 2025 to 2035
  • Figure 22: North America Market Value Share and BPS Analysis by Country, 2025 and 2035
  • Figure 23: North America Market Value Share and BPS Analysis by Type, 2025 and 2035
  • Figure 24: North America Market Y-o-Y Growth Comparison by Type, 2025 to 2035
  • Figure 25: North America Market Attractiveness Analysis by Type
  • Figure 26: North America Market Value Share and BPS Analysis by Deployment, 2025 and 2035
  • Figure 27: North America Market Y-o-Y Growth Comparison by Deployment, 2025 to 2035
  • Figure 28: North America Market Attractiveness Analysis by Deployment
  • Figure 29: North America Market Value Share and BPS Analysis by Application, 2025 and 2035
  • Figure 30: North America Market Y-o-Y Growth Comparison by Application, 2025 to 2035
  • Figure 31: North America Market Attractiveness Analysis by Application
  • Figure 32: Latin America Market Value Share and BPS Analysis by Country, 2025 and 2035
  • Figure 33: Latin America Market Value Share and BPS Analysis by Type, 2025 and 2035
  • Figure 34: Latin America Market Y-o-Y Growth Comparison by Type, 2025 to 2035
  • Figure 35: Latin America Market Attractiveness Analysis by Type
  • Figure 36: Latin America Market Value Share and BPS Analysis by Deployment, 2025 and 2035
  • Figure 37: Latin America Market Y-o-Y Growth Comparison by Deployment, 2025 to 2035
  • Figure 38: Latin America Market Attractiveness Analysis by Deployment
  • Figure 39: Latin America Market Value Share and BPS Analysis by Application, 2025 and 2035
  • Figure 40: Latin America Market Y-o-Y Growth Comparison by Application, 2025 to 2035
  • Figure 41: Latin America Market Attractiveness Analysis by Application
  • Figure 42: Western Europe Market Value Share and BPS Analysis by Country, 2025 and 2035
  • Figure 43: Western Europe Market Value Share and BPS Analysis by Type, 2025 and 2035
  • Figure 44: Western Europe Market Y-o-Y Growth Comparison by Type, 2025 to 2035
  • Figure 45: Western Europe Market Attractiveness Analysis by Type
  • Figure 46: Western Europe Market Value Share and BPS Analysis by Deployment, 2025 and 2035
  • Figure 47: Western Europe Market Y-o-Y Growth Comparison by Deployment, 2025 to 2035
  • Figure 48: Western Europe Market Attractiveness Analysis by Deployment
  • Figure 49: Western Europe Market Value Share and BPS Analysis by Application, 2025 and 2035
  • Figure 50: Western Europe Market Y-o-Y Growth Comparison by Application, 2025 to 2035
  • Figure 51: Western Europe Market Attractiveness Analysis by Application
  • Figure 52: Eastern Europe Market Value Share and BPS Analysis by Country, 2025 and 2035
  • Figure 53: Eastern Europe Market Value Share and BPS Analysis by Type, 2025 and 2035
  • Figure 54: Eastern Europe Market Y-o-Y Growth Comparison by Type, 2025 to 2035
  • Figure 55: Eastern Europe Market Attractiveness Analysis by Type
  • Figure 56: Eastern Europe Market Value Share and BPS Analysis by Deployment, 2025 and 2035
  • Figure 57: Eastern Europe Market Y-o-Y Growth Comparison by Deployment, 2025 to 2035
  • Figure 58: Eastern Europe Market Attractiveness Analysis by Deployment
  • Figure 59: Eastern Europe Market Value Share and BPS Analysis by Application, 2025 and 2035
  • Figure 60: Eastern Europe Market Y-o-Y Growth Comparison by Application, 2025 to 2035
  • Figure 61: Eastern Europe Market Attractiveness Analysis by Application
  • Figure 62: East Asia Market Value Share and BPS Analysis by Country, 2025 and 2035
  • Figure 63: East Asia Market Value Share and BPS Analysis by Type, 2025 and 2035
  • Figure 64: East Asia Market Y-o-Y Growth Comparison by Type, 2025 to 2035
  • Figure 65: East Asia Market Attractiveness Analysis by Type
  • Figure 66: East Asia Market Value Share and BPS Analysis by Deployment, 2025 and 2035
  • Figure 67: East Asia Market Y-o-Y Growth Comparison by Deployment, 2025 to 2035
  • Figure 68: East Asia Market Attractiveness Analysis by Deployment
  • Figure 69: East Asia Market Value Share and BPS Analysis by Application, 2025 and 2035
  • Figure 70: East Asia Market Y-o-Y Growth Comparison by Application, 2025 to 2035
  • Figure 71: East Asia Market Attractiveness Analysis by Application
  • Figure 72: South Asia & Pacific Market Value Share and BPS Analysis by Country, 2025 and 2035
  • Figure 73: South Asia & Pacific Market Value Share and BPS Analysis by Type, 2025 and 2035
  • Figure 74: South Asia & Pacific Market Y-o-Y Growth Comparison by Type, 2025 to 2035
  • Figure 75: South Asia & Pacific Market Attractiveness Analysis by Type
  • Figure 76: South Asia & Pacific Market Value Share and BPS Analysis by Deployment, 2025 and 2035
  • Figure 77: South Asia & Pacific Market Y-o-Y Growth Comparison by Deployment, 2025 to 2035
  • Figure 78: South Asia & Pacific Market Attractiveness Analysis by Deployment
  • Figure 79: South Asia & Pacific Market Value Share and BPS Analysis by Application, 2025 and 2035
  • Figure 80: South Asia & Pacific Market Y-o-Y Growth Comparison by Application, 2025 to 2035
  • Figure 81: South Asia & Pacific Market Attractiveness Analysis by Application
  • Figure 82: Middle East and Africa Market Value Share and BPS Analysis by Country, 2025 and 2035
  • Figure 83: Middle East and Africa Market Value Share and BPS Analysis by Type, 2025 and 2035
  • Figure 84: Middle East and Africa Market Y-o-Y Growth Comparison by Type, 2025 to 2035
  • Figure 85: Middle East and Africa Market Attractiveness Analysis by Type
  • Figure 86: Middle East and Africa Market Value Share and BPS Analysis by Deployment, 2025 and 2035
  • Figure 87: Middle East and Africa Market Y-o-Y Growth Comparison by Deployment, 2025 to 2035
  • Figure 88: Middle East and Africa Market Attractiveness Analysis by Deployment
  • Figure 89: Middle East and Africa Market Value Share and BPS Analysis by Application, 2025 and 2035
  • Figure 90: Middle East and Africa Market Y-o-Y Growth Comparison by Application, 2025 to 2035
  • Figure 91: Middle East and Africa Market Attractiveness Analysis by Application
  • Figure 92: Global Market - Tier Structure Analysis
  • Figure 93: Global Market - Company Share Analysis

Frequently Asked Questions

What is the projected size of the transportation analytics market by 2035?

The industry is projected to reach USD 134.1 billion by 2035.

What is the CAGR of the transportation analytics market from 2025 to 2035?

The industry is expected to grow at a CAGR of 23.8% from 2025 to 2035.

What percentage of the transportation analytics market share will descriptive analytics hold in 2025?

Descriptive analytics is expected to hold 48.6% of the industry share in 2025.

Which application will dominate the transportation analytics market in 2025?

Traffic management will dominate the industry, representing 43.5% of the share in 2025.

What is the projected CAGR for India in the transportation analytics market from 2025 to 2035?

India is expected to grow at a CAGR of 23.2% from 2025 to 2035.

Who is the leader in the transportation analytics market?

IBM Corporation is the leader in the industry with a 15% industry share.

Explore Similar Insights

Future Market Insights

Transportation Analytics Market