The Airport Ground Transportation market is experiencing significant growth driven by the rising demand for convenient, reliable, and efficient travel solutions connecting airports to cities and other destinations. The future outlook of the market is shaped by increasing passenger traffic, expansion of airport infrastructure, and the growing adoption of digital booking platforms. Urbanization, rising disposable incomes, and increased domestic and international travel have fueled the need for organized ground transportation services.
The market is further supported by the development of smart mobility solutions and integration of technology to enhance passenger experience, including real-time tracking, dynamic pricing, and personalized services. Regulatory policies promoting safety, efficiency, and accessibility in transportation networks are also contributing to market expansion.
Additionally, tourism growth, particularly in emerging economies, is reinforcing the demand for seamless airport-to-city connectivity As airports and transportation providers continue to innovate and improve operational efficiency, the Airport Ground Transportation market is expected to maintain steady growth in both developed and developing regions.
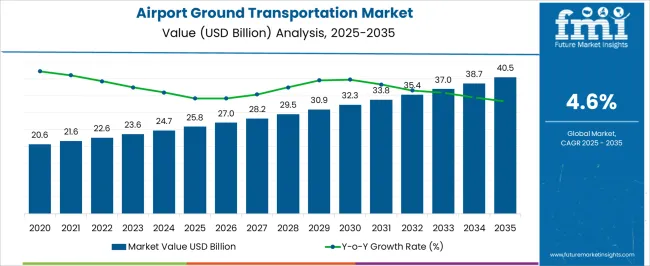
| Metric | Value |
|---|---|
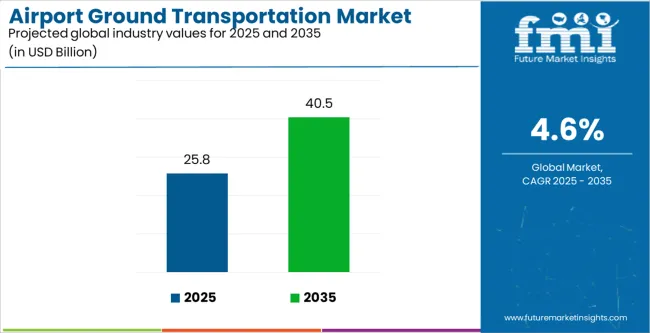
| Airport Ground Transportation Market Estimated Value in (2025 E) | USD 25.8 billion |
| Airport Ground Transportation Market Forecast Value in (2035 F) | USD 40.5 billion |
| Forecast CAGR (2025 to 2035) | 4.6% |
The market is segmented by Vehicle Type, Booking Channel, Tourist Type, Tour Type, Consumer Orientation, and Age Group and region. By Vehicle Type, the market is divided into Cars, Buses, Shuttles, Limousine, Trains, and Trams. In terms of Booking Channel, the market is classified into Online Booking, Phone Booking, and Direct Booking. Based on Tourist Type, the market is segmented into Domestic and International. By Tour Type, the market is divided into Independent Traveller, Package Traveller, and Tour Group. By Consumer Orientation, the market is segmented into Men and Women. By Age Group, the market is segmented into 26 To 35 Years, 15 To 25 Years, 36 To 45 Years, 46 To 55 Years, and 66 To 75 Years. Regionally, the market is classified into North America, Latin America, Western Europe, Eastern Europe, Balkan & Baltic Countries, Russia & Belarus, Central Asia, East Asia, South Asia & Pacific, and the Middle East & Africa.
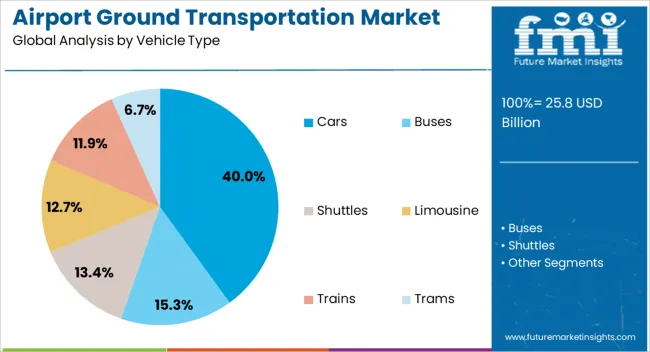
The cars segment is projected to hold 40.00% of the Airport Ground Transportation market revenue share in 2025, making it the leading vehicle type. The growth of this segment has been driven by the convenience, privacy, and flexibility offered by cars for airport transfers.
The ability to provide point-to-point travel, manage luggage efficiently, and offer comfort for passengers traveling alone or in groups has reinforced their preference. The segment has also benefited from partnerships between car rental services and airport operators, facilitating seamless pick-up and drop-off solutions.
Additionally, the increasing adoption of digital platforms for reservations and fleet management has enhanced operational efficiency and customer satisfaction The rising demand for premium and shared cars in urban and suburban areas further supports the growth of this segment.
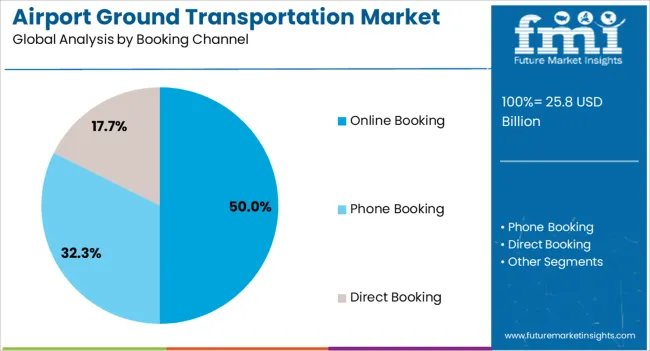
The online booking channel segment is expected to account for 50.00% of the market revenue share in 2025, positioning it as the leading booking channel. This growth has been influenced by the increasing use of mobile applications and web platforms for convenient, quick, and secure reservations.
The ability to compare prices, check vehicle availability in real-time, and access personalized offers has reinforced customer preference for online booking. The segment’s expansion is also driven by partnerships between technology providers and transportation operators, enabling seamless payment options, digital tickets, and real-time notifications.
Additionally, the rising smartphone penetration, improved internet connectivity, and growing trust in digital services have accelerated the adoption of online booking channels.
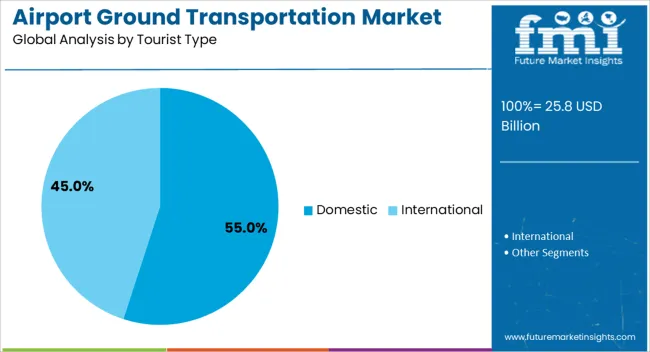
The domestic tourist segment is anticipated to hold 55.00% of the Airport Ground Transportation market revenue share in 2025, making it the leading tourist type. The growth of this segment is driven by the increasing number of domestic travelers seeking convenient and safe transportation solutions for airport transfers.
Factors such as rising disposable incomes, expansion of domestic tourism infrastructure, and the popularity of short-haul trips have supported the adoption of organized ground transport services. The segment has also benefited from government initiatives promoting domestic tourism and regional connectivity, which have encouraged frequent travel.
Moreover, domestic tourists often prefer pre-booked services for reliability, ease of planning, and assurance of timely transfers, reinforcing the dominance of this segment in the market.
Shuttles are at a reasonable cost for both, the airport as well as the passengers. In addition, shuttles require small spaces where they can be parked and they can transport many passengers at one time. This helps to minimize traffic and other operational expenses. Shuttles are predicted to capture a market share of 28.4% in 2025. From passengers' perspective, shuttle services are cheaper than normal taxis or private cars, specifically for people travelling to the same destination. Shuttles also respond to varying shifts in demand for airport transportation services.
| Attributes | Details |
|---|---|
| Vehicle Type | Shuttle |
| Market Share (2025) | 28.40% |
New proficient technologies are efficiently catering to the consumers’ transportation demands. Moreover, shuttle services that offer online booking options with real-time vehicle tracking have been appealing to the consumer, leading to the growth of the overall market. Further, value additions such as low-cost service, convenience, safety, and premium experience have substantially contributed to the demand growth of shuttles at airports.
The convenience and flexibility offered by online booking make the user experience efficient. Travelers have the liberty to book anytime from anywhere through smartphones or computers. This time-saving and hassle-free experience with the benefits of cost provides the market with more demand and heavy consumer flow. The dominance of online platforms and bookings has marked a jump in a very prominent way. The market share is thus slated to be prominent, 48.60% for 2025.
| Attributes | Details |
|---|---|
| Booking Channels | Online Booking |
| Market Share (2025) | 48.60% |
It is easy to determine the rates of flights when booking online since passengers have a choice of which flight to book based on the charges involved. This has brought out much competition to the shuttle service providers which has improved the quality of services and prices to reduce as well. This rise in competition on the back of online booking has allowed service providers to offer better services. All these factors lead to the increased preference for online platforms for airport transportation.
| Countries | CAGR |
|---|---|
| India | 11.50% |
| China | 10.60% |
| Australia | 4.80% |
| Germany | 3.20% |
| The United States | 2.70% |
With improved infrastructure and urbanization, there is an increasing number of air travelers in India. This has surged the demand for efficient and convenient ground transportation services to and from airports. The Indian market is a significant one, with a predicted CAGR of 11.50% through 2035, which is an outstanding scenario for industry players.
A new concept that has developed is customer experience enhancement through the application of technology. Technological inventions such as those used in developing mobile applications for the booking and tracking of the GPS of the car, and electronic payment have also helped in the improvements of many services where cheap share-or-rides services and luxury car services are included.
The World Travel and Tourism Council has established that India is the 7th largest travel & tourism economy in the world in terms of total contribution to GDP in 2024. Many of the worldwide organizations are also investing in airline start-ups which also depict the progressive future in the succeeding years. Some of the key players that exist in this segment of operation in India are Ola Cabs, Uber, and Meru Cabs which offer a wide array of services. Such advancements are emerging along with the experience of travellers and thereby, propelling the airport ground transportation market in India even more.
China, with an impressive CAGR of 10.60% from 2025 to 2035, is estimated to cover a big share of the market. The rapid expansion of the aviation industry is a major growth factor, raising the market to new heights in China. Mass infrastructural growth is also bolstering the accessibility and connectivity of airports.
This is spurring the requirement for ground transportation options. China is known for its technological developments. These include automation, artificial intelligence, data analytics in ground handling operations, and streamlining processes, generating opportunities for growth in the market.
Some of the key players like Didi Chuxing, Shouqi Limousine & Chauffeur, and Meituan Dache provide numerous services ranging from base-end ride-hailing to luxury chauffeur services. The trends of electric as well as autonomous vehicles are prevalent in the Chinese airport ground transportation market that is growing and developing continuously.
Australia is one of the most popular tourist destinations with a significant portion of the population living in major cities, which has created a continuous demand for transport services. The market in Australia is estimated to possess a significant CAGR of 4.8% through the forecast period of 2025 to 2035.
The major players in the market include Uber, Ola, and traditional taxi services that include Yellow Cabs and Silver Top Taxis. Some changes that have taken place in the markets are; the use of environmentally friendly vehicles to suit the company’s greens policy. These factors, in addition to the continuous growth in new airport facilities and rising airport traffic are driving the growth of Australia airport ground transportation market.
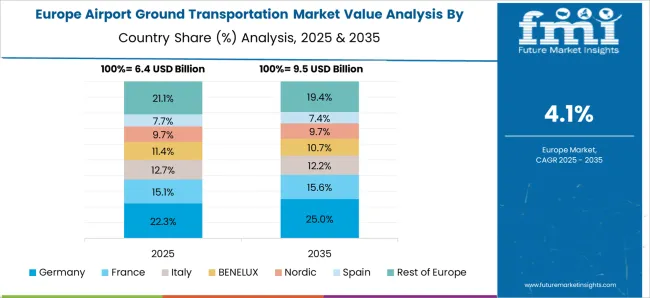
Considering its geographical position on the European continent as a key factor for the development of flights, Germany has an advantageous position in terms of transport infrastructure. This has led to an increased need for professional ground transport service providers to and from the airport. This is because Germany has a robust economy whereby more people are developing a culture of travelling through aerospace. This has in turn contributed to a fast growth of the market in Germany. The market is anticipated to exhibit higher tendencies in the future with a forecast CAGR of 3.2% during the forecast period.
Some of the major competitors dominating the German market include MyTaxi (now FREE NOW), Uber, and traditional taxi services like Taxi Deutschland among others. Cars and other transportation services such as electric and hybrid vehicles by German car manufacturers illustrate Germany’s dedication towards a sustainable and innovative future. This places the country in a strategic position in the market and renders the country one of the most significant contributors to the global market.
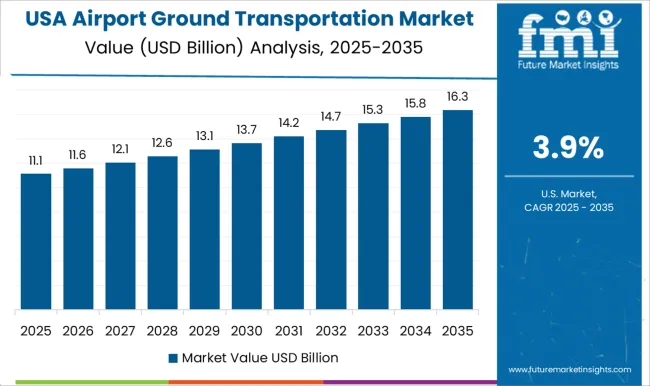
The United States has a very large landmass and a very large and heterogeneous population travelling by air, which creates a need for efficient ground transportation services. The expected compound annual growth rate is poised at 2.7% through the forecast period. Further, the USA is cultivating a perception of luxury travel for domestic and inbound tourists.
Different companies such as Yellow Cab and SuperShuttle still rule the transport industry by offering a variety of transport services from middle class to luxury. The United States has been viewed as possessing premium status and a massive industrial power. This increases demand as domestic and international tourists travel to the country, catering to the different types of transport.
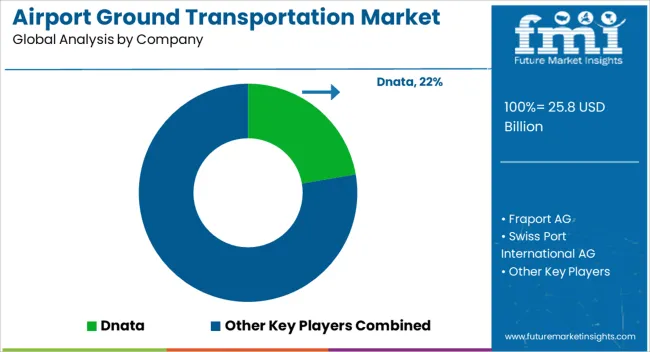
The market is well established, with domestic and international players vying for market dominance at the ground level. These companies have a strong foothold in the market primarily due to their prolonged presence and vast market reach. The market is envisioned to acquire the global areas with more companies and vehicle innovations in the growing economy.
Recent Advancements
The global airport ground transportation market is estimated to be valued at USD 25.8 billion in 2025.
The market size for the airport ground transportation market is projected to reach USD 40.5 billion by 2035.
The airport ground transportation market is expected to grow at a 4.6% CAGR between 2025 and 2035.
The key product types in airport ground transportation market are cars, buses, shuttles, limousine, trains and trams.
In terms of booking channel, online booking segment to command 50.0% share in the airport ground transportation market in 2025.


Full Research Suite comprises of:
Market outlook & trends analysis
Interviews & case studies
Strategic recommendations
Vendor profiles & capabilities analysis
5-year forecasts
8 regions and 60+ country-level data splits
Market segment data splits
12 months of continuous data updates
DELIVERED AS:
PDF EXCEL ONLINE
Airport Quick Service Restaurant Market Size and Share Forecast Outlook 2025 to 2035
Airport Bus Market Analysis - Size, Share, and Forecast Outlook (2025 to 2035)
Airport Runway Lighting Market Size and Share Forecast Outlook 2025 to 2035
Airport Robots Market Size and Share Forecast Outlook 2025 to 2035
Airport Passenger Boarding Bridge Market Size and Share Forecast Outlook 2025 to 2035
Airport Moving Walkways Market Size and Share Forecast Outlook 2025 to 2035
Airport Cabin Baggage Scanner Market Size and Share Forecast Outlook 2025 to 2035
Airport Sleeping Pods Market Analysis - Trends, Growth & Forecast 2025 to 2035
Market Share Breakdown of Airport Security Solutions
Airport Retailing Market Trends - Growth & Forecast 2025 to 2035
Airport Security Market Trends - Growth & Forecast 2025 to 2035
Airport Lighting Market
Airport Information Display System Market
Smart Airport Market Size and Share Forecast Outlook 2025 to 2035
Pre-book Airport Transfer Market Size and Share Forecast Outlook 2025 to 2035
Advanced Airport Technologies Market Size and Share Forecast Outlook 2025 to 2035
Ground Grid Tester Market Size and Share Forecast Outlook 2025 to 2035
Ground and Precipitated Calcium Carbonate Market Size and Share Forecast Outlook 2025 to 2035
Ground Mounted Solar PV Module Market Size and Share Forecast Outlook 2025 to 2035
Ground Mounted Solar EPC Market Size and Share Forecast Outlook 2025 to 2035

Thank you!
You will receive an email from our Business Development Manager. Please be sure to check your SPAM/JUNK folder too.
Chat With
MaRIA