The underground mining equipment industry stands at the threshold of a decade-long expansion trajectory that promises to reshape mineral extraction technology, eco-friendly mining solutions, and automated equipment applications. The market's journey from USD 17.1 billion in 2025 to USD 21.3 billion by 2035 represents substantial growth, demonstrating the accelerating adoption of advanced mining equipment configurations and extraction technology across hard rock mining, coal extraction, battery metals production, and specialty mineral sectors.
The first half of the decade (2025-2030) will witness the market climbing from USD 17.1 billion to approximately USD 19.0 billion, adding USD 1.9 billion in value, which constitutes 45% of the total forecast growth period. This phase will be characterized by the rapid adoption of battery-electric loader systems, driven by increasing underground mining depth requirements and the growing need for high-performance emission-free equipment worldwide. Advanced automation capabilities and electrified machinery systems will become standard expectations rather than premium options.
The latter half (2030-2035) will witness constant growth from USD 19.0 billion to USD 21.3 billion, representing an addition of USD 2.3 billion or 55% of the decade's expansion. This period will be defined by mass market penetration of specialized autonomous mining systems, integration with comprehensive mine operation platforms, and seamless compatibility with existing underground mining infrastructure. The market trajectory signals fundamental shifts in how mining companies approach operational safety optimization and production efficiency management, with participants positioned to benefit from constant demand across multiple equipment types and mining technique segments.
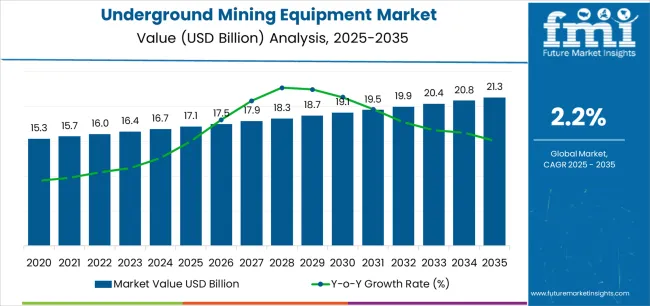
The Underground Mining Equipment market demonstrates distinct growth phases with varying market characteristics and competitive dynamics. Between 2025 and 2030, the market progresses through its technology adoption phase, expanding from USD 17.1 billion to USD 19.0 billion with steady annual increments averaging 2.2% growth. This period showcases the transition from conventional diesel-powered equipment to advanced battery-electric systems with enhanced safety capabilities and integrated automation systems becoming mainstream features.
The 2025-2030 phase adds USD 1.9 billion to market value, representing 45% of total decade expansion. Market maturation factors include standardization of electrification and automation protocols, declining component costs for battery-electric mining equipment, and increasing industry awareness of emission reduction benefits reaching 80-85% operational efficiency in underground mining applications. Competitive landscape evolution during this period features established equipment manufacturers like Caterpillar and Sandvik expanding their electrified equipment portfolios while specialty manufacturers focus on advanced automation development and enhanced safety capabilities.
From 2030 to 2035, market dynamics shift toward advanced autonomous integration and global mining expansion, with growth continuing from USD 19.0 billion to USD 21.3 billion, adding USD 2.3 billion or 55% of total expansion. This phase transition centers on fully autonomous mining equipment systems, integration with comprehensive mine management networks, and deployment across diverse geological and mineral extraction scenarios, becoming standard rather than specialized applications. The competitive environment matures with focus shifting from basic mechanization capability to comprehensive mining optimization systems and integration with predictive maintenance platforms.
| Metric | Value |
|---|---|
| Market Value (2025) | USD 17.1 billion |
| Market Forecast (2035) | USD 21.3 billion |
| Growth Rate | 2.2% CAGR |
| Leading Technology | Mining Loaders Product Type |
| Primary Application | Hard Rock Mining Technique Segment |
The market demonstrates strong fundamentals with mining loader systems capturing a dominant share through advanced material handling and production optimization capabilities. Hard rock mining applications drive primary demand, supported by increasing deep-level mineral extraction and battery metals mining technology requirements. Geographic expansion remains concentrated in developed mining regions with established underground infrastructure, while emerging economies show accelerating adoption rates driven by mineral resource expansion and rising extraction standards.
Market expansion rests on three fundamental shifts driving adoption across the mining, minerals extraction, and resource development sectors. First, deeper resource extraction demand creates compelling operational advantages through underground mining equipment that provides access to subsurface mineral deposits without surface mining limitations, enabling mining companies to reach valuable ore bodies while maintaining production productivity and reducing environmental surface impact. Second, eco-friendly mining modernization accelerates as mining operations worldwide seek advanced electrified systems that replace diesel-powered equipment, enabling emission reduction and air quality control that align with environmental regulations and worker safety standards.
Third, automation and safety enhancement drives adoption from mining facilities and resource extraction companies requiring effective remote-controlled solutions that minimize worker exposure while maintaining operational productivity during hazardous underground mining and deep-level extraction operations. Growth faces headwinds from capital investment challenges that vary across mining companies regarding the procurement of advanced electrified equipment and automation systems, which may limit adoption in price-sensitive mining environments. Technical limitations also persist regarding battery technology and charging infrastructure that may reduce effectiveness in remote mining locations and continuous operation requirements, which affect equipment utilization and operational continuity.
The underground mining equipment market represents a specialized yet critical machinery opportunity driven by expanding global mineral extraction, eco-friendly mining infrastructure modernization, and the need for superior operational safety in diverse underground applications. As mining companies worldwide seek to achieve 80-85% equipment utilization effectiveness, reduce emissions by 60-80%, and integrate advanced automation systems with remote operation platforms, underground mining equipment is evolving from basic mechanized machinery to sophisticated extraction solutions ensuring production efficiency and worker safety.
The market's growth trajectory from USD 17.1 billion in 2025 to USD 21.3 billion by 2035 at a 2.2% CAGR reflects fundamental shifts in mining eco-friendliness requirements and operational safety optimization. Geographic expansion opportunities are particularly pronounced in Asia Pacific markets, while the dominance of mining loader systems (30.0% market share) and hard rock mining applications (55.0% share) provides clear strategic focus areas.
Strengthening the dominant mining loader segment (30.0% market share) through enhanced battery-electric configurations, superior material handling capacity, and automated loading systems. This pathway focuses on optimizing battery technology, improving operational range, extending equipment effectiveness to 18-24 hour operation cycles, and developing specialized loaders for diverse underground applications. Market leadership consolidation through advanced electrification engineering and autonomous operation integration enables premium positioning while defending competitive advantages against conventional diesel equipment. Expected revenue pool: USD 520-680 million
Rapid mineral extraction and coal mining growth across Asia Pacific creates substantial expansion opportunities through local equipment manufacturing capabilities and technology transfer partnerships. Growing battery metals production and government mining development initiatives drive demand for advanced underground equipment systems. Regional manufacturing strategies reduce import costs, enable faster technical support, and position companies advantageously for mining procurement programs while accessing growing domestic markets. Expected revenue pool: USD 450-590 million
Expansion within the dominant hard rock mining segment (55.0% market share) through specialized equipment addressing high-value metal extraction standards and deep-level mining requirements. This pathway encompasses automated drilling systems, rock bolting automation, and compatibility with diverse geological mining processes. Premium positioning reflects superior operational reliability and comprehensive safety compliance supporting modern gold, copper, and nickel extraction. Expected revenue pool: USD 380-500 million
Strategic advancement in battery-electric vehicle adoption requires enhanced power density capabilities and specialized charging infrastructure addressing underground operational requirements. This pathway addresses emission-free mining operations, ventilation cost reduction, and zero-emission equipment mandates with advanced battery engineering for demanding continuous operation conditions. Premium pricing reflects environmental leadership and operational cost savings through reduced ventilation requirements. Expected revenue pool: USD 340-450 million
Development of specialized autonomous equipment for continuous miners, drilling systems, and material transport applications, addressing specific safety requirements and productivity optimization demands. This pathway encompasses remote-controlled operation, autonomous navigation systems, and teleoperation alternatives for hazardous mining environments. Technology differentiation through proprietary automation platforms enables diversified revenue streams while reducing dependency on manual operation requirements. Expected revenue pool: USD 290-380 million
Expansion targeting lithium, cobalt, and nickel mining operations through specialized equipment configurations for battery metals extraction requirements. This pathway encompasses precision drilling for pegmatite deposits, selective mining equipment, and specialized material handling for battery mineral processing. Market development through application-specific engineering enables differentiated positioning while accessing rapidly growing battery metals markets requiring specialized extraction solutions. Expected revenue pool: USD 260-340 million
Development of comprehensive equipment monitoring systems addressing maintenance optimization and downtime reduction requirements across underground mining equipment fleets. This pathway encompasses IoT sensor integration, AI-powered predictive analytics, and comprehensive maintenance management platforms. Premium positioning reflects operational excellence and total cost of ownership optimization while enabling access to digitalization-focused mining companies and technology-driven equipment partnerships. Expected revenue pool: USD 220-290 million
Primary Classification: The market segments by product type into Mining Loaders, Mining Trucks, Mining Drills & Bolters, Continuous Miners, Mining Shearers, and Mining Excavators categories, representing the evolution from basic mechanized equipment to specialized machinery solutions for comprehensive underground extraction optimization.
Secondary Classification: Mining technique segmentation divides the market into Hard Rock Mining and other underground mining methods, reflecting distinct requirements for operational safety, extraction efficiency, and geological formation standards.
Regional Classification: Geographic distribution covers Asia Pacific, North America, Europe, Latin America, Africa, and the Middle East, with developed mining markets leading technology adoption while emerging economies show accelerating growth patterns driven by mineral resource development programs.
The segmentation structure reveals technology progression from conventional diesel-powered machinery toward electrified equipment systems with enhanced automation and remote operation capabilities, while application diversity spans from precious metals mining to specialized battery metals and coal extraction applications requiring advanced underground mining solutions.
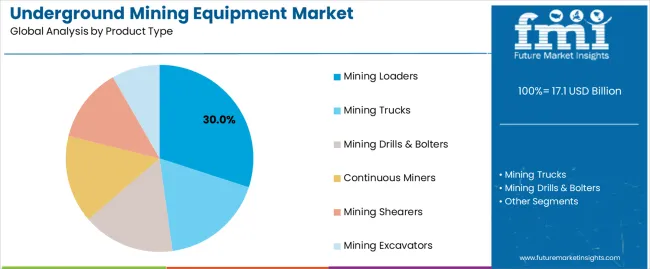
Market Position: Mining loader systems command the leading position in the Underground Mining Equipment market with approximately 30% market share through advanced material handling features, including superior hauling capacity, efficient ore transport capability, and operational flexibility that enable mining companies to achieve optimal material movement across diverse underground mining environments.
Value Drivers: The segment benefits from mining operator preference for versatile loading systems that provide consistent material handling performance, reduced cycle times, and production efficiency optimization without requiring extensive infrastructure modifications. Advanced mechanical features enable automated bucket control, payload monitoring, and integration with existing haulage equipment, where loading performance and reliability represent critical operational requirements.
Competitive Advantages: Mining loader systems differentiate through proven mechanical durability, optimal payload-to-weight ratios, and integration with underground transportation infrastructure that enhance operational effectiveness while maintaining equipment costs suitable for diverse mining applications and geological conditions.
Key market characteristics:
Mining truck systems maintain significant market share due to their essential material transport capabilities in underground haulage operations. Mining drills and bolters capture substantial portions through ground support and development drilling requirements. Continuous miner equipment demonstrates strong adoption in coal mining and soft rock extraction applications requiring high-volume cutting and loading capabilities.
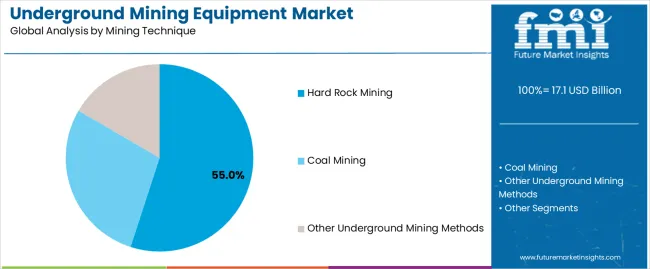
Market Context: Hard rock mining applications dominate the Underground Mining Equipment market with approximately 55% market share due to widespread adoption of specialized equipment systems and increasing focus on precious metals extraction, base metals mining, and battery metals production applications that maximize ore recovery while maintaining underground safety standards.
Appeal Factors: Mining companies prioritize equipment robustness, operational reliability, and integration with existing underground mining infrastructure that enables coordinated extraction operations across multiple mining levels. The segment benefits from substantial high-value mineral production investment and deep-level mining programs that emphasize the acquisition of specialized equipment for gold, copper, nickel, and platinum group metals extraction applications.
Growth Drivers: Battery metals demand expansion programs incorporate specialized underground equipment as essential machinery for lithium, cobalt, and nickel mining operations, while precious metals production growth increases demand for advanced drilling and ground support capabilities that comply with deep-level mining standards and optimize extraction efficiency.
Market Challenges: Varying geological conditions and mining depth requirements may limit equipment standardization across different underground operations or regional mining scenarios.
Application dynamics include:
Coal mining operations maintain significant equipment demand through longwall mining systems, continuous miners, and coal haulage applications. Other underground mining techniques including room-and-pillar, cut-and-fill, and sublevel mining methods require specialized equipment configurations for specific geological and operational requirements.
Growth Accelerators: Deeper resource extraction drives primary adoption as underground mining equipment provides access to subsurface mineral deposits that enable mining companies to reach valuable ore bodies beneath exhausted surface deposits without excessive environmental disturbance, supporting mineral production operations and resource industry missions that require deep-level mining applications. Eco-friendly mining transformation demand accelerates market expansion as operations seek emission-free equipment systems that eliminate underground diesel emissions while maintaining operational effectiveness during extended mining cycles and confined space operations. Battery metals production spending increases worldwide, creating demand for specialized mining equipment that complements lithium, cobalt, and nickel extraction processes and provides operational flexibility in complex geological environments.
Growth Inhibitors: Capital cost challenges vary across mining companies regarding the procurement of battery-electric equipment and automation systems, which may limit operational flexibility and market penetration in regions with constrained capital budgets or price-sensitive commodity markets. Infrastructure limitations persist regarding charging systems and power distribution that may reduce effectiveness in remote mining locations, extended shaft depths, or operations requiring continuous equipment availability, affecting utilization rates and production continuity. Market fragmentation across multiple equipment specifications and mining technique standards creates compatibility concerns between different equipment suppliers and existing underground mining infrastructure.
Market Evolution Patterns: Adoption accelerates in large-scale mining operations and premium mineral extraction sectors where safety requirements justify electrified equipment costs, with geographic concentration in developed mining regions transitioning toward mainstream adoption in emerging economies driven by mineral resource development and environmental regulation enforcement. Technology development focuses on enhanced battery systems, improved autonomous navigation, and integration with mine management platforms that optimize equipment deployment and operational safety. The market could face disruption if alternative mining methods or surface extraction technologies significantly limit the deployment of underground mining equipment in mineral extraction applications, though the industry's fundamental need for deep-level access to high-value ore bodies continues to make underground mining irreplaceable in resource extraction.
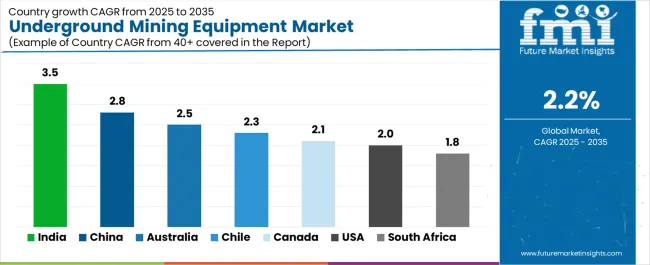
The underground mining equipment market demonstrates varied regional dynamics with Growth Leaders including China (2.8% CAGR) and India (3.5% CAGR) driving expansion through mineral resource development capacity additions and coal mining infrastructure programs. Steady Performers encompass Australia (2.5% CAGR), the United States (2.0% CAGR), and Canada (2.1% CAGR), benefiting from established mining equipment industries and advanced underground mining technology adoption. Mature Markets feature South Africa (1.8% CAGR) and Chile (2.3% CAGR), where specialized precious metals and copper mining applications support consistent growth patterns.
| Country | CAGR (2025-2035) |
|---|---|
| India | 3.5% |
| China | 2.8% |
| Australia | 2.5% |
| Chile | 2.3% |
| Canada | 2.1% |
| United States | 2.0% |
| South Africa | 1.8% |
Regional synthesis reveals Asia Pacific markets leading adoption through coal mining expansion and battery metals infrastructure development, while North American countries maintain steady expansion supported by critical minerals extraction technology advancement and mining modernization requirements. European markets show moderate growth driven by eco-friendly mining applications and battery metals production integration trends.
India leads growth momentum with a 3.5% CAGR, driven by rapid coal mining expansion, iron ore extraction intensification, and emerging battery metals exploration across major mining states including Jharkhand, Odisha, Chhattisgarh, and Madhya Pradesh. Coal India Limited mechanization programs and private sector mining liberalization drive primary equipment demand, while growing energy requirements support underground coal extraction capacity additions. Government mining mechanization initiatives through subsidized equipment financing, technology adoption incentives, and skill development programs support expansion.
The convergence of energy demand growth, mining sector reforms through amended Mining Act provisions, and mechanization adoption replacing manual operations positions India as a key emerging market for underground mining equipment. Commercial coal mining auctions and captive mine development accelerate equipment procurement, while safety regulation enforcement drives replacement of aging machinery with modern systems meeting statutory compliance requirements.
Performance Metrics:
The Chinese market emphasizes extensive underground mining capacity with documented operational effectiveness in coal extraction and base metals production facilities through integration with domestic equipment manufacturing and mining infrastructure. The country leverages manufacturing expertise in mining machinery and automation technology to maintain substantial market presence at 2.8% CAGR. Mining regions including Shanxi, Inner Mongolia, Shaanxi, and Xinjiang showcase large-scale installations where underground equipment integrates with comprehensive coal production platforms and material handling systems to optimize extraction efficiency and operational safety. Chinese mining companies prioritize high-capacity equipment and domestic manufacturing capabilities, creating demand for locally produced systems with competitive pricing that meet national mining standards. The market benefits from government support for mining mechanization through 14th Five-Year Plan provisions, coal industry consolidation programs, and resource security initiatives that emphasize advanced equipment adoption.
State-owned enterprises drive substantial equipment procurement through centralized purchasing programs, while integrated coal-to-chemical projects require comprehensive underground extraction systems. Environmental regulations promoting cleaner coal production and methane drainage operations create additional equipment demand for specialized underground development machinery.
Market Intelligence Brief:
Advanced mining market in Australia demonstrates sophisticated underground equipment deployment with documented operational effectiveness in gold mining, base metals extraction, and underground coal operations through integration with automation systems and safety infrastructure. The country leverages engineering expertise in mining technology and operational excellence to maintain strong equipment adoption at 2.5% CAGR. Mining regions including Western Australia, Queensland, and New South Wales showcase premium installations where underground equipment integrates with comprehensive mine management platforms and remote operation systems to optimize production reliability and worker safety. Australian mining companies prioritize operational safety, automation integration, and environmental compliance, creating demand for premium equipment with advanced features including tele-remote operation, collision avoidance systems.
Gold mining operations in Kalgoorlie-Boulder region and base metals extraction in Mount Isa drive equipment demand, while underground coal mining in Bowen Basin requires specialized longwall and continuous miner systems. Battery metals exploration including lithium and rare earth projects creates emerging opportunities for hard rock mining equipment in Western Australia and Northern Territory.
Strategic Market Indicators:
Chile demonstrates consistent market presence at 2.3% CAGR through underground copper mining expansion, particularly in aging open-pit operations transitioning to underground extraction methods including block-caving and panel-caving techniques. Major mining companies operating Chuquicamata underground project (world's largest underground copper mine conversion) and El Teniente mine (world's largest underground copper mine by reserves) require large-scale equipment for mass mining methods and high-tonnage material handling. Codelco modernization programs drive substantial equipment procurement for underground mine development, while private sector operators including Anglo American and Antofagasta Minerals invest in specialized equipment for deep-level copper extraction. Lithium mining development in Atacama region creates emerging opportunities for underground brine extraction equipment, though surface operations remain dominant.
The transition from open-pit to underground mining at major copper deposits requires significant capital investment in specialized equipment capable of handling large production volumes and challenging rock conditions. Block-caving infrastructure development demands comprehensive equipment fleets including production drills, underground loaders, and high-capacity haulage trucks.
Performance Metrics:
Canada maintains steady expansion at 2.1% CAGR through diversified demand from precious metals mining, base metals extraction, potash production, and underground coal operations across major mining provinces. Ontario and Quebec gold mining operations in Abitibi greenstone belt and Timmins camp drive equipment demand for deep-level hard rock mining, while base metals production in Sudbury Basin and Thompson nickel belt requires specialized underground equipment for massive sulfide ore extraction. Saskatchewan potash mining through solution mining and conventional underground extraction requires unique equipment configurations for deep shaft operations and large-scale production rooms. British Columbia coal mining operations and emerging battery metals projects in Quebec and Northwest Territories provide diversified market opportunities.
Deep-level gold mining operations exceeding 2,000-3,000 meters depth require specialized equipment capable of operating in high-stress rock conditions and elevated underground temperatures. Mining companies emphasize automation integration and remote operation capabilities to improve safety and productivity in challenging underground environments.
Market Characteristics:
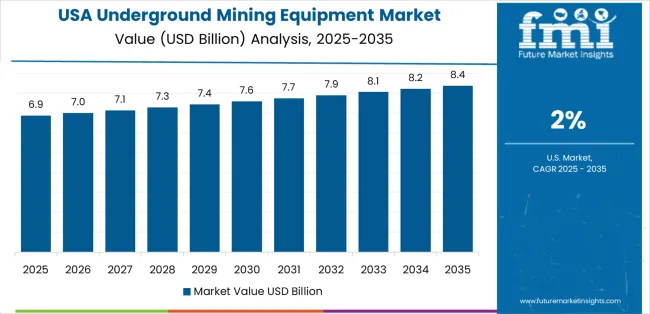
The USA market emphasizes advanced mining equipment features, including precision automation control and integration with comprehensive safety platforms that manage ground support monitoring, ventilation optimization, and emergency response applications through unified mine management systems. The country demonstrates steady growth at 2.0% CAGR driven by critical minerals production initiatives, precious metals mining operations, and underground coal extraction modernization that support equipment upgrades. American mining operators prioritize operational safety with underground equipment delivering reliable performance through advanced mechanical design and comprehensive safety system integration capabilities. Equipment deployment channels include major mining companies, specialized underground contractors, and equipment distributors that support professional installations for complex hard rock mining and coal extraction applications.
Gold mining operations in Nevada (Carlin Trend and Cortez deposits) drive equipment demand for underground development and production activities. Critical minerals initiatives through Defense Production Act invocation and Infrastructure Investment and Jobs Act funding support domestic lithium, rare earth, and strategic mineral production requiring specialized underground extraction equipment.
Strategic Development Indicators:
Mining market in South Africa focuses on ultra-deep gold and platinum group metals (PGM) mining with equipment requirements for extreme depth operations exceeding 3,000 meters below surface at 1.8% CAGR. Established mining companies operating in Witwatersrand Basin gold fields and Bushveld Complex platinum operations require specialized equipment configurations for high-stress rock conditions, elevated underground temperatures approaching 50-60°C, and intensive ground support requirements. Gold mining companies including AngloGold Ashanti, Harmony Gold, and Sibanye-Stillwater operate some of world's deepest mines requiring robust equipment capable of withstanding extreme conditions. PGM mining operations by Anglo American Platinum, Impala Platinum, and Northam Platinum drive equipment demand for mechanized mining methods replacing conventional labor-intensive techniques.
Mining transformation programs through Mining Charter compliance and safety regulation enforcement by Mine Health and Safety Inspectorate drive equipment modernization, while Section 54 safety stoppages and regulatory interventions accelerate replacement of aging machinery. Equipment durability, heat resistance capabilities, and comprehensive safety systems remain critical selection factors for deep-level mining applications.
Performance Metrics:
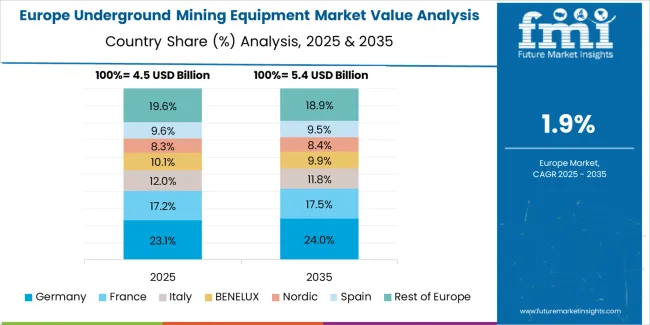
The European underground mining equipment market is projected to grow from USD 1.4 billion in 2025 to USD 1.7 billion by 2035, registering a CAGR of approximately 1.9% over the forecast period. Sweden is expected to maintain its leadership position with a 28.0% market share in 2025, declining slightly to 27.5% by 2035, supported by battery metals mining expansion and advanced eco-friendly mining infrastructure in Norrbotten region.
Finland follows with a 22.0% share in 2025, projected to reach 22.5% by 2035, driven by comprehensive battery metals extraction programs and mining technology innovation initiatives. Germany holds a 16.0% share in 2025, expected to moderate to 15.8% by 2035 through specialized potash mining operations and critical minerals exploration activities. Poland commands a 14.0% share in 2025, maintaining 14.0% by 2035 through extensive underground coal mining and copper extraction operations. Spain accounts for 8.0% in 2025, reaching 8.2% by 2035 aided by base metals mining and mining equipment modernization programs. The United Kingdom maintains 5.0% share in 2025, increasing to 5.2% by 2035 driven by potash mining development and historical mining region revitalization. The Rest of Europe region is anticipated to hold 7.0% in 2025, expanding to 6.8% by 2035, reflecting steady adoption across Central European mining operations, Balkan mineral extraction projects, and emerging battery metals exploration programs.
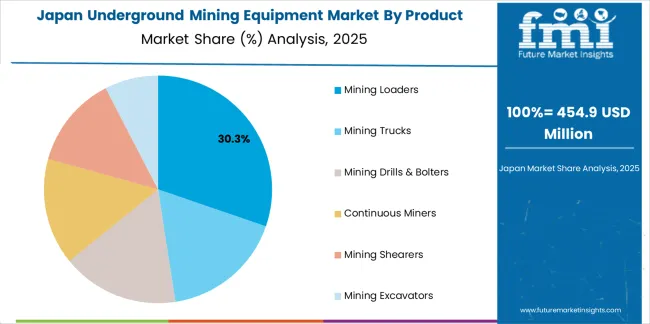
Japan demonstrates modest market development characterized by specialized underground mining operations and advanced equipment technology preferences that emphasize precision engineering, operational reliability, and comprehensive safety systems. The Japanese market focuses on limited but high-quality underground mining activities including limestone extraction for cement production, coal mining operations in Hokkaido (though largely phased out), and specialized mineral extraction requiring premium equipment specifications that reflect the country's renowned manufacturing excellence standards. Mining equipment procurement emphasizes technological sophistication, integration with comprehensive safety monitoring systems, and long-term durability requirements that align with Japanese industrial quality expectations. The market benefits from domestic equipment manufacturers including Komatsu Ltd. and Hitachi Construction Machinery maintaining strong technology development capabilities, while international suppliers provide specialized solutions for specific mining applications requiring advanced automation and monitoring features.
Market Development Factors:
South Korea demonstrates specialized market characteristics focused on limited domestic underground mining activities but substantial equipment technology development and export capabilities. The Korean market emphasizes coal mining operations (primarily in Gangwon Province with declining production), limestone extraction for industrial applications, and mineral exploration activities requiring advanced equipment with sophisticated control systems and comprehensive safety features. Korean mining companies and equipment users prioritize automation integration, remote operation capabilities, and digital transformation initiatives that reflect the country's leadership in industrial technology adoption and smart manufacturing systems. The market benefits from government support for mining industry modernization, safety enhancement programs, and technology development initiatives supporting equipment upgrades and operational efficiency improvements.
Strategic Development Indicators:
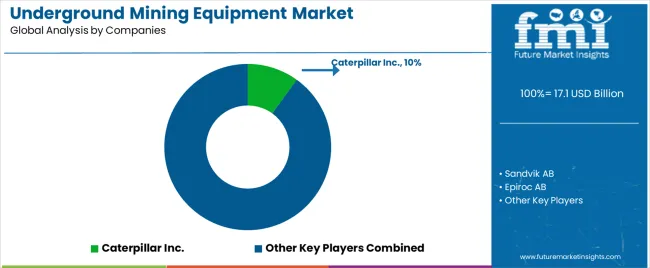
The underground mining equipment market operates with moderate concentration, featuring approximately 35-45 meaningful participants, where leading companies control roughly 45-50% of the global market share through established mining industry relationships and comprehensive equipment portfolios. Competition emphasizes advanced electrification capabilities, automation technology, and safety system integration rather than price-based rivalry. Tier 1 companies including Caterpillar Inc., Sandvik AB, and Epiroc AB collectively command approximately 20-25% market share through their comprehensive underground mining equipment product lines and extensive global mining industry presence.
Market Leaders encompass Caterpillar Inc., Sandvik AB, and Epiroc AB, which maintain competitive advantages through extensive underground mining expertise, global equipment distribution networks, and comprehensive automation integration capabilities that create customer switching costs and support premium pricing. These companies leverage decades of mining equipment experience and ongoing research investments to develop advanced underground systems with autonomous operation control and battery-electric propulsion features.
Technology Innovators include Komatsu Ltd., Volvo Construction Equipment, and specialized mining equipment manufacturers, which compete through focused electrification technology development and innovative automation interfaces that appeal to mining companies seeking advanced emission-free capabilities and operational safety improvements. These companies differentiate through rapid technology development cycles and specialized underground mining application focus.
Regional Specialists feature companies with specific geographic market focus and specialized applications, including battery-electric systems and integrated mining automation solutions. Market dynamics favor participants that combine reliable mechanical designs with advanced control systems, including autonomous navigation capabilities and predictive maintenance monitoring features. Competitive pressure intensifies as traditional construction equipment manufacturers expand into underground mining systems.
| Item | Value |
|---|---|
| Quantitative Units | USD 17.1 billion |
| Product Type | Mining Loaders, Mining Trucks, Mining Drills & Bolters, Continuous Miners, Mining Shearers, Mining Excavators |
| Mining Technique | Hard Rock Mining, Coal Mining, Other Underground Mining Methods |
| Regions Covered | Asia Pacific, North America, Europe, Latin America, Africa, Middle East |
| Countries Covered | China, India, Australia, United States, Canada, South Africa, Chile, Sweden, Finland, Germany, and 25+ additional countries |
| Key Companies Profiled | Caterpillar Inc., Sandvik AB, Epiroc AB, Komatsu Ltd., Volvo Construction Equipment, Hitachi Construction Machinery, Liebherr Group, Atlas Copco, Joy Global (Komatsu Mining Corp.), RDH Mining Equipment |
| Additional Attributes | Dollar sales by product type and mining technique categories, regional adoption trends across Asia Pacific, North America, and Europe, competitive landscape with equipment manufacturers and mining technology suppliers, mining operator preferences for equipment reliability and operational safety, integration with mine management platforms and autonomous operation systems, innovations in battery-electric configurations and automation capabilities, and development of zero-emission solutions with enhanced performance and mining optimization capabilities. |
The global underground mining equipment market is estimated to be valued at USD 17.1 billion in 2025.
The market size for the underground mining equipment market is projected to reach USD 21.3 billion by 2035.
The underground mining equipment market is expected to grow at a 2.2% CAGR between 2025 and 2035.
The key product types in underground mining equipment market are mining loaders , mining trucks, mining drills & bolters, continuous miners, mining shearers and mining excavators.
In terms of mining technique, hard rock mining segment to command 55.0% share in the underground mining equipment market in 2025.


Full Research Suite comprises of:
Market outlook & trends analysis
Interviews & case studies
Strategic recommendations
Vendor profiles & capabilities analysis
5-year forecasts
8 regions and 60+ country-level data splits
Market segment data splits
12 months of continuous data updates
DELIVERED AS:
PDF EXCEL ONLINE
Competitive Overview of Underground Mining Equipment Market Share
Underground Hydrogen Storage Market Size and Share Forecast Outlook 2025 to 2035
Underground Coal Gasification Industry Analysis in Asia Pacific Size and Share Forecast Outlook 2025 to 2035
Underground Cabling EPC Market Size and Share Forecast Outlook 2025 to 2035
Underground Storage Tanks Market
Underground Service Locator Market
Underground Mining Automation Market Size and Share Forecast Outlook 2025 to 2035
North America Underground Mining Vehicle Market Size and Share Forecast Outlook 2025 to 2035
Mining Remanufacturing Component Market Forecast Outlook 2025 to 2035
Mining Hose Market Size and Share Forecast Outlook 2025 to 2035
Mining Tester Market Size and Share Forecast Outlook 2025 to 2035
Mining Lubricant Market Size and Share Forecast Outlook 2025 to 2035
Mining Pneumatic Saw Market Size and Share Forecast Outlook 2025 to 2035
Mining Drilling Service Market Size and Share Forecast Outlook 2025 to 2035
Mining Trucks Market Size and Share Forecast Outlook 2025 to 2035
Mining Dump Trucks Market Size and Share Forecast Outlook 2025 to 2035
Mining Shovel Market Analysis - Size, Share, and Forecast Outlook 2025 to 2035
Mining Flotation Chemicals Market Size, Growth, and Forecast 2025 to 2035
Mining Drill Market Growth – Trends & Forecast 2025 to 2035
Mining Explosives Consumables Market Growth – Trends & Forecast 2025 to 2035

Thank you!
You will receive an email from our Business Development Manager. Please be sure to check your SPAM/JUNK folder too.
Chat With
MaRIA