The mining hose industry is valued at USD 471.8 million in 2025 and projected to reach USD 894.0 million by 2035, recording an absolute increase of USD 422.2 million at a CAGR of 6.6%. Industry share dynamics are distributed across slurry hose demand, dewatering hose applications, dust suppression hose installations, and process water transfer hoses, with slurry hoses retaining the largest proportion due to their dominance in abrasive material transport in both underground mining and open-pit mining operations. Dewatering hoses maintain a stable share as mine operators prioritize industrial water management, while dust suppression hoses capture an incremental share due to regulatory emphasis on air quality compliance. Process water transfer hoses are steadily expanding their proportion of demand, aligned with higher ore processing volumes in coal mining, iron ore extraction, copper projects, and rare earth production.
Rubber hoses hold the highest share of the mining hose market, driven by durability, abrasion resistance, and cost effectiveness in fluid transfer across diverse mining operations. Composite hoses are gradually lifting their market share as lightweight design, chemical resistance, and handling flexibility prove advantageous in slurry transport and remote dewatering systems. Thermoplastic hoses remain niche but are expanding their share in dust suppression and high-pressure water transfer, where UV resistance and lifecycle benefits support adoption. The balance between rubber hose systems and advanced composite hose technologies illustrates a dual market structure, where legacy demand coexists with engineered hose growth.
Regional share is concentrated in Asia Pacific, which leads the mining hose market share due to intensive mineral production in China, India, and Australia. North America sustains a significant proportion, supported by replacement demand, slurry hose upgrades, and integration with automated fluid transfer systems. Europe captures a smaller but specialized share, with stricter environmental frameworks boosting the adoption of recyclable hoses and low-maintenance designs. Latin America, led by Brazil and Chile, is building share through copper and iron ore projects, while Africa is gradually expanding its contribution through gold, diamond, and bauxite mining investments. Each region’s share is influenced by mining infrastructure, investment scale, and compliance requirements around water management and dust suppression.
Competitive share is fragmented between multinational suppliers of mining hoses that secure long-term service contracts with global mining companies and regional manufacturers that compete for price-sensitive hose demand. Global players capture higher revenue share through slurry hose solutions, advanced composite hoses, and integrated maintenance programs, while regional firms preserve local share by supplying standard-grade hoses for short lifecycle applications. By 2035, slurry hoses are projected to dominate overall industry share, but composite and thermoplastic hoses will expand faster, lifting their combined share within mining water management and specialized hose applications.
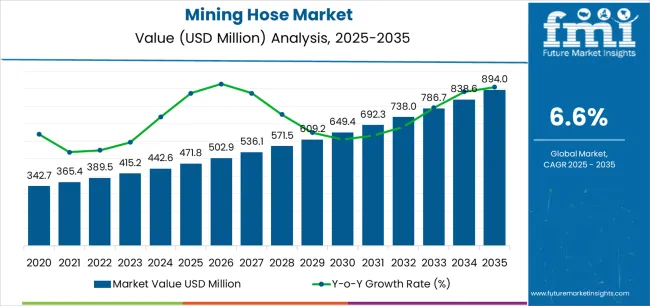
The Mining Hose market demonstrates distinct growth phases with varying market characteristics and competitive dynamics. Between 2025 and 2030, the market progresses through its material innovation phase, expanding from USD 471.8 million to USD 654.0 million with steady annual increments averaging 6.6% growth. This period showcases the transition from conventional natural rubber compounds to advanced synthetic rubber formulations with enhanced abrasion resistance capabilities and integrated reinforcement layers becoming mainstream features across demanding mining applications.
The 2025-2030 phase adds USD 182.2 million to market value, representing 43% of total decade expansion. Market maturation factors include standardization of synthetic rubber compounds across polyurethane, nitrile, and styrene-butadiene formulations, declining material costs for high-performance hose construction, and increasing industry awareness of durability benefits reaching 70-80% lifecycle cost reduction in abrasive mining applications. Competitive landscape evolution during this period features established hose manufacturers like Trelleborg and Continental expanding their mining-specific product portfolios while specialty manufacturers focus on application-specific hose development and enhanced pressure rating capabilities.
From 2030 to 2035, market dynamics shift toward comprehensive mining water management integration and global mining expansion, with growth continuing from USD 654.0 million to USD 894.0 million, adding USD 238.2 million or 57% of total expansion. This phase transition centers on fully integrated hose systems with monitoring capabilities, compatibility with automated dewatering platforms, and deployment across diverse geological and operational scenarios, becoming standard rather than specialized applications. The competitive environment matures with focus shifting from basic material capability to comprehensive fluid management systems and integration with predictive maintenance monitoring platforms.
| Metric | Value |
|---|---|
| Market Value (2025) | USD 471.8 million |
| Market Forecast (2035) | USD 892.2 million |
| Growth Rate | 6.6% CAGR |
| Leading Material Type | Synthetic Rubber (70.0% share) |
| Primary Application | Industrial Water/Alkali Transfer (52.0% share) |
The market demonstrates strong fundamentals with synthetic rubber hose systems capturing a dominant 70.0% share through advanced abrasion resistance and chemical compatibility capabilities. Industrial water and alkali transfer applications drive primary demand at 52.0% share, supported by increasing dewatering requirements and process water management technology needs. Geographic expansion remains concentrated in developed mining regions with established infrastructure, while emerging economies show accelerating adoption rates driven by mineral resource expansion and rising operational efficiency standards.
Market expansion rests on three fundamental shifts driving adoption across the mining, minerals extraction, and resource development sectors. First, expanding mining production capacity creates compelling operational advantages through specialized mining hoses that provide reliable fluid transfer for slurry transport, dewatering operations, and process water management, enabling mining companies to maintain production productivity while managing aggressive chemicals and abrasive materials without frequent hose replacement cycles. Second, operational efficiency modernization accelerates as mining operations worldwide seek advanced synthetic rubber systems that replace traditional natural rubber hoses, enabling superior abrasion resistance and pressure handling capabilities that align with demanding mining conditions and extended service life requirements.
Third, water management optimization drives adoption from mining facilities and resource extraction companies requiring effective dewatering solutions that minimize production disruption while maintaining environmental compliance during pit dewatering, tailings management, and process water recycling operations. Growth faces headwinds from material cost volatility that varies across synthetic rubber compound specifications regarding the procurement of polyurethane, nitrile, and specialized elastomer formulations, which may limit adoption in price-sensitive mining environments. Technical limitations also persist regarding hose flexibility and cold-weather performance that may reduce effectiveness in extreme mining locations and low-temperature operations, which affect equipment compatibility and operational reliability.
The mining hose market represents a specialized yet critical industrial component opportunity driven by expanding global mining operations, water management infrastructure modernization, and the need for superior abrasion resistance in diverse mining applications. As mining companies worldwide seek to achieve 70-80% lifecycle cost reduction, minimize downtime by 60-75%, and integrate advanced hose systems with automated monitoring platforms, mining hoses are evolving from basic rubber tubes to sophisticated fluid transfer solutions ensuring operational efficiency and environmental compliance.
The market's growth trajectory from USD 471.8 million in 2025 to USD 892.2 million by 2035 at a 6.6% CAGR reflects fundamental shifts in mining water management requirements and operational efficiency optimization. Geographic expansion opportunities are particularly pronounced in Asia Pacific markets, while the dominance of synthetic rubber materials (70.0% market share) and industrial water transfer applications (52.0% share) provides clear strategic focus areas.
Strengthening the dominant synthetic rubber segment (70.0% market share) through enhanced polyurethane formulations, superior nitrile rubber compounds, and advanced styrene-butadiene configurations. This pathway focuses on optimizing abrasion resistance, improving chemical compatibility, extending service life to 5-7 year operational cycles, and developing specialized compounds for diverse mining chemicals. Market leadership consolidation through advanced polymer engineering and multi-layer reinforcement integration enables premium positioning while defending competitive advantages against conventional natural rubber products. Expected revenue pool: USD 95-125 million
Rapid mineral extraction and coal mining growth across Asia Pacific creates substantial expansion opportunities through local hose manufacturing capabilities and distribution network partnerships. Growing battery metals production and government mining development initiatives drive demand for specialized mining hose systems. Regional manufacturing strategies reduce import costs, enable faster technical support, and position companies advantageously for mining procurement programs while accessing growing domestic markets. Expected revenue pool: USD 82-108 million
Expansion within the slurry transport segment (38.0% market share) through specialized hose construction addressing high-solids content standards and abrasive mineral handling requirements. This pathway encompasses advanced liner technology, multi-ply reinforcement systems, and compatibility with diverse slurry pumping processes. Premium positioning reflects superior wear resistance and comprehensive pressure handling supporting modern copper concentrate, iron ore, and coal slurry operations. Expected revenue pool: USD 68-89 million
Strategic advancement in high-pressure hose adoption (>300 PSI segment at 36.0% share) requires enhanced reinforcement capabilities and specialized construction addressing demanding pressure requirements. This pathway addresses hydraulic mining applications, high-head dewatering operations, and concentrated slurry transfer with advanced textile and wire reinforcement engineering for continuous high-pressure conditions. Premium pricing reflects operational safety and extended service life through superior burst resistance capabilities. Expected revenue pool: USD 61-80 million
Development of specialized dewatering hose systems (27.0% application share) for pit dewatering, underground water removal, and tailings water management applications, addressing specific flow rate requirements and submersible pump compatibility demands. This pathway encompasses suction hose configurations, flexible deployment systems, and rapid connection alternatives for temporary dewatering installations. Technology differentiation through proprietary compound formulations enables diversified revenue streams while reducing dependency on general-purpose transfer hose segments. Expected revenue pool: USD 54-71 million
Expansion targeting industrial water and alkali applications (52.0% transporting media share) through chemical-resistant compound development and pH-resistant liner technology. This pathway encompasses process water recycling, chemical reagent transfer, and alkaline solution handling for mineral processing requirements. Market development through application-specific engineering enables differentiated positioning while accessing rapidly growing water recycling markets requiring specialized chemical transfer solutions. Expected revenue pool: USD 48-63 million
Development of comprehensive hose monitoring systems addressing wear detection and replacement optimization requirements across mining hose fleets. This pathway encompasses RFID tag integration, usage tracking capabilities, and comprehensive maintenance management platforms. Premium positioning reflects operational excellence and total cost of ownership optimization while enabling access to digitalization-focused mining companies and technology-driven maintenance partnerships. Expected revenue pool: USD 41-54 million
Primary Classification: The market segments by material into Synthetic Rubber and Natural Rubber categories, representing the evolution from traditional natural elastomers to advanced synthetic compound solutions for comprehensive mining application optimization.
Secondary Classification: Transporting media segmentation divides the market into Industrial Water/Alkali, Slurry, and Bulk Water categories, reflecting distinct requirements for chemical resistance, abrasion handling, and flow capacity standards.
Tertiary Classification: Application segmentation encompasses Slurry Transport, Dewatering, Dust Suppression, and Process Water/Chemical Transfer, demonstrating diverse operational requirements across mining processes.
Quaternary Classification: Pressure rating segmentation includes Low Pressure (<150 PSI), Medium Pressure (150-300 PSI), and High Pressure (>300 PSI) categories, reflecting varying operational demands and safety requirements.
Regional Classification: Geographic distribution covers Asia Pacific, North America, Europe, Latin America, Africa, and the Middle East, with developed mining markets leading technology adoption while emerging economies show accelerating growth patterns driven by mineral resource development programs.
The segmentation structure reveals technology progression from conventional natural rubber construction toward advanced synthetic elastomer systems with enhanced reinforcement and specialized compound capabilities, while application diversity spans from abrasive slurry handling to specialized chemical transfer applications requiring advanced mining hose solutions.
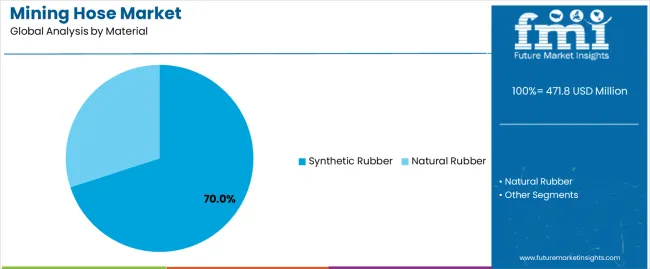
Market Position: Synthetic rubber hose systems command the leading position in the Mining Hose market with approximately 70% market share through advanced material performance features, including superior abrasion resistance at 3-5 times natural rubber capability, excellent chemical compatibility, and operational flexibility that enable mining companies to achieve optimal service life across diverse mining environments and aggressive chemical exposures.
Value Drivers: The segment benefits from mining operator preference for durable hose systems that provide consistent abrasion resistance, reduced replacement frequency, and operational cost optimization without requiring extensive maintenance protocols. Advanced compound formulations enable superior tear resistance, enhanced flexibility retention, and integration with standard coupling systems, where material performance and lifecycle economics represent critical procurement requirements.
Competitive Advantages: Synthetic rubber hoses differentiate through proven durability exceeding 5-7 year service life, optimal compound-to-reinforcement adhesion, and compatibility with diverse mining chemicals that enhance operational effectiveness while maintaining pressure ratings suitable for various mining applications and operational pressures.
Key market characteristics:
Natural rubber hose systems maintain 30% market share through cost advantages in standard water transfer applications and superior flexibility characteristics. The segment serves price-sensitive mining operations, temporary water management installations, and general-purpose bulk water transfer where chemical exposure remains minimal and abrasion levels stay moderate.
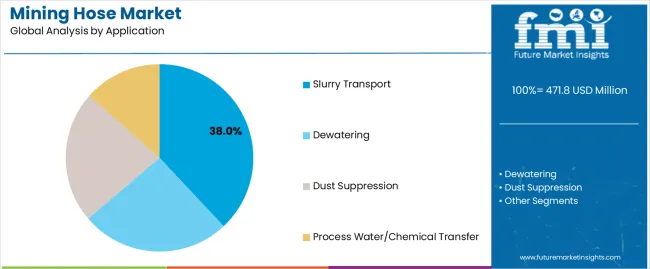
Market Position: Slurry transport applications capture approximately 38% market share in the Mining Hose market, driven by intensive concentrate transfer requirements across mineral processing facilities, tailings management systems, and high-solids fluid transport operations demanding exceptional abrasion resistance and reinforced construction capabilities.
Value Drivers: Mining operators emphasize wear life exceeding 3-5 years in abrasive service, pressure handling capabilities for long-distance pumping, and compound formulations specifically engineered for mineral particle exposure including copper concentrates, iron ore slurries, and coal preparation products.
Competitive Advantages: Slurry transport hoses differentiate through advanced liner technology providing 4-6 times wear life compared to standard industrial hoses, multi-ply reinforcement systems maintaining pressure integrity, and specialized coupling compatibility ensuring leak-free connections in high-solids applications.
Key market characteristics:
Dewatering applications maintain 27% share through pit water removal, underground dewatering, and temporary water management during mine development. Dust suppression systems account for 20.0% share serving haul road watering, stockpile suppression, and crusher dust control operations. Process water and chemical transfer captures 15.0% share addressing mineral processing reagent distribution, leaching solution circulation, and chemical dosing requirements.
Growth Accelerators: Expanding mining production drives primary adoption as specialized mining hoses provide reliable fluid transfer capabilities that enable mining companies to maintain operational continuity across slurry transport, dewatering operations, and process water management without frequent equipment failures, supporting mineral production operations and resource industry missions that require durable material handling systems. Water management modernization demand accelerates market expansion as operations seek chemical-resistant hose systems that handle pH-adjusted process water, alkaline reagents, and acidic mine drainage while maintaining flow capacity during extended operational cycles and demanding chemical exposure conditions. Battery metals and critical minerals production spending increases worldwide, creating demand for specialized mining hoses that complement lithium brine processing, copper concentrate handling, and rare earth extraction processes providing operational flexibility in complex processing environments.
Growth Inhibitors: Raw material cost volatility challenges vary across synthetic rubber compound specifications regarding the procurement of polyurethane, nitrile, and specialty elastomers, which may limit operational flexibility and market penetration in regions with constrained capital budgets or price-sensitive commodity markets. Application-specific requirements persist regarding coupling compatibility and reinforcement specifications that may reduce standardization across different mining operations, pump types, or regional infrastructure standards, affecting inventory management and procurement efficiency. Market fragmentation across multiple pressure ratings, diameter specifications, and material compounds creates compatibility concerns between different hose suppliers and existing mining equipment infrastructure.
Market Evolution Patterns: Adoption accelerates in large-scale mining operations and premium mineral extraction sectors where operational continuity justifies specialized hose investments, with geographic concentration in developed mining regions transitioning toward mainstream adoption in emerging economies driven by mineral resource development and operational efficiency improvements. Technology development focuses on enhanced synthetic compounds, improved reinforcement systems, and integration with monitoring platforms that optimize hose lifecycle management and replacement scheduling. The market could face disruption if alternative fluid transfer technologies or pipeline systems significantly limit the deployment of flexible hoses in mining applications, though the industry's fundamental need for temporary installations, mobile equipment connections, and flexible routing continues to make mining hoses irreplaceable in resource extraction operations.
The mining hose market demonstrates varied regional dynamics with Growth Leaders including China (7.5% CAGR) and India (7.2% CAGR) driving expansion through mineral resource development capacity additions, coal mining infrastructure programs, and battery metals exploration initiatives. Strong Performers encompass Australia (7.1% CAGR) benefiting from iron ore expansion and lithium production growth, while the United States (6.9% CAGR) shows metals revival and brownfield mine restarts. Steady Performers feature Chile (6.6% CAGR) through copper concentrator operations, South Africa (6.3% CAGR) with PGM and coal mining applications, and Canada (5.8% CAGR) supported by nickel, gold mining, and tailings management programs.
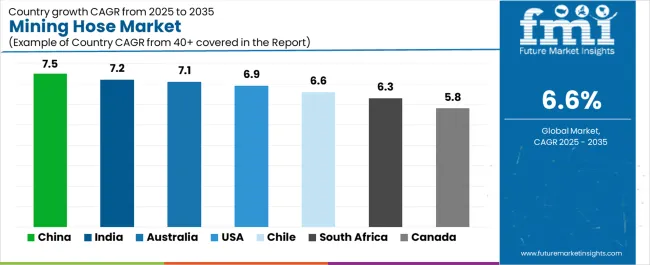
| Country | CAGR (2025-2035) |
|---|---|
| China | 7.5% |
| India | 7.2% |
| Australia | 7.1% |
| United States | 6.9% |
| Chile | 6.6% |
| South Africa | 6.3% |
| Canada | 5.8% |
Regional synthesis reveals Asia Pacific markets leading adoption through coal mining expansion, iron ore production growth, and battery metals infrastructure development, while North American countries maintain strong expansion supported by metals production revival and mining modernization requirements. Latin American markets show consistent growth driven by copper mining operations, while African markets demonstrate steady expansion through platinum group metals and coal mining applications.
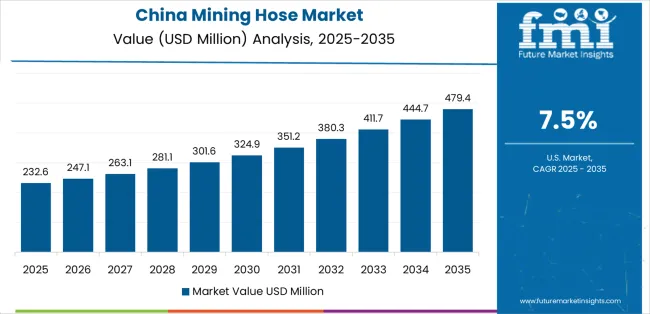
China leads growth momentum with a 7.5% CAGR, driven by extensive coal mining operations, iron ore extraction intensification, and emerging battery metals production including rare earth mining across major mining provinces including Shanxi, Inner Mongolia, Shaanxi, and Jiangxi. State-owned coal enterprises and integrated steel producers drive primary hose demand through large-scale mining operations and mineral processing capacity additions. Rare earth mining expansion in southern provinces and lithium production development create diversified demand for specialized slurry and chemical-resistant hoses.
The convergence of mining production growth, environmental compliance requirements mandating closed-loop water systems, and operational efficiency programs replacing improvised hose installations positions China as the dominant growth market for mining hoses. Coal-to-chemicals integration projects and mineral processing modernization accelerate specialized hose procurement, while safety regulation enforcement drives replacement of substandard hoses with pressure-rated certified systems meeting national mining standards.
Performance Metrics:
The Indian market emphasizes rapid mining mechanization with documented operational expansion in coal extraction, iron ore production, and emerging battery metals exploration through integration with domestic hose manufacturing and mining supply chains. The country leverages growing industrial capacity in rubber products and mining equipment to maintain substantial market presence at 7.2% CAGR. Mining regions including Jharkhand, Odisha, Chhattisgarh, and Madhya Pradesh showcase expanding installations where mining hoses integrate with mechanized loading equipment, dewatering pumps, and mineral processing systems to optimize operational efficiency and environmental compliance. Indian mining companies prioritize cost-effective hose solutions and domestic manufacturing capabilities, creating demand for locally produced systems with competitive pricing that meet Indian mining standards.
Coal India Limited subsidiaries and captive mining operations drive substantial hose procurement through equipment modernization programs, while commercial coal mining auctions create new demand from private sector operators. Iron ore mining expansion and aluminum production growth generate diversified hose requirements beyond coal-focused applications.
Market Intelligence Brief:
Australia's advanced mining market demonstrates sophisticated mining hose deployment with documented operational effectiveness in iron ore operations, lithium extraction, and underground gold mining through integration with automated pumping systems and water management infrastructure. The country leverages engineering expertise in mining technology and operational excellence to maintain strong hose adoption at 7.1% CAGR. Mining regions including Western Australia's Pilbara region, Queensland coal operations, and lithium projects showcase premium installations where mining hoses integrate with comprehensive dewatering platforms, concentrate pipeline systems, and tailings management facilities to optimize production reliability and environmental performance.
Australian mining companies prioritize operational reliability, abrasion resistance, and environmental compliance, creating demand for premium hoses with advanced synthetic rubber compounds including polyurethane and nitrile formulations. Iron ore mining operations and lithium hard-rock processing drive hose demand, while underground gold mining in Western Australia requires specialized high-pressure dewatering systems.
Strategic Market Indicators:
The USA market emphasizes mining operations revival with documented expansion in copper mining, gold production, and critical minerals development through integration with modernized processing equipment and water management systems at 6.9% CAGR. American mining operators prioritize operational safety compliance and equipment reliability with mining hoses delivering consistent performance through advanced material specifications and comprehensive pressure rating certifications. Equipment deployment channels include major mining companies, specialized mining contractors, and industrial distributors that support professional installations for diverse hard rock mining and coal extraction applications.
Gold mining operations in Nevada and copper production in Arizona, Utah, and New Mexico drive constant hose demand for dewatering, slurry transport, and process water applications. Critical minerals initiatives through federal funding support domestic rare earth and lithium production requiring specialized hose systems for chemical processing and concentrate handling.
Strategic Development Indicators:
Chile maintains consistent market presence at 6.6% CAGR through extensive copper mining operations requiring specialized hoses for concentrate handling, tailings management, and dewatering applications at both surface and underground mining operations. Major mining companies including Codelco, Anglo American, and Antofagasta Minerals drive substantial hose procurement for high-volume concentrate pipeline systems, large-scale tailings impoundments, and pit dewatering operations. Copper concentrator modernization and debottlenecking programs create ongoing demand for upgraded slurry transfer systems and process water circulation hoses.
The dominance of copper mining operations creates concentrated demand for high-pressure, abrasion-resistant hoses capable of handling copper concentrate slurries with 50-65% solids content and extended pipeline distances. Molybdenum co-production and lithium mining development in Atacama region provide diversified hose applications beyond copper-focused operations.
Performance Metrics:
Mining market in South Africa focuses on platinum group metals extraction and coal mining operations with specialized hose requirements for deep-level mining conditions and abrasive ore handling at 6.3% CAGR. Established mining companies operating in Bushveld Complex platinum operations and Mpumalanga coal fields drive hose demand through dewatering applications, underground material handling, and mineral processing systems. PGM mining operations by Anglo American Platinum, Impala Platinum, and Northam Platinum require durable hoses for high-pressure dewatering, concentrate slurry transfer, and chemical reagent distribution.
Coal mining operations maintain significant hose demand through pit dewatering, coal preparation plant slurry handling, and water management systems. Mine safety regulations and water conservation requirements drive hose upgrades and systematic replacement programs, while deep-level mining conditions necessitate hoses capable of high-pressure operation and extended service intervals.
Performance Metrics:
Canada maintains steady expansion at 5.8% CAGR through diversified demand from nickel mining, gold extraction, potash production, and oil sands operations across major mining provinces. Ontario and Quebec gold mining operations drive hose demand for deep-level dewatering and tailings management, while nickel mining in Sudbury Basin and Thompson requires specialized hoses for concentrate handling and process water circulation. Saskatchewan potash mining operations utilize large-diameter hoses for brine handling and tailings disposal systems. Oil sands operations in Alberta create substantial demand for high-temperature hoses and chemical-resistant systems for bitumen processing and tailings management.
Tailings management modernization programs and filtered tailings technology adoption drive specialized hose procurement, while remote mining locations emphasize durable systems with extended service intervals and comprehensive cold-weather performance capabilities.
Market Characteristics:
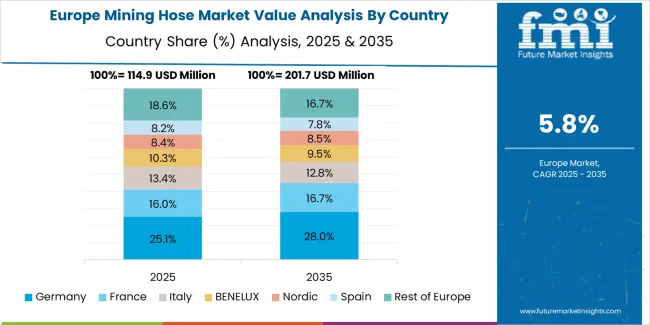
The European mining hose market is projected to grow from USD 128.0 million in 2025 to USD 210.0 million by 2035, registering a CAGR of approximately 5.1% over the forecast period. Germany is expected to lead with a 22.0% market share in 2025, easing to 21.6% by 2035, supported by ongoing quarrying operations, industrial minerals extraction, and process water system upgrades across lignite mining and potash production facilities.
The United Kingdom follows with a 17.0% share in 2025, rising to 17.3% by 2035, driven by aggregates production, slate quarrying operations, and mine water treatment demand across historical mining regions implementing environmental remediation programs. Poland holds a 12.0% share in 2025, inching to 12.2% by 2035, led by coal-to-minerals transition works, copper mining operations in Lower Silesian Voivodeship, and lignite mining modernization programs. Sweden stands at 11.0% in 2025, reaching 11.2% by 2035, supported by iron ore mining in Kiruna and Malmberget operations, and battery metals exploration including lithium and rare earth projects in northern regions.
Spain accounts for 10.0% in 2025, reaching 10.2% by 2035, driven by copper mining operations, aggregates production, and industrial minerals extraction across Andalusia and Castile regions. France holds 9.0% in 2025, expanding to 9.1% by 2035, supported by industrial minerals production, limestone quarrying, and salt mining operations. Italy maintains 8.0% in 2025, rising to 8.1% by 2035, driven by marble quarrying modernization, industrial minerals extraction, and aggregates production supporting construction demand. The Rest of Europe region accounts for 11.0% in 2025, adjusting to 10.3% by 2035, reflecting steady adoption across Central and Eastern European mining expansions, Balkan mineral extraction projects, and mine water handling system upgrades in historical mining regions.
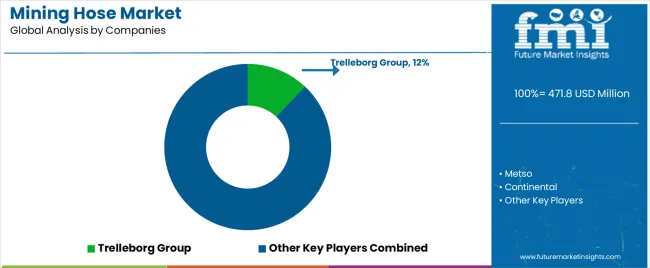
The Mining Hose market operates with moderate concentration, featuring approximately 40-50 meaningful participants, where leading companies control roughly 35-40% of the global market share through established mining industry relationships and comprehensive product portfolios. Competition emphasizes advanced material technology, abrasion resistance capabilities, and pressure rating specifications rather than price-based rivalry. Tier 1 companies including Trelleborg Group, Metso, and Continental collectively command approximately 25-30% market share through their comprehensive mining hose product lines and extensive global industrial distribution presence.
Market Leaders encompass Trelleborg Group (12.0% market share), Metso, and Continental, which maintain competitive advantages through extensive rubber compounding expertise, global manufacturing footprints, and comprehensive pressure rating certifications that create customer confidence and support premium pricing. These companies leverage decades of industrial hose experience and ongoing material development investments to develop advanced mining hoses with superior abrasion resistance and specialized compound formulations.
Technology Innovators include Weir Group PLC, Eaton, and ALFAGOMMA, which compete through focused synthetic rubber technology development and innovative reinforcement systems that appeal to mining companies seeking advanced wear resistance capabilities and extended service life improvements. These companies differentiate through rapid product development cycles and specialized mining application focus.
Regional Specialists feature companies with specific geographic market focus and specialized applications, including high-pressure systems, slurry transfer configurations, and chemical-resistant formulations. Market dynamics favor participants that combine proven material compounds with advanced reinforcement designs, including textile braid reinforcement and spiral wire constructions for high-pressure applications. Competitive pressure intensifies as traditional industrial hose manufacturers expand into specialized mining hose systems.
| Item | Value |
|---|---|
| Quantitative Units (2025) | USD 471.8 million |
| Material Type | Synthetic Rubber (Polyurethane, Nitrile Rubber, Styrene-Butadiene Rubber, Others), Natural Rubber |
| Transporting Media | Industrial Water/Alkali, Slurry, Bulk Water |
| Application | Slurry Transport, Dewatering, Dust Suppression, Process Water/Chemical Transfer |
| Pressure Rating | Low Pressure (<150 PSI), Medium Pressure (150-300 PSI), High Pressure (>300 PSI) |
| Regions Covered | Asia Pacific, North America, Europe, Latin America, Africa, Middle East |
| Countries Covered | China, India, Australia, United States, Canada, Chile, South Africa, Germany, United Kingdom, Poland, Sweden, Spain, France, Italy, and 20+ additional countries |
| Key Companies Profiled | Trelleborg Group, Metso, Continental, Weir Group PLC, Eaton, ALFAGOMMA, Novaflex Group, TESS, Goodall, Hose Solutions Inc. |
| Additional Attributes | Dollar sales by material type, transporting media, application categories, and pressure rating specifications, regional adoption trends across Asia Pacific, North America, and Europe, competitive landscape with hose manufacturers and industrial distributors, mining operator preferences for abrasion resistance and service life optimization, integration with dewatering platforms and slurry pumping systems, innovations in synthetic rubber compounds and reinforcement configurations, and development of high-pressure solutions with enhanced durability and mining application capabilities. |
The global mining hose market is estimated to be valued at USD 471.8 million in 2025.
The market size for the mining hose market is projected to reach USD 894.0 million by 2035.
The mining hose market is expected to grow at a 6.6% CAGR between 2025 and 2035.
The key product types in mining hose market are synthetic rubber and natural rubber.
In terms of application, slurry transport segment to command 38.0% share in the mining hose market in 2025.


Full Research Suite comprises of:
Market outlook & trends analysis
Interviews & case studies
Strategic recommendations
Vendor profiles & capabilities analysis
5-year forecasts
8 regions and 60+ country-level data splits
Market segment data splits
12 months of continuous data updates
DELIVERED AS:
PDF EXCEL ONLINE
Mining Remanufacturing Component Market Forecast Outlook 2025 to 2035
Mining Equipment Industry Analysis in Latin America Size and Share Forecast Outlook 2025 to 2035
Mining Tester Market Size and Share Forecast Outlook 2025 to 2035
Mining Lubricant Market Size and Share Forecast Outlook 2025 to 2035
Mining Pneumatic Saw Market Size and Share Forecast Outlook 2025 to 2035
Mining Drilling Service Market Size and Share Forecast Outlook 2025 to 2035
Mining Trucks Market Size and Share Forecast Outlook 2025 to 2035
Mining Dump Trucks Market Size and Share Forecast Outlook 2025 to 2035
Mining Shovel Market Analysis - Size, Share, and Forecast Outlook 2025 to 2035
Mining Flotation Chemicals Market Size, Growth, and Forecast 2025 to 2035
Mining Drill Market Growth – Trends & Forecast 2025 to 2035
Mining Explosives Consumables Market Growth – Trends & Forecast 2025 to 2035
Mining & Construction Drilling Tools Market Growth – Trends & Forecast 2024-2034
Mining Locomotive Market
Mining Vehicle AC Kits Market
Mining Collectors Market Size & Demand 2022 to 2032
Demining Tool Kits Market Size and Share Forecast Outlook 2025 to 2035
Lead Mining Software Market Size and Share Forecast Outlook 2025 to 2035
Large Mining Shovel Market Size and Share Forecast Outlook 2025 to 2035
Smart Mining Market Analysis by Automated Equipment, Component, Solution, Services, and Region through 2035

Thank you!
You will receive an email from our Business Development Manager. Please be sure to check your SPAM/JUNK folder too.
Chat With
MaRIA