The Lead Mining Software Market is estimated to be valued at USD 2.0 billion in 2025 and is projected to reach USD 13.8 billion by 2035, registering a compound annual growth rate (CAGR) of 21.5% over the forecast period.
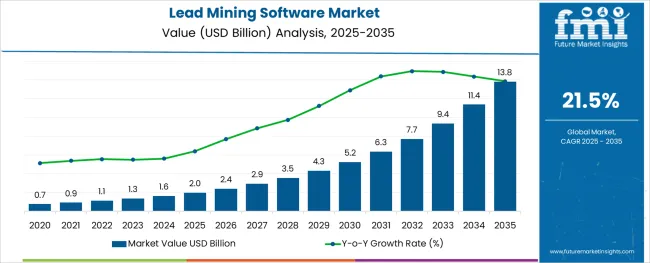
The lead mining software market has been steadily expanding as businesses prioritize data-driven strategies for optimizing lead generation, scoring, and conversion workflows. Rising demand for actionable customer intelligence, along with increasing competition in B2B and B2C sectors, has necessitated the adoption of advanced software platforms capable of identifying high-potential prospects and refining outreach strategies.
Market momentum is further supported by the growing complexity of customer journeys, which has heightened the need for integrated lead management tools that enhance sales pipeline visibility and operational efficiency. In the near future, the market outlook remains positive as organizations continue to invest in analytics-driven marketing automation tools and AI-powered lead scoring solutions.
Additionally, heightened emphasis on regulatory compliance and data security has prompted enterprises to deploy secure, scalable lead mining platforms tailored to specific operational needs. The ability of these solutions to improve lead qualification accuracy, reduce acquisition costs, and accelerate conversion rates positions the market for consistent growth, particularly as digital transformation initiatives expand across industries globally.
The market is segmented by Type and Application and region. By Type, the market is divided into On-Premises and Cloud-based. In terms of Application, the market is classified into Large Enterprises and SMEs. Regionally, the market is classified into North America, Latin America, Western Europe, Eastern Europe, Balkan & Baltic Countries, Russia & Belarus, Central Asia, East Asia, South Asia & Pacific, and the Middle East & Africa.
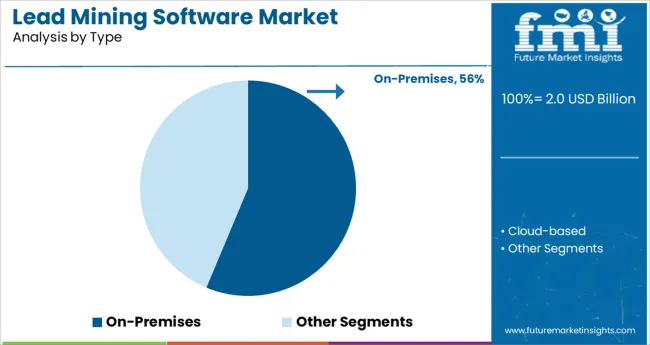
The on-premises segment held a dominant 56.3% market share in the lead mining software market, sustained by its robust demand from enterprises requiring high levels of data security, operational control, and system customization.
The preference for on-premises deployments has been notably strong among industries handling sensitive customer data, where regulatory requirements necessitate stringent data governance and localized infrastructure. This deployment model allows organizations to retain full authority over data storage, system maintenance, and software customization, making it a preferred option for entities wary of potential vulnerabilities associated with cloud-based platforms.
While cloud adoption has witnessed notable growth, the on-premises segment has maintained its leadership position due to its ability to support complex integration needs and bespoke operational frameworks. Moreover, large enterprises with established IT infrastructure continue to favor on-premises solutions for their scalability and capacity to manage large, diverse lead databases. The segment’s sustained performance is expected to persist as demand for secure, flexible, and customizable lead mining platforms remains prevalent across regulated sectors.
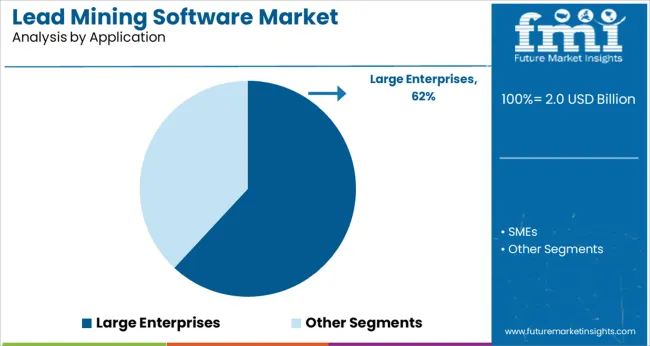
In the application category, the large enterprises segment commanded a substantial 61.9% market share, reflecting its consistent investment in sophisticated lead mining software solutions to manage high-volume, multi-channel lead generation and qualification processes.
Large enterprises have demonstrated a clear preference for feature-rich platforms that offer advanced analytics, AI-enabled lead scoring, and seamless integration with existing CRM and marketing automation systems. This market dominance is attributed to the critical need for these organizations to enhance conversion rates, optimize customer acquisition strategies, and ensure efficient sales pipeline management across diverse business units and geographies.
Additionally, the complexity of customer data management within large enterprises has driven demand for scalable software solutions capable of supporting extensive lead databases and delivering actionable insights in real time. The segment’s continued leadership is expected to be reinforced by ongoing digital transformation initiatives and the growing emphasis on data-driven decision-making. Future growth prospects remain favorable as enterprises prioritize solutions that offer operational agility, secure data management, and measurable ROI within increasingly competitive market environments.
Due to the ease of use and the rising popularity of mining software, the demand for lead mining software is anticipated to rise during the forecast period.
Businesses collect data on potential clients in order to adjust marketing strategies and sales pitches to their individual needs. Lead mining software makes the sales cycle more capable and increases the success rate of new customer acquisition. Due to this factor, the sales of lead mining software are rising rapidly.
The sales of lead mining software are further rising as lead scoring allows marketing and sales teams to focus on the most promising prospects rather than nurturing them all equally. An organization conducts a meaningful review of potential customers using a combination of implicit and explicit lead scoring. This is one of the factors driving the demand for lead mining software.
During the forecast period, the lead mining software market is expected to rise due to the rising demand for lead mining software across various sectors. The implicit lead score considers how frequently and how a potential lead interacts with the company.
The sales of lead mining software are projected to rise due to the availability of indicators such as email marketing or website visits that can be used to determine implicit lead scoring. It provides comprehensive information on a potential lead's level of interest in the firm.
The demand for lead mining software is projected to rise as explicit lead score measures how closely a lead's profile matches the buyer persona of the ideal customer. A buyer persona is made by enticing potential customers in a variety of ways, building relationships, and deciding whether leads are ready to move forward in the purchasing process. These factors are responsible for increased sales of lead mining software.
As lead management software covers the complete process from lead generation to gathering insights on leads and leads scoring to develop a full list of leads, lead mining software is widely used for lead management.
Lead creation offers them effective lead scoring and account-level insights, allowing them to better their prospecting methods, which is another reason that contributes to the growth of lead mining software market share.
The demand for lead mining software is increasing owing to the software's ability to interact with current systems, such as Customer Relationship Management (CRM) and marketing platforms, in order to enable excellent data enrichment and different deployment options.
Advanced capabilities of lead mining software, such as lead management, data management, analytics, and reporting, as well as messaging and alerting, are driving the sales of lead mining software.
By type, the cloud-based segment is anticipated to dominate the lead mining software market with a CAGR of 21.2%. Data security has always been an issue with cloud-based software that has yet to be addressed.
Cloud-based lead mining software is utilized to manage the entire customer lifecycle, from lead capture through conversion, while also providing the sales team with high-level value and qualified opportunities.
By application, the large enterprise segment is forecasted to dominate the lead mining software market with a CAGR of 21.0%. Due to increased competitiveness and rising rates of data deterioration, large organizations are rapidly adopting lead mining software.
With data enrichment features, lead mining software can help organizations reduce data inaccuracies and preserve a competitive advantage. Furthermore, as large businesses' technology proficiency grows, they are more compelled to use lead mining software to improve sales efficiency and shorten sales cycles.
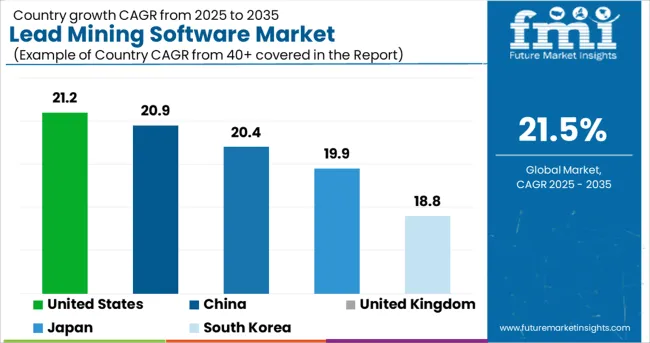
| Regions | CAGR (2025 to 2035) |
|---|---|
| United States Market | 21.2% |
| United Kingdom Market | 20.4% |
| China Market | 20.9% |
| Japan Market | 19.9% |
| South Korea Market | 18.8% |
As a key hub for technological advancements and an early adopter of new technologies, North America is a big contributor, with the highest share in the lead mining software market. Customers in the region are being served with best-in-class lead generation services, ensuring that they are engaged at the right moment with relevant content and assets.
Consumer buying behavior has changed dramatically as a result of increased Internet, communication devices, and mobile penetration, and it is critical to approach customers with the correct content to remain competitive. The goal of lead mining software is to assist a company in connecting with high-potential prospects, enhancing conversions, and closing high-value deals.
The presence of big businesses in the region also helps to fuel demand for lead mining software and raises knowledge about the advantages of using lead mining software. Sales enablement bridges the gap between sales and marketing, allowing businesses in the North American region to create more market opportunities.
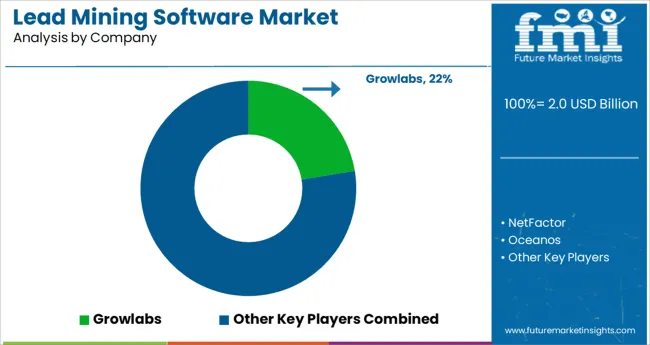
Growlabs, NetFactor, Oceanos, KickFire, Socedo, Prospect. oi, LeadGibbon, LeadGnome, AeroLeads, and BuiltWith are some of the major players in the lead mining software market.
With the presence of numerous well-established large firms and regional vendors, the market is becoming fairly concentrated as it continues to grow. The key players in the lead mining software market are working to develop cutting-edge innovation methods and expand their product portfolios in order to reach out to potential clients in emerging countries.
New product development and product innovation are two of the most important strategies used by lead mining software market participants.
Recent Developments in the Lead Mining Software Market
The global lead mining software market is estimated to be valued at USD 2.0 billion in 2025.
It is projected to reach USD 13.8 billion by 2035.
The market is expected to grow at a 21.5% CAGR between 2025 and 2035.
The key product types are on-premises and cloud-based.
large enterprises segment is expected to dominate with a 61.9% industry share in 2025.


Our Research Products

The "Full Research Suite" delivers actionable market intel, deep dives on markets or technologies, so clients act faster, cut risk, and unlock growth.

The Leaderboard benchmarks and ranks top vendors, classifying them as Established Leaders, Leading Challengers, or Disruptors & Challengers.

Locates where complements amplify value and substitutes erode it, forecasting net impact by horizon

We deliver granular, decision-grade intel: market sizing, 5-year forecasts, pricing, adoption, usage, revenue, and operational KPIs—plus competitor tracking, regulation, and value chains—across 60 countries broadly.

Spot the shifts before they hit your P&L. We track inflection points, adoption curves, pricing moves, and ecosystem plays to show where demand is heading, why it is changing, and what to do next across high-growth markets and disruptive tech

Real-time reads of user behavior. We track shifting priorities, perceptions of today’s and next-gen services, and provider experience, then pace how fast tech moves from trial to adoption, blending buyer, consumer, and channel inputs with social signals (#WhySwitch, #UX).

Partner with our analyst team to build a custom report designed around your business priorities. From analysing market trends to assessing competitors or crafting bespoke datasets, we tailor insights to your needs.
Supplier Intelligence
Discovery & Profiling
Capacity & Footprint
Performance & Risk
Compliance & Governance
Commercial Readiness
Who Supplies Whom
Scorecards & Shortlists
Playbooks & Docs
Category Intelligence
Definition & Scope
Demand & Use Cases
Cost Drivers
Market Structure
Supply Chain Map
Trade & Policy
Operating Norms
Deliverables
Buyer Intelligence
Account Basics
Spend & Scope
Procurement Model
Vendor Requirements
Terms & Policies
Entry Strategy
Pain Points & Triggers
Outputs
Pricing Analysis
Benchmarks
Trends
Should-Cost
Indexation
Landed Cost
Commercial Terms
Deliverables
Brand Analysis
Positioning & Value Prop
Share & Presence
Customer Evidence
Go-to-Market
Digital & Reputation
Compliance & Trust
KPIs & Gaps
Outputs
Full Research Suite comprises of:
Market outlook & trends analysis
Interviews & case studies
Strategic recommendations
Vendor profiles & capabilities analysis
5-year forecasts
8 regions and 60+ country-level data splits
Market segment data splits
12 months of continuous data updates
DELIVERED AS:
PDF EXCEL ONLINE
Lead-free Brass Rods Market Size and Share Forecast Outlook 2025 to 2035
Lead Acid Battery Market Size and Share Forecast Outlook 2025 to 2035
Lead Acid Battery Recycling Market Size and Share Forecast Outlook 2025 to 2035
Lead Smelting and Refining Market Size and Share Forecast Outlook 2025 to 2035
Lead Management Market Size and Share Forecast Outlook 2025 to 2035
Leadership Development Program Market Analysis - Size, Share, and Forecast 2025 to 2035
Lead Market Growth - Trends & Forecast 2025 to 2035
Examining Market Share Trends in Leadership Development Programs
Lead Zirconate Titanate Market Size & Trends 2025
Lead Stearate Market
Leadscrew Market
Lead Capture Software Market Size and Share Forecast Outlook 2025 to 2035
Lead Scoring Software Market Size and Share Forecast Outlook 2025 to 2035
Lead Intelligence Software Market Size and Share Forecast Outlook 2025 to 2035
Lead-to-Account Matching and Routing Software Market Size and Share Forecast Outlook 2025 to 2035
KNN Lead-free Piezoelectric Ceramics Market Size and Share Forecast Outlook 2025 to 2035
BNT Lead-free Piezoelectric Ceramics Market Size and Share Forecast Outlook 2025 to 2035
Online Leadership Development Program Market Forecast and Outlook 2025 to 2035
Custom Leadership Development Program Market Growth, Trends and Forecast from 2025 to 2035
Europe Leadership Development Program Market - Growth & Demand 2025 to 2035

Thank you!
You will receive an email from our Business Development Manager. Please be sure to check your SPAM/JUNK folder too.
Chat With
MaRIA