Lead Market Outlook 2025 to 2035

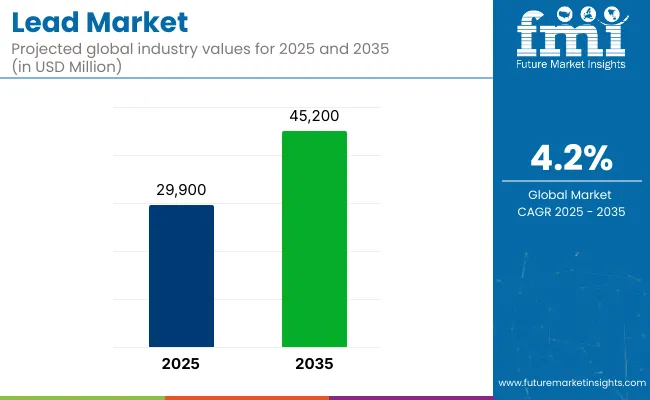
The global lead market is estimated to be valued at USD 29,900 million in 2025 and is forecast to reach USD 45,200 million by 2035, registering a compound annual growth rate of 4.2% during the forecast period.
Quick Stats for the Global Lead Market:

  • Industry Value (2025): USD 29,900 million
  • Forecast Value (2035): USD 45,200 million
  • Forecast CAGR: 4.2%
  • Leading Segment in 2025: Battery Manufacturing (58%)
  • Key Growth Region: Asia-Pacific (China and India leading in production and demand)
  • Top Key Players: Glencore International AG, Hindustan Zinc Ltd., Vedanta Resources Limited, Korea Zinc Co., Ltd., China Minmetals Corporation

Lead Market

Growth in the lead market is being influenced by the global shift toward energy security and electrification, with rising investments in renewable energy and electric vehicle infrastructure. In this context, lead-acid batteries are being retained as a preferred energy storage solution in developing economies due to their recycling potential and existing infrastructure compatibility.

A large portion of the global refined lead supply, estimated to exceed 85 percent, is being sourced from secondary production routes, reducing dependency on primary mining and aligning with sustainability mandates.

Environmental compliance and occupational safety standards are imposing stricter controls on lead smelting and battery handling operations, especially in regions such as North America and Western Europe.

These regions are witnessing modernization of production facilities and the integration of closed-loop recycling systems to minimize emissions and material losses. In contrast, capacity expansions for both primary and secondary lead production are being undertaken in Asia Pacific, particularly in China and India, where demand is reinforced by infrastructure development and industrial battery requirements.

Applications in radiation protection for healthcare and nuclear facilities, along with continued use in ammunition and specialty alloys, are supporting stable demand across strategic sectors. While regulatory frameworks have phased out lead from paints, fuels, and other consumer-facing applications, industrial use cases remain resilient.

Compliance with EPR mandates is driving efforts to enhance traceability and modernize supply chains. Capital is being allocated toward battery recycling innovation and digital infrastructure to improve material recovery rates. Competitive focus is shifting toward low-impact operations and regional self-sufficiency in refined lead supply.

Substitutes such as lithium, zinc, and tin are being explored in battery chemistries, shielding, and alloys to reduce dependence on lead, especially in regions with stringent environmental and health regulations.

Analyzing Global Lead Market by Top Investing Segments

Battery manufacturing continues to drive the majority of demand across global lead consumption

The battery application segment is projected to account for approximately 58% of the global lead market share in 2025 and is expected to grow at a CAGR of 4.3% through 2035. Lead-acid batteries remain the primary application, widely used in automotive starting, lighting, and ignition (SLI) systems, uninterruptible power supplies (UPS), electric bikes, and industrial energy storage.

As vehicle electrification and backup power systems expand globally, particularly in emerging economies, demand for lead-acid batteries continues to rise. Recycling infrastructure is also well-developed in this segment, enabling sustainable sourcing of secondary lead, which supports cost efficiency and supply continuity for battery manufacturers.
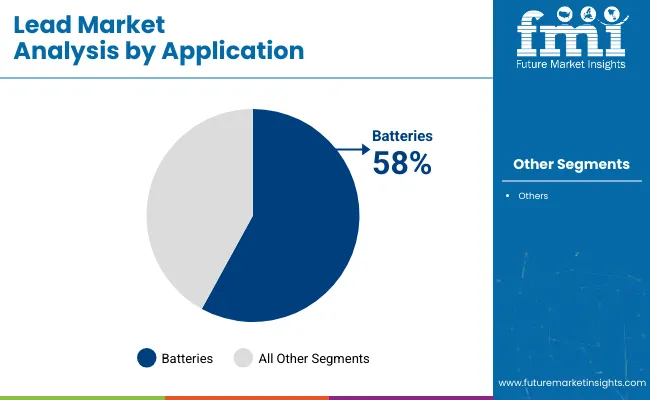
Lead Market By Application

Lead 206 is expected to retain a dominant role due to its purity and suitability for electrochemical applications

Lead 206 is estimated to hold approximately 62% of the global lead market share in 2025 and is projected to grow at a CAGR of 4.1% through 2035. This isotope, characterized by its stable molecular structure and refined purity, is commonly used in high-precision alloys and in lead-acid battery electrodes due to its superior electrical conductivity and corrosion resistance.

As industrial standards shift toward more consistent material performance, the use of Lead 206 in grid manufacturing and radiation shielding is expected to continue. Its adoption remains strongest in energy storage, telecommunications infrastructure, and medical shielding components, where purity and reliability are essential.
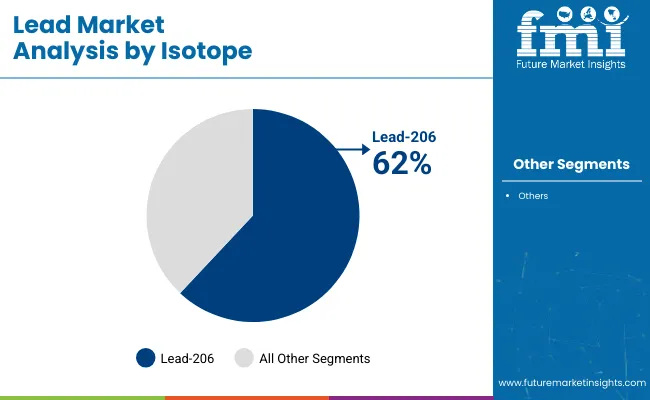
Lead Market By Isotope

Challenges and Opportunities

Challenge

Supply Chain Disruptions and Resource Constraints

Mining restrictions, supply chain inefficiencies, and resource depletion are some of the issues plaguing the lead market. The volatility in the availability of raw materials for lead, along with stringent environmental regulations concerning lead mining and processing, has driven up operational costs for lead manufacturers.

Moreover, the influence of geopolitics, and limitations on trade impact the free procession of lead across the world market. To address such obstacles, firms have to allocate capital in effective distribution channels, sustainable material acquisition practices, and alternative lead extraction methods.

Environmental and Health Concerns

One of the biggest threats to industry comes from the growing awareness of the toxic effects of lead exposure. Strict legislation on lead use in paints, batteries, and industrial applications further limits market growth. Environmental concerns stemming from lead contamination and poor recycling also affect production. In order for this response to be effective, companies must begin to implement lead recycling initiatives, meet environmental safety standards, and produce lead-free alternatives.

Opportunity

Rising Demand for Lead-Acid Batteries

Widespread adoption of lead-acid batteries across automotive, industrial, and renewable energy applications The demand for lead-acid battery has been driven by the growing deployment of electric vehicles (EVs), uninterrupted power supply (UPS) systems, and grid energy storage systems. Furthermore, businesses that focus on the development of innovative battery technologies, recycling solutions, and sustainable manufacturing processes will be better positioned to thrive in this rapidly changing industry.

Technological Innovations in Lead Recycling

Lead acid batteries are one of the most recycled products globally, with well-established recycling technologies in place. This trend of adopting efficient lead recovery processes, is driven by the increasing importance placed on circular economy principles in industry. Advanced recycling technologies, automated processing plants, and green refining processes can hold the key to improved profitability, within regulatory limits to which the sector typically adheres.
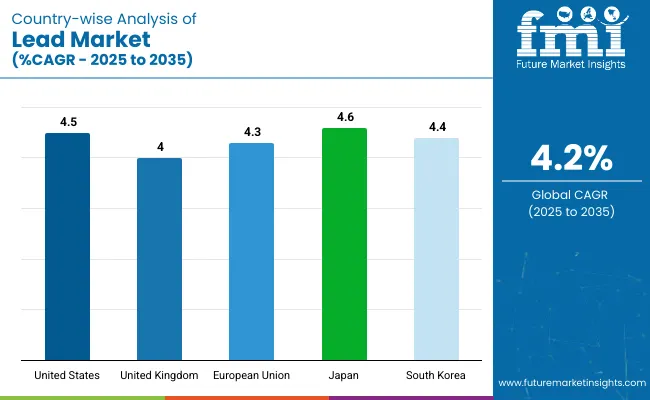
Country-wise Outlook-Lead market

Lead Market Country Wise

United States

The demand for lead in battery production is driving the USA lead market due to the growing demand in automotive and industrial applications. Increasing usage of lead-acid batteries in renewable energy applications is one of the most important driving forces towards the growth of the market.

Moreover, growing investments in recycling programs, along with government regulation encouraging sustainable lead use, are driving the market dynamics. Infrastructure projects are expanding and driving up lead demand as is the construction industry.

Country CAGR (2025 to 2035)
USA 4.5%

United Kingdom

The UK lead market continues to grow steadily owing to the development of battery & technology as well as growing use in the healthcare, telecom & other industry. Increasing electric vehicle (EV) charging infrastructure and backup power system demand is driving the need for lead-based energy systems.

Moreover, stringent environmental regulations are driving investments in lead recycling and sustainable sourcing practices, further driving market growth.

Country CAGR (2025 to 2035)
UK 4.0%

European Union

Some of the factors driving the market include surging demand in automotive, energy storage and industrial sectors. Demand for lead-acid batteries is propelled as Germany, France, and Italy are focusing on sustainable battery technologies.

At the same time, the European Union’s circular economy efforts are prioritizing lead recycling, lessening reliance on raw material extraction. Additionally, the growth of the market can be attributed to the significant utilization of lead for protective shielding from exposure to radiation, especially in the medical sector.

Country CAGR (2025 to 2035)
European Union (EU) 4.3%

Japan

The need for energy storage solutions resulting in adoption of energy efficient solutions is driving the core market of Japan. A focus in the country on research and development of battery technologies, including hybrid and electric vehicles, is spurring lead demand.

Also, the trend in market prevailing is being impacted as the medical industry to rely on lead for shielding against radiation in diagnostic imaging equipment. Rising demand for lead-acid batteries in backup power systems, such as those for data centers and communication networks, is also fueling demand.

Country CAGR (2025 to 2035)
Japan 4.6%

South Korea

They are primarily driven in the South Korean market for the growing electronics and energy storage industries. Growing adoption of UPS (uninterruptible power supply) systems in commercial buildings, data centers, and industrial facilities is a key growth driver.

Another example of how trends and market forces are being influenced is through the government’s push toward battery recycling initiatives and eco-friendly lead production processes. Demand is also being bolstered by the incorporation of lead into protective coatings and specialized building materials.

Country CAGR (2025 to 2035)
South Korea 4.4%

Competitive Outlook

The global lead market is moderately fragmented, with a strong presence of integrated producers that control both mining and recycling assets. Key players are focusing on sustainable practices and investing in eco-friendly smelting, battery recycling plants, and emission control technologies to comply with tightening regulations. Asia-Pacific remains the epicenter of production and consumption, with China leading in both primary and secondary lead production.

Market participants are entering into long-term contracts with battery OEMs and infrastructure developers to secure consistent demand. The emergence of ESG-focused investors is reshaping the industry, prompting transparency in sourcing and production practices. As the circular economy gains momentum, companies capable of offering closed-loop solutions from scrap collection to refined lead delivery will enjoy a competitive edge.

  • May 2024 Glencore announced an expansion of its lead recycling capacity in Europe by upgrading its Nordenham facility in Germany to process higher volumes of used lead-acid batteries. The move aligns with EU circular economy goals and rising demand for secondary lead.
  • March 2024 Vedanta's Hindustan Zinc subsidiary commissioned a new lead smelter in Rajasthan, India, aimed at increasing annual refined lead production capacity by 30%. The plant uses waste heat recovery and emission control systems to reduce environmental impact.

Companies

  • Glencore International AG
  • Korea Zinc Co., Ltd.
  • Teck Resources Limited
  • Hindustan Zinc Ltd.
  • Doe Run Company
  • China Minmetals Corporation
  • Vedanta Resources Limited
  • Henan Yuguang Gold & Lead Co., Ltd.
  • Mitsubishi Materials Corporation
  • Gravita India Ltd.

Key Segments

By Application:

  • Ammunition
  • Batteries
  • Construction
  • Electronics
  • Marine
  • Plumbing
  • Others

By Isotope:

  • Lead-204
  • Lead-207
  • Lead-208
  • Lead-206

By Region:

  • North America
  • Latin America
  • East Asia
  • South Asia & Pacific
  • Eastern Europe
  • Western Europe
  • Middle East & Africa

Table of Content

  1. Executive Summary
  2. Industry Introduction, including Taxonomy and Market Definition
  3. Market Trends and Success Factors, including Macro-economic Factors, Market Dynamics, and Recent Industry Developments
  4. Market Demand Analysis 2020 to 2024 and Forecast 2025 to 2035, including Historical Analysis and Future Projections
  5. Pricing Analysis
  6. Market Analysis 2020 to 2024 and Forecast 2025 to 2035
    • By Application
    • By Isotope
  7. Market Analysis 2020 to 2024 and Forecast 2025 to 2035, By Application
    • Ammunition
    • Batteries
    • Construction
    • Electronics
    • Marine
    • Plumbing
    • Others
  8. Market Analysis 2020 to 2024 and Forecast 2025 to 2035, By Isotope
    • Lead-204
    • Lead-207
    • Lead-208
    • Lead-206
  9. Market Analysis 2020 to 2024 and Forecast 2025 to 2035, By Region
    • North America
    • Latin America
    • East Asia
    • South Asia & Pacific
    • Eastern Europe
    • Western Europe
    • Middle East & Africa
  10. North America Sales Analysis 2020 to 2024 and Forecast 2025 to 2035, by Key Segments and Countries
  11. Latin America Sales Analysis 2020 to 2024 and Forecast 2025 to 2035, by Key Segments and Countries
  12. East Asia Sales Analysis 2020 to 2024 and Forecast 2025 to 2035, by Key Segments and Countries
  13. South Asia & Pacific Sales Analysis 2020 to 2024 and Forecast 2025 to 2035, by Key Segments and Countries
  14. Eastern Europe Sales Analysis 2020 to 2024 and Forecast 2025 to 2035, by Key Segments and Countries
  15. Western Europe Sales Analysis 2020 to 2024 and Forecast 2025 to 2035, by Key Segments and Countries
  16. Middle East & Africa Sales Analysis 2020 to 2024 and Forecast 2025 to 2035, by Key Segments and Countries
  17. Sales Forecast 2025 to 2035 by Application and Isotope for 30 Countries
  18. Competition Outlook, including Market Structure Analysis, Company Share Analysis by Key Players, and Competition Dashboard
  19. Company Profile
    • Glencore Xstrata
    • BHP Billiton
    • Vedanta Resources
    • Korea Zinc Group
    • Teck
    • China Minmetals Corporation
    • Hindustan Zinc Limited
    • Nyrstar
    • Nexa Resources S.A.
    • Boliden Group

List of Tables

  • Table 1: Global Market Value (USD Million) Forecast by Region, 2020 to 2035
  • Table 2: Global Market Volume (Tons) Forecast by Region, 2020 to 2035
  • Table 3: Global Market Value (USD Million) Forecast by Application, 2020 to 2035
  • Table 4: Global Market Volume (Tons) Forecast by Application, 2020 to 2035
  • Table 5: Global Market Value (USD Million) Forecast by End Use Industry, 2020 to 2035
  • Table 6: Global Market Volume (Tons) Forecast by End Use Industry, 2020 to 2035
  • Table 7: Global Market Value (USD Million) Forecast by Product Type, 2020 to 2035
  • Table 8: Global Market Volume (Tons) Forecast by Product Type, 2020 to 2035
  • Table 9: North America Market Value (USD Million) Forecast by Country, 2020 to 2035
  • Table 10: North America Market Volume (Tons) Forecast by Country, 2020 to 2035
  • Table 11: North America Market Value (USD Million) Forecast by Application, 2020 to 2035
  • Table 12: North America Market Volume (Tons) Forecast by Application, 2020 to 2035
  • Table 13: North America Market Value (USD Million) Forecast by End Use Industry, 2020 to 2035
  • Table 14: North America Market Volume (Tons) Forecast by End Use Industry, 2020 to 2035
  • Table 15: North America Market Value (USD Million) Forecast by Product Type, 2020 to 2035
  • Table 16: North America Market Volume (Tons) Forecast by Product Type, 2020 to 2035
  • Table 17: Latin America Market Value (USD Million) Forecast by Country, 2020 to 2035
  • Table 18: Latin America Market Volume (Tons) Forecast by Country, 2020 to 2035
  • Table 19: Latin America Market Value (USD Million) Forecast by Application, 2020 to 2035
  • Table 20: Latin America Market Volume (Tons) Forecast by Application, 2020 to 2035
  • Table 21: Latin America Market Value (USD Million) Forecast by End Use Industry, 2020 to 2035
  • Table 22: Latin America Market Volume (Tons) Forecast by End Use Industry, 2020 to 2035
  • Table 23: Latin America Market Value (USD Million) Forecast by Product Type, 2020 to 2035
  • Table 24: Latin America Market Volume (Tons) Forecast by Product Type, 2020 to 2035
  • Table 25: Europe Market Value (USD Million) Forecast by Country, 2020 to 2035
  • Table 26: Europe Market Volume (Tons) Forecast by Country, 2020 to 2035
  • Table 27: Europe Market Value (USD Million) Forecast by Application, 2020 to 2035
  • Table 28: Europe Market Volume (Tons) Forecast by Application, 2020 to 2035
  • Table 29: Europe Market Value (USD Million) Forecast by End Use Industry, 2020 to 2035
  • Table 30: Europe Market Volume (Tons) Forecast by End Use Industry, 2020 to 2035
  • Table 31: Europe Market Value (USD Million) Forecast by Product Type, 2020 to 2035
  • Table 32: Europe Market Volume (Tons) Forecast by Product Type, 2020 to 2035
  • Table 33: East Asia Market Value (USD Million) Forecast by Country, 2020 to 2035
  • Table 34: East Asia Market Volume (Tons) Forecast by Country, 2020 to 2035
  • Table 35: East Asia Market Value (USD Million) Forecast by Application, 2020 to 2035
  • Table 36: East Asia Market Volume (Tons) Forecast by Application, 2020 to 2035
  • Table 37: East Asia Market Value (USD Million) Forecast by End Use Industry, 2020 to 2035
  • Table 38: East Asia Market Volume (Tons) Forecast by End Use Industry, 2020 to 2035
  • Table 39: East Asia Market Value (USD Million) Forecast by Product Type, 2020 to 2035
  • Table 40: East Asia Market Volume (Tons) Forecast by Product Type, 2020 to 2035
  • Table 41: South Asia & Pacific Market Value (USD Million) Forecast by Country, 2020 to 2035
  • Table 42: South Asia & Pacific Market Volume (Tons) Forecast by Country, 2020 to 2035
  • Table 43: South Asia & Pacific Market Value (USD Million) Forecast by Application, 2020 to 2035
  • Table 44: South Asia & Pacific Market Volume (Tons) Forecast by Application, 2020 to 2035
  • Table 45: South Asia & Pacific Market Value (USD Million) Forecast by End Use Industry, 2020 to 2035
  • Table 46: South Asia & Pacific Market Volume (Tons) Forecast by End Use Industry, 2020 to 2035
  • Table 47: South Asia & Pacific Market Value (USD Million) Forecast by Product Type, 2020 to 2035
  • Table 48: South Asia & Pacific Market Volume (Tons) Forecast by Product Type, 2020 to 2035
  • Table 49: MEA Market Value (USD Million) Forecast by Country, 2020 to 2035
  • Table 50: MEA Market Volume (Tons) Forecast by Country, 2020 to 2035
  • Table 51: MEA Market Value (USD Million) Forecast by Application, 2020 to 2035
  • Table 52: MEA Market Volume (Tons) Forecast by Application, 2020 to 2035
  • Table 53: MEA Market Value (USD Million) Forecast by End Use Industry, 2020 to 2035
  • Table 54: MEA Market Volume (Tons) Forecast by End Use Industry, 2020 to 2035
  • Table 55: MEA Market Value (USD Million) Forecast by Product Type, 2020 to 2035
  • Table 56: MEA Market Volume (Tons) Forecast by Product Type, 2020 to 2035

List of Figures

  • Figure 1: Global Market Value (USD Million) by Application, 2025 to 2035
  • Figure 2: Global Market Value (USD Million) by End Use Industry, 2025 to 2035
  • Figure 3: Global Market Value (USD Million) by Product Type, 2025 to 2035
  • Figure 4: Global Market Value (USD Million) by Region, 2025 to 2035
  • Figure 5: Global Market Value (USD Million) Analysis by Region, 2020 to 2035
  • Figure 6: Global Market Volume (Tons) Analysis by Region, 2020 to 2035
  • Figure 7: Global Market Value Share (%) and BPS Analysis by Region, 2025 to 2035
  • Figure 8: Global Market Y-o-Y Growth (%) Projections by Region, 2025 to 2035
  • Figure 9: Global Market Value (USD Million) Analysis by Application, 2020 to 2035
  • Figure 10: Global Market Volume (Tons) Analysis by Application, 2020 to 2035
  • Figure 11: Global Market Value Share (%) and BPS Analysis by Application, 2025 to 2035
  • Figure 12: Global Market Y-o-Y Growth (%) Projections by Application, 2025 to 2035
  • Figure 13: Global Market Value (USD Million) Analysis by End Use Industry, 2020 to 2035
  • Figure 14: Global Market Volume (Tons) Analysis by End Use Industry, 2020 to 2035
  • Figure 15: Global Market Value Share (%) and BPS Analysis by End Use Industry, 2025 to 2035
  • Figure 16: Global Market Y-o-Y Growth (%) Projections by End Use Industry, 2025 to 2035
  • Figure 17: Global Market Value (USD Million) Analysis by Product Type, 2020 to 2035
  • Figure 18: Global Market Volume (Tons) Analysis by Product Type, 2020 to 2035
  • Figure 19: Global Market Value Share (%) and BPS Analysis by Product Type, 2025 to 2035
  • Figure 20: Global Market Y-o-Y Growth (%) Projections by Product Type, 2025 to 2035
  • Figure 21: Global Market Attractiveness by Application, 2025 to 2035
  • Figure 22: Global Market Attractiveness by End Use Industry, 2025 to 2035
  • Figure 23: Global Market Attractiveness by Product Type, 2025 to 2035
  • Figure 24: Global Market Attractiveness by Region, 2025 to 2035
  • Figure 25: North America Market Value (USD Million) by Application, 2025 to 2035
  • Figure 26: North America Market Value (USD Million) by End Use Industry, 2025 to 2035
  • Figure 27: North America Market Value (USD Million) by Product Type, 2025 to 2035
  • Figure 28: North America Market Value (USD Million) by Country, 2025 to 2035
  • Figure 29: North America Market Value (USD Million) Analysis by Country, 2020 to 2035
  • Figure 30: North America Market Volume (Tons) Analysis by Country, 2020 to 2035
  • Figure 31: North America Market Value Share (%) and BPS Analysis by Country, 2025 to 2035
  • Figure 32: North America Market Y-o-Y Growth (%) Projections by Country, 2025 to 2035
  • Figure 33: North America Market Value (USD Million) Analysis by Application, 2020 to 2035
  • Figure 34: North America Market Volume (Tons) Analysis by Application, 2020 to 2035
  • Figure 35: North America Market Value Share (%) and BPS Analysis by Application, 2025 to 2035
  • Figure 36: North America Market Y-o-Y Growth (%) Projections by Application, 2025 to 2035
  • Figure 37: North America Market Value (USD Million) Analysis by End Use Industry, 2020 to 2035
  • Figure 38: North America Market Volume (Tons) Analysis by End Use Industry, 2020 to 2035
  • Figure 39: North America Market Value Share (%) and BPS Analysis by End Use Industry, 2025 to 2035
  • Figure 40: North America Market Y-o-Y Growth (%) Projections by End Use Industry, 2025 to 2035
  • Figure 41: North America Market Value (USD Million) Analysis by Product Type, 2020 to 2035
  • Figure 42: North America Market Volume (Tons) Analysis by Product Type, 2020 to 2035
  • Figure 43: North America Market Value Share (%) and BPS Analysis by Product Type, 2025 to 2035
  • Figure 44: North America Market Y-o-Y Growth (%) Projections by Product Type, 2025 to 2035
  • Figure 45: North America Market Attractiveness by Application, 2025 to 2035
  • Figure 46: North America Market Attractiveness by End Use Industry, 2025 to 2035
  • Figure 47: North America Market Attractiveness by Product Type, 2025 to 2035
  • Figure 48: North America Market Attractiveness by Country, 2025 to 2035
  • Figure 49: Latin America Market Value (USD Million) by Application, 2025 to 2035
  • Figure 50: Latin America Market Value (USD Million) by End Use Industry, 2025 to 2035
  • Figure 51: Latin America Market Value (USD Million) by Product Type, 2025 to 2035
  • Figure 52: Latin America Market Value (USD Million) by Country, 2025 to 2035
  • Figure 53: Latin America Market Value (USD Million) Analysis by Country, 2020 to 2035
  • Figure 54: Latin America Market Volume (Tons) Analysis by Country, 2020 to 2035
  • Figure 55: Latin America Market Value Share (%) and BPS Analysis by Country, 2025 to 2035
  • Figure 56: Latin America Market Y-o-Y Growth (%) Projections by Country, 2025 to 2035
  • Figure 57: Latin America Market Value (USD Million) Analysis by Application, 2020 to 2035
  • Figure 58: Latin America Market Volume (Tons) Analysis by Application, 2020 to 2035
  • Figure 59: Latin America Market Value Share (%) and BPS Analysis by Application, 2025 to 2035
  • Figure 60: Latin America Market Y-o-Y Growth (%) Projections by Application, 2025 to 2035
  • Figure 61: Latin America Market Value (USD Million) Analysis by End Use Industry, 2020 to 2035
  • Figure 62: Latin America Market Volume (Tons) Analysis by End Use Industry, 2020 to 2035
  • Figure 63: Latin America Market Value Share (%) and BPS Analysis by End Use Industry, 2025 to 2035
  • Figure 64: Latin America Market Y-o-Y Growth (%) Projections by End Use Industry, 2025 to 2035
  • Figure 65: Latin America Market Value (USD Million) Analysis by Product Type, 2020 to 2035
  • Figure 66: Latin America Market Volume (Tons) Analysis by Product Type, 2020 to 2035
  • Figure 67: Latin America Market Value Share (%) and BPS Analysis by Product Type, 2025 to 2035
  • Figure 68: Latin America Market Y-o-Y Growth (%) Projections by Product Type, 2025 to 2035
  • Figure 69: Latin America Market Attractiveness by Application, 2025 to 2035
  • Figure 70: Latin America Market Attractiveness by End Use Industry, 2025 to 2035
  • Figure 71: Latin America Market Attractiveness by Product Type, 2025 to 2035
  • Figure 72: Latin America Market Attractiveness by Country, 2025 to 2035
  • Figure 73: Europe Market Value (USD Million) by Application, 2025 to 2035
  • Figure 74: Europe Market Value (USD Million) by End Use Industry, 2025 to 2035
  • Figure 75: Europe Market Value (USD Million) by Product Type, 2025 to 2035
  • Figure 76: Europe Market Value (USD Million) by Country, 2025 to 2035
  • Figure 77: Europe Market Value (USD Million) Analysis by Country, 2020 to 2035
  • Figure 78: Europe Market Volume (Tons) Analysis by Country, 2020 to 2035
  • Figure 79: Europe Market Value Share (%) and BPS Analysis by Country, 2025 to 2035
  • Figure 80: Europe Market Y-o-Y Growth (%) Projections by Country, 2025 to 2035
  • Figure 81: Europe Market Value (USD Million) Analysis by Application, 2020 to 2035
  • Figure 82: Europe Market Volume (Tons) Analysis by Application, 2020 to 2035
  • Figure 83: Europe Market Value Share (%) and BPS Analysis by Application, 2025 to 2035
  • Figure 84: Europe Market Y-o-Y Growth (%) Projections by Application, 2025 to 2035
  • Figure 85: Europe Market Value (USD Million) Analysis by End Use Industry, 2020 to 2035
  • Figure 86: Europe Market Volume (Tons) Analysis by End Use Industry, 2020 to 2035
  • Figure 87: Europe Market Value Share (%) and BPS Analysis by End Use Industry, 2025 to 2035
  • Figure 88: Europe Market Y-o-Y Growth (%) Projections by End Use Industry, 2025 to 2035
  • Figure 89: Europe Market Value (USD Million) Analysis by Product Type, 2020 to 2035
  • Figure 90: Europe Market Volume (Tons) Analysis by Product Type, 2020 to 2035
  • Figure 91: Europe Market Value Share (%) and BPS Analysis by Product Type, 2025 to 2035
  • Figure 92: Europe Market Y-o-Y Growth (%) Projections by Product Type, 2025 to 2035
  • Figure 93: Europe Market Attractiveness by Application, 2025 to 2035
  • Figure 94: Europe Market Attractiveness by End Use Industry, 2025 to 2035
  • Figure 95: Europe Market Attractiveness by Product Type, 2025 to 2035
  • Figure 96: Europe Market Attractiveness by Country, 2025 to 2035
  • Figure 97: East Asia Market Value (USD Million) by Application, 2025 to 2035
  • Figure 98: East Asia Market Value (USD Million) by End Use Industry, 2025 to 2035
  • Figure 99: East Asia Market Value (USD Million) by Product Type, 2025 to 2035
  • Figure 100: East Asia Market Value (USD Million) by Country, 2025 to 2035
  • Figure 101: East Asia Market Value (USD Million) Analysis by Country, 2020 to 2035
  • Figure 102: East Asia Market Volume (Tons) Analysis by Country, 2020 to 2035
  • Figure 103: East Asia Market Value Share (%) and BPS Analysis by Country, 2025 to 2035
  • Figure 104: East Asia Market Y-o-Y Growth (%) Projections by Country, 2025 to 2035
  • Figure 105: East Asia Market Value (USD Million) Analysis by Application, 2020 to 2035
  • Figure 106: East Asia Market Volume (Tons) Analysis by Application, 2020 to 2035
  • Figure 107: East Asia Market Value Share (%) and BPS Analysis by Application, 2025 to 2035
  • Figure 108: East Asia Market Y-o-Y Growth (%) Projections by Application, 2025 to 2035
  • Figure 109: East Asia Market Value (USD Million) Analysis by End Use Industry, 2020 to 2035
  • Figure 110: East Asia Market Volume (Tons) Analysis by End Use Industry, 2020 to 2035
  • Figure 111: East Asia Market Value Share (%) and BPS Analysis by End Use Industry, 2025 to 2035
  • Figure 112: East Asia Market Y-o-Y Growth (%) Projections by End Use Industry, 2025 to 2035
  • Figure 113: East Asia Market Value (USD Million) Analysis by Product Type, 2020 to 2035
  • Figure 114: East Asia Market Volume (Tons) Analysis by Product Type, 2020 to 2035
  • Figure 115: East Asia Market Value Share (%) and BPS Analysis by Product Type, 2025 to 2035
  • Figure 116: East Asia Market Y-o-Y Growth (%) Projections by Product Type, 2025 to 2035
  • Figure 117: East Asia Market Attractiveness by Application, 2025 to 2035
  • Figure 118: East Asia Market Attractiveness by End Use Industry, 2025 to 2035
  • Figure 119: East Asia Market Attractiveness by Product Type, 2025 to 2035
  • Figure 120: East Asia Market Attractiveness by Country, 2025 to 2035
  • Figure 121: South Asia & Pacific Market Value (USD Million) by Application, 2025 to 2035
  • Figure 122: South Asia & Pacific Market Value (USD Million) by End Use Industry, 2025 to 2035
  • Figure 123: South Asia & Pacific Market Value (USD Million) by Product Type, 2025 to 2035
  • Figure 124: South Asia & Pacific Market Value (USD Million) by Country, 2025 to 2035
  • Figure 125: South Asia & Pacific Market Value (USD Million) Analysis by Country, 2020 to 2035
  • Figure 126: South Asia & Pacific Market Volume (Tons) Analysis by Country, 2020 to 2035
  • Figure 127: South Asia & Pacific Market Value Share (%) and BPS Analysis by Country, 2025 to 2035
  • Figure 128: South Asia & Pacific Market Y-o-Y Growth (%) Projections by Country, 2025 to 2035
  • Figure 129: South Asia & Pacific Market Value (USD Million) Analysis by Application, 2020 to 2035
  • Figure 130: South Asia & Pacific Market Volume (Tons) Analysis by Application, 2020 to 2035
  • Figure 131: South Asia & Pacific Market Value Share (%) and BPS Analysis by Application, 2025 to 2035
  • Figure 132: South Asia & Pacific Market Y-o-Y Growth (%) Projections by Application, 2025 to 2035
  • Figure 133: South Asia & Pacific Market Value (USD Million) Analysis by End Use Industry, 2020 to 2035
  • Figure 134: South Asia & Pacific Market Volume (Tons) Analysis by End Use Industry, 2020 to 2035
  • Figure 135: South Asia & Pacific Market Value Share (%) and BPS Analysis by End Use Industry, 2025 to 2035
  • Figure 136: South Asia & Pacific Market Y-o-Y Growth (%) Projections by End Use Industry, 2025 to 2035
  • Figure 137: South Asia & Pacific Market Value (USD Million) Analysis by Product Type, 2020 to 2035
  • Figure 138: South Asia & Pacific Market Volume (Tons) Analysis by Product Type, 2020 to 2035
  • Figure 139: South Asia & Pacific Market Value Share (%) and BPS Analysis by Product Type, 2025 to 2035
  • Figure 140: South Asia & Pacific Market Y-o-Y Growth (%) Projections by Product Type, 2025 to 2035
  • Figure 141: South Asia & Pacific Market Attractiveness by Application, 2025 to 2035
  • Figure 142: South Asia & Pacific Market Attractiveness by End Use Industry, 2025 to 2035
  • Figure 143: South Asia & Pacific Market Attractiveness by Product Type, 2025 to 2035
  • Figure 144: South Asia & Pacific Market Attractiveness by Country, 2025 to 2035
  • Figure 145: MEA Market Value (USD Million) by Application, 2025 to 2035
  • Figure 146: MEA Market Value (USD Million) by End Use Industry, 2025 to 2035
  • Figure 147: MEA Market Value (USD Million) by Product Type, 2025 to 2035
  • Figure 148: MEA Market Value (USD Million) by Country, 2025 to 2035
  • Figure 149: MEA Market Value (USD Million) Analysis by Country, 2020 to 2035
  • Figure 150: MEA Market Volume (Tons) Analysis by Country, 2020 to 2035
  • Figure 151: MEA Market Value Share (%) and BPS Analysis by Country, 2025 to 2035
  • Figure 152: MEA Market Y-o-Y Growth (%) Projections by Country, 2025 to 2035
  • Figure 153: MEA Market Value (USD Million) Analysis by Application, 2020 to 2035
  • Figure 154: MEA Market Volume (Tons) Analysis by Application, 2020 to 2035
  • Figure 155: MEA Market Value Share (%) and BPS Analysis by Application, 2025 to 2035
  • Figure 156: MEA Market Y-o-Y Growth (%) Projections by Application, 2025 to 2035
  • Figure 157: MEA Market Value (USD Million) Analysis by End Use Industry, 2020 to 2035
  • Figure 158: MEA Market Volume (Tons) Analysis by End Use Industry, 2020 to 2035
  • Figure 159: MEA Market Value Share (%) and BPS Analysis by End Use Industry, 2025 to 2035
  • Figure 160: MEA Market Y-o-Y Growth (%) Projections by End Use Industry, 2025 to 2035
  • Figure 161: MEA Market Value (USD Million) Analysis by Product Type, 2020 to 2035
  • Figure 162: MEA Market Volume (Tons) Analysis by Product Type, 2020 to 2035
  • Figure 163: MEA Market Value Share (%) and BPS Analysis by Product Type, 2025 to 2035
  • Figure 164: MEA Market Y-o-Y Growth (%) Projections by Product Type, 2025 to 2035
  • Figure 165: MEA Market Attractiveness by Application, 2025 to 2035
  • Figure 166: MEA Market Attractiveness by End Use Industry, 2025 to 2035
  • Figure 167: MEA Market Attractiveness by Product Type, 2025 to 2035
  • Figure 168: MEA Market Attractiveness by Country, 2025 to 2035

Frequently Asked Questions

What was the overall size of the lead market in 2025?

The overall market size for lead market was USD 29,900 million in 2025.

How big the lead market is expected in 2035?

The lead market expected to reach USD 45,200 million in 2035.

What will drive the demand for lead market during the forecast period?

Increasing demand from the automotive sector, expanding battery production, infrastructure development, and rising applications in radiation shielding will drive the lead market during the forecast period.

List the top 5 countries contributing lead market?

The top 5 countries which drives the development of lead market are USA, UK, Europe Union, Japan and South Korea.

Which segment in type is expected to lead market?

Lead-206 segment driving market growth to command significant share over the assessment period.

Explore Similar Insights

Future Market Insights

Lead Market