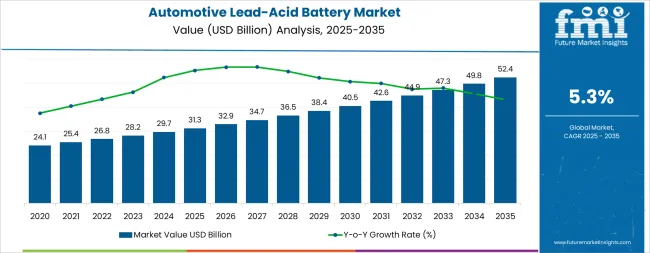
The Automotive Lead Acid Battery Market is projected to experience steady growth over the next decade, with a CAGR of 5.3% from 2025 to 2035. The market value is expected to rise from USD 31.3 billion in 2025 to USD 52.40 billion in 2035, reflecting consistent demand for reliable and cost-effective energy storage solutions in conventional and hybrid vehicles. The growth trajectory indicates a moderate upward curve, with gradual acceleration as manufacturers focus on improving battery performance, extending lifespan, and reducing maintenance requirements. Stable demand in commercial and passenger vehicles will underpin market expansion, particularly in regions with established automotive industries.
Analyzing the curve shape, the early years from 2025 to 2030 are likely to show a steady incline, representing incremental growth driven by replacement demand and adoption in emerging markets. Between 2030 and 2035, the curve may steepen slightly, reflecting increased investments in battery technology upgrades and growing vehicle production in developing regions. While the growth rate remains moderate, the market’s expansion is sustained and reliable, forming a gently ascending curve rather than a sharp spike.
The global Automotive Lead Acid Battery Market is primarily segmented into two main parent markets: Original Equipment Manufacturers (OEMs) and the aftermarket sector. OEMs dominate the market, accounting for approximately 62.38% of the share in 2024. This dominance is attributed to long-term contracts, bulk orders, and preferred supplier relationships with vehicle manufacturers, ensuring a steady demand for lead-acid batteries during vehicle production. The aftermarket segment, comprising about 18.19% of the market, caters to replacement needs, offering consumers cost-effective solutions for battery replacement and maintenance. This sector's growth is driven by the increasing vehicle ownership and the necessity for periodic battery replacements.
Recent trends in the Automotive Lead Acid Battery Market indicate a shift towards enhanced performance and sustainability. Manufacturers are focusing on developing advanced lead-acid batteries, such as Enhanced Flooded Batteries (EFB) and Absorbent Glass Mat (AGM) batteries, to meet the growing energy demands of modern vehicles. These innovations aim to improve battery life, efficiency, and compatibility with start-stop systems. There is a rising emphasis on recycling and sustainable practices within the industry to minimize environmental impact. The market is also witnessing increased competition from alternative battery technologies, prompting continuous advancements in lead-acid battery design and performance.
At-a-Glance Metrics
| Metric | Value |
|---|---|
| Market Value (2025) | USD 31.3 billion |
| Market Forecast (2035) | USD 52.40 billion |
| Growth Rate | 5.3% CAGR |
| Leading Battery Type | Flooded Batteries |
| Advanced Technology | AGM Batteries (30% share) |
The market demonstrates resilient fundamentals with Flooded Batteries maintaining dominant volume share through cost-effective performance in traditional vehicle applications and strong presence in price-sensitive emerging markets. AGM technology captures significant value share through premium positioning in start-stop vehicles, luxury automobiles, and applications requiring superior cycling performance. Geographic expansion remains concentrated in developed automotive markets with established vehicle fleets generating consistent replacement demand, while emerging economies show accelerating adoption driven by motorization trends and growing vehicle ownership rates.
Market expansion rests on three fundamental shifts driving demand across the automotive and aftermarket sectors.
The growth faces headwinds from lithium-ion battery competition in certain auxiliary applications and potential displacement in future vehicle architectures transitioning to higher voltage systems. Raw material price volatility for lead, plastics, and sulfuric acid impacts manufacturing costs and profit margins. Environmental regulations regarding lead recycling and battery disposal create compliance costs and operational complexity for manufacturers and distributors.
The Automotive Lead Acid Battery Market represents a resilient growth opportunity, expanding from USD 31.3 billion in 2025 to USD 52.40 billion by 2035 at a 5.3% CAGR. As global vehicle populations continue expanding, start-stop technology becomes mainstream, and vehicle electrical systems grow increasingly complex, lead-acid batteries have evolved from commodity products to differentiated technologies, enabling reliable starting power, supporting advanced vehicle features, and providing cost-effective energy storage across diverse automotive applications from economy vehicles to luxury automobiles.
The convergence of sustained vehicle population growth, start-stop technology standardization, aftermarket channel maturity, and lead-acid battery technology advancement creates resilient demand momentum. Advanced battery solutions offering superior cycling performance, enhanced charge acceptance, and extended service life will capture premium market positioning, while geographic expansion into emerging automotive markets and established aftermarket distribution will drive volume leadership. Closed-loop recycling infrastructure and proven technology reliability provide structural advantages over alternative battery chemistries.
Maintaining 60.0% market share through cost-effective manufacturing, proven reliability in traditional automotive applications, and strong presence in price-sensitive markets, flooded battery solutions enable comprehensive SLI functionality across diverse vehicle segments from economy cars to commercial vehicles without premium pricing requirements. Advantages including established manufacturing infrastructure, extensive distribution networks, and universal vehicle compatibility support sustained volume leadership while serving replacement demand in mature vehicle populations and new vehicle production in emerging markets. Expected revenue pool: USD 30.0-32.5 billion.
Capturing 30.0% market share and fastest growth trajectory, AGM battery applications drive premium demand through superior performance in start-stop vehicles, luxury automobiles, and applications requiring enhanced cycling durability and deep discharge recovery. Specialized capabilities for micro-hybrid systems, vehicles with regenerative braking, and premium vehicles with high electrical loads that exceed conventional battery specifications command significant price premiums from vehicle manufacturers and discerning consumers prioritizing reliability and performance. Opportunity: USD 15.0-17.5 billion.
The United States (5.4% CAGR) leads regional growth through large vehicle fleet exceeding 280 million units, extensive aftermarket distribution infrastructure, and increasing start-stop vehicle penetration in domestic automotive production. Strategic positioning supporting diverse climate conditions from extreme cold to desert heat, compliance with transportation regulations, and cost-effective distribution through automotive retail channels capture sustained replacement demand and technology upgrade opportunities. Geographic expansion upside: USD 10.5-12.0 billion.
Representing 10.0% market share, EFB technology addresses mid-tier start-stop applications providing superior cycling performance compared to conventional flooded batteries at lower cost than AGM solutions. Market positioning between traditional and premium technologies enables vehicle manufacturers to implement start-stop systems in mainstream vehicle segments with optimal cost-performance balance, expanding addressable markets for advanced battery technologies. Revenue opportunity: USD 5.0-6.0 billion.
Beyond original equipment manufacturing, aftermarket replacement demand representing 65-70% of total battery sales provides stable revenue streams through predictable replacement cycles, established distribution channels, and consumer brand loyalty. Opportunities in retail automotive chains, independent repair shops, and online direct-to-consumer sales expand market access while premium aftermarket brands command price premiums through performance guarantees and extended warranty programs. Aftermarket pool: USD 33.0-37.0 billion.
Heavy-duty commercial vehicle batteries requiring enhanced cranking power, extended service life, and reliable performance in demanding applications create specialized market opportunities. Fleet operator preferences for total cost of ownership optimization, predictive maintenance capabilities, and bulk procurement programs enable B2B business models with stable demand patterns and long-term customer relationships. Commercial segment opportunity: USD 8.0-10.0 billion.
Rapid vehicle ownership growth in India, Southeast Asia, Africa, and Latin America creates expanding demand for cost-effective battery solutions supporting new vehicle sales and growing vehicle populations. Market opportunities emphasizing affordability, local manufacturing capabilities, and distribution network development capture motorization trends in regions transitioning from two-wheelers to passenger vehicles and expanding commercial transportation. Emerging markets pool: USD 12.0-15.0 billion.
Primary Classification
The market segments by battery technology into Flooded Batteries, Absorbent Glass Mat (AGM) Batteries, Enhanced Flooded Batteries (EFB), and Gel Batteries, representing the evolution from traditional liquid electrolyte designs to advanced valve-regulated and absorbed electrolyte technologies optimizing performance, maintenance requirements, and application-specific capabilities.
Application segmentation divides the market into Starting, Lighting & Ignition (SLI) Batteries, Start-Stop Vehicle Batteries, Micro-Hybrid System Batteries, and Auxiliary Power Batteries, reflecting distinct requirements for conventional vehicle starting, enhanced cycling for start-stop systems, mild hybrid applications, and secondary power supply functions.
Vehicle type segmentation encompasses Passenger Vehicles, Light Commercial Vehicles, Heavy Commercial Vehicles, Motorcycles & Two-Wheelers, and Off-Highway Vehicles, addressing diverse battery requirements across vehicle categories with varying electrical loads, operating conditions, and performance specifications.
Geographic distribution covers North America, Europe, Asia Pacific, Latin America, and Middle East & Africa, with developed markets maintaining stable replacement demand while emerging regions show accelerating growth patterns driven by motorization and vehicle population expansion.
The segmentation structure reveals technology progression from conventional flooded batteries toward advanced AGM and EFB solutions optimizing cycling durability and charge acceptance, while application diversity spans from basic starting functions to sophisticated energy management supporting vehicle electrification and start-stop operations.
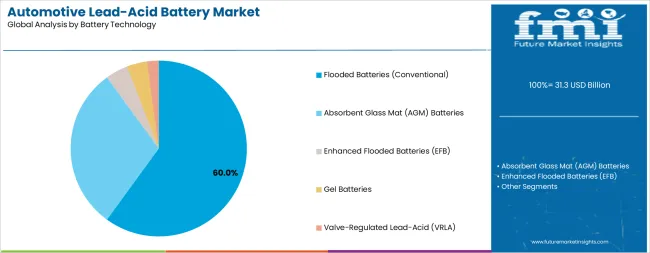
Market Position: Flooded Batteries command the leading position in the Automotive Lead Acid Battery Market with approximately 60.0% market share through cost-effective manufacturing, proven reliability across diverse operating conditions, and universal compatibility with conventional vehicle electrical systems that enable widespread adoption from economy vehicles to heavy commercial applications without requiring specialized charging systems or battery management electronics.
Value Drivers: The segment benefits from established manufacturing infrastructure providing economies of scale, extensive global distribution networks ensuring product availability across diverse markets, and consumer familiarity supporting brand loyalty and replacement purchasing patterns. Flooded battery technology offers optimal price-performance characteristics for traditional vehicle applications where start-stop functionality is not required, maintaining cost advantages of 30-50% compared to AGM alternatives.
Competitive Advantages: Flooded batteries differentiate through lowest total cost of ownership in conventional vehicle applications, proven durability in extreme temperature environments, and serviceability allowing electrolyte level maintenance that extends battery life in certain operating conditions. Manufacturing flexibility enables production across global locations supporting regional market requirements and reducing logistics costs through local production capabilities.
Key market characteristics:
Market Context: Absorbent Glass Mat (AGM) batteries represent the premium and fastest-growing segment in the Automotive Lead Acid Battery Market with 30.0% market share due to mandatory requirement for start-stop vehicle applications, superior cycling performance supporting frequent engine restarts, and enhanced charge acceptance enabling effective energy recovery from regenerative braking systems that optimize fuel efficiency and reduce emissions.
Appeal Factors: Vehicle manufacturers prioritize AGM technology for vehicles equipped with start-stop systems where battery cycling demands exceed conventional flooded battery capabilities by 3-4x, requiring advanced construction with absorbed electrolyte preventing stratification and enabling deep discharge recovery. The segment benefits from increasing start-stop vehicle production representing 55%+ of new passenger car manufacturing in developed markets and expanding to mainstream segments in emerging automotive markets.
Growth Drivers: European and Asian automotive markets lead AGM adoption with stringent emission regulations driving start-stop technology standardization across vehicle segments from compact cars to luxury vehicles. Premium vehicle electrical systems with heated seats, advanced infotainment, and driver assistance features require AGM batteries supporting higher electrical loads without voltage drop concerns. Consumer preference for maintenance-free batteries and superior warranty coverage supports premium pricing acceptance.
Market Challenges: Higher manufacturing costs compared to flooded batteries limit adoption in price-sensitive markets. Consumer awareness gaps regarding AGM technology benefits may restrict aftermarket upgrade opportunities from conventional battery replacement.
Application dynamics include:
Growth Accelerators: Expanding global vehicle population drives primary demand as battery replacement cycles create predictable aftermarket revenue streams supporting established distribution channels and providing business stability across economic conditions, enabling sustainable market growth independent of new vehicle production volatility. Start-stop technology proliferation accelerates premium battery adoption as fuel efficiency regulations mandate micro-hybrid systems requiring advanced AGM and EFB technologies that command 40-60% price premiums over conventional batteries, improving revenue per unit and supporting manufacturer investment in advanced production capabilities. Vehicle electrical system complexity increases sustained 12V battery demand as modern vehicles require reliable auxiliary power for safety-critical systems, advanced electronics, and electrified features, ensuring lead-acid battery relevance despite powertrain electrification and creating growth opportunities in hybrid and electric vehicle auxiliary applications.
Growth Inhibitors: Raw material price volatility for lead, sulfuric acid, and plastic components impacts manufacturing costs and profit margins, creating pricing pressure during commodity cost spikes that may not fully transfer to end customers through competitive market dynamics. Lithium-ion battery technology advancement creates potential long-term displacement risks in certain auxiliary applications and future vehicle architectures, requiring lead-acid battery manufacturers to emphasize cost advantages and established infrastructure benefits. Environmental regulations regarding battery manufacturing, transportation of hazardous materials, and end-of-life recycling create compliance costs and operational complexity that particularly impact smaller manufacturers with limited scale economies.
Market Evolution Patterns: Technology adoption accelerates toward AGM and EFB batteries in developed markets as start-stop vehicle penetration reaches saturation while emerging markets maintain traditional flooded battery dominance based on vehicle population characteristics and price sensitivity. Aftermarket channel consolidation continues with large automotive retail chains and online distributors capturing increasing market share from independent retailers, requiring battery manufacturers to develop omnichannel distribution strategies and direct consumer engagement capabilities. Recycling infrastructure matures with closed-loop systems achieving 95%+ collection rates in developed markets, supporting sustainability positioning and regulatory compliance while creating value recovery opportunities from lead reclamation offsetting raw material costs.
The Automotive Lead Acid Battery Market demonstrates varied regional dynamics with Growth Leaders including the United States (5.4% CAGR) driving expansion through large vehicle fleet and aftermarket strength. Steady Performers encompass South Korea (5.3% CAGR), European Union (5.3% CAGR), and Japan (5.2% CAGR) benefiting from start-stop technology adoption and advanced vehicle electrical systems. Emerging Markets feature the United Kingdom (5.1% CAGR), India (5.0% estimated CAGR), and China (4.9% estimated CAGR), where vehicle population growth and replacement demand support consistent expansion patterns.
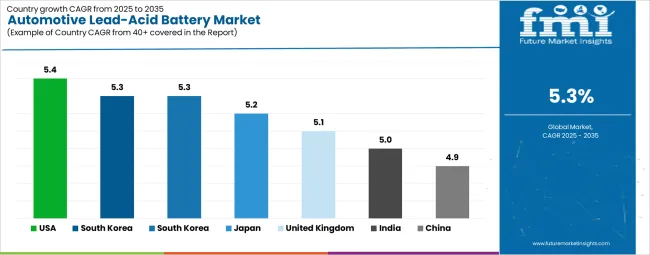
| Country | CAGR (2025-2035) |
|---|---|
| United States | 5.4% |
| South Korea | 5.3% |
| European Union | 5.3% |
| Japan | 5.2% |
| United Kingdom | 5.1% |
| India | 5.0% |
| China | 4.9% |
Regional synthesis reveals North American markets leading growth through extensive vehicle fleet base and robust aftermarket infrastructure, while European and Asian developed markets maintain strong expansion supported by start-stop vehicle penetration and premium battery technology adoption. Emerging markets show steady growth driven by motorization trends and expanding vehicle ownership creating new battery demand.
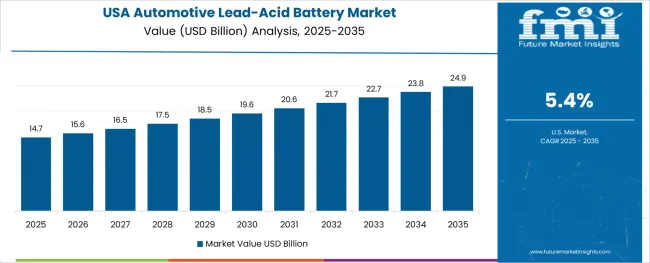
The United States establishes market leadership through the world's second-largest vehicle fleet exceeding 280 million units and extensive aftermarket distribution infrastructure spanning automotive retail chains, independent repair facilities, and online direct-to-consumer channels. The country's 5.4% CAGR through 2035 reflects sustained replacement demand from mature vehicle population averaging 12+ years vehicle age, increasing start-stop vehicle penetration in domestic automotive production from Detroit manufacturers, and extreme climate conditions from northern winters to southern heat requiring premium battery performance. Growth concentrates in major metropolitan regions and across diverse climate zones where battery performance requirements vary significantly, creating opportunities for product differentiation and regional market positioning.
American battery manufacturers and distributors leverage established logistics infrastructure, strong brand recognition through decades of market presence, and comprehensive product portfolios spanning economy to premium segments serving diverse consumer preferences and vehicle requirements. Distribution through major automotive retail chains including AutoZone, O'Reilly Auto Parts, and Advance Auto Parts provides extensive consumer access while professional installer channels serve commercial fleets and dealer service departments.
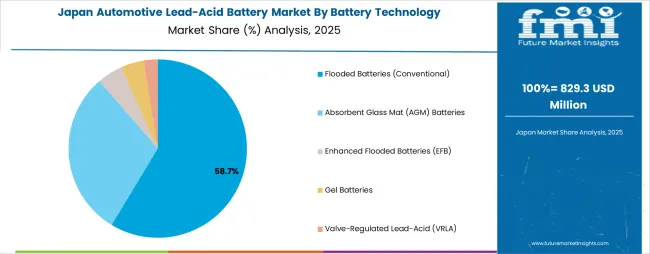
Japan's automotive battery market demonstrates sophisticated technology deployment with documented AGM implementation across domestic vehicle production from Toyota, Honda, Nissan, and other Japanese OEMs implementing start-stop systems and hybrid powertrains requiring advanced battery solutions. The country leverages battery manufacturing excellence and automotive technology integration expertise to maintain a 5.2% CAGR through 2035. Manufacturing facilities throughout Japanese industrial regions showcase advanced production incorporating quality control systems and continuous improvement methodologies that establish performance and reliability benchmarks.
Japanese battery manufacturers including GS Yuasa Corporation prioritize technology innovation and long-term reliability in battery development, creating demand for premium products with extended warranty coverage and proven performance across demanding operating conditions. The market benefits from strong domestic automotive industry integration and export opportunities serving global automotive production and aftermarket demand.
South Korea's automotive market demonstrates sophisticated battery technology integration with documented AGM adoption across Hyundai and Kia vehicle production implementing start-stop systems and increasing electrical content requiring advanced power management. The country leverages automotive manufacturing capabilities and component supply expertise to maintain a 5.3% CAGR through 2035. Manufacturing facilities support both domestic vehicle production and export operations serving global automotive markets with Korean OEM platforms.
Korean battery manufacturers benefit from integrated automotive supply chains supporting Hyundai Motor Group and other domestic OEMs while pursuing export opportunities in Asian and global markets. Technology advancement emphasizes cost-competitive AGM production and quality standards meeting international automotive requirements supporting Korean vehicle exports and global competitiveness.
In British automotive markets concentrated in regions including West Midlands, Northwest England, and South England, start-stop vehicle adoption follows broader European trends with increasing penetration supporting AGM battery demand across passenger vehicle segments. The UK market is expected to demonstrate sustained growth with a 5.1% CAGR through 2035, driven by established vehicle fleet requiring battery replacement, continued vehicle production at British manufacturing facilities, and alignment with European environmental regulations and automotive technology standards.
Market dynamics reflect mature automotive aftermarket with established distribution through national retail chains, independent garages, and specialist automotive retailers serving consumer and professional installation markets. Climate conditions including moderate temperatures and frequent short-trip driving patterns create specific battery performance requirements and replacement cycle characteristics.
India's automotive battery market demonstrates robust growth trajectory through expanding vehicle ownership surpassing 40 million passenger vehicles and rapid two-wheeler fleet exceeding 200 million units creating extensive battery replacement demand across diverse vehicle categories. The country maintains an estimated 5.0% CAGR through 2035, driven by motorization trends, rising middle-class vehicle purchases, and domestic automotive production expansion supporting both passenger vehicle and commercial vehicle segments with cost-effective battery solutions.
Manufacturing operations concentrated in automotive clusters including Delhi NCR, Mumbai, Chennai, and Pune showcase growing domestic battery production capabilities serving Indian OEM requirements and aftermarket replacement demand. Market dynamics emphasize cost-competitive products balancing performance and affordability requirements for price-sensitive Indian consumers while maintaining quality standards supporting vehicle reliability and customer satisfaction.
China's automotive battery market demonstrates substantial scale with documented battery demand serving the world's largest vehicle fleet exceeding 300 million units and extensive vehicle production capabilities manufacturing 25+ million vehicles annually across passenger and commercial segments. The country maintains an estimated 4.9% CAGR through 2035, reflecting mature automotive market characteristics with continued growth driven by vehicle fleet expansion in lower-tier cities, commercial vehicle electrification creating auxiliary battery demand, and replacement market maturation as vehicle population ages.
Domestic battery manufacturing capabilities span numerous Chinese producers alongside international joint ventures and wholly-owned foreign enterprises serving Chinese automotive production and aftermarket distribution. Market dynamics reflect intense domestic competition creating pricing pressures while technology advancement focuses on cost reduction and quality improvement supporting Chinese automotive market requirements and export opportunities.
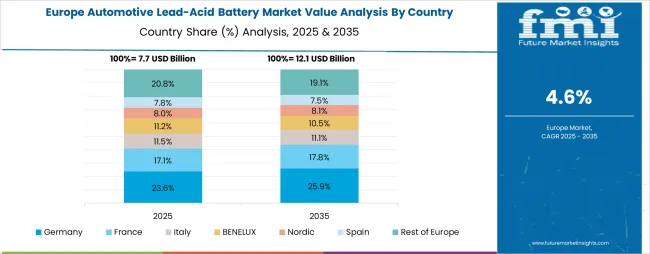
The Automotive Lead Acid Battery Market in Europe is projected to grow from USD 9.8 billion in 2025 to USD 16.5 billion by 2035, registering a CAGR of 5.3% over the forecast period. Germany is expected to maintain its leadership position with a 28.5% market share in 2025, rising to 29.2% by 2035, supported by its extensive vehicle fleet exceeding 48 million units, strong automotive manufacturing sector, and near-universal start-stop technology adoption driving premium AGM battery demand. France follows with a 19.8% share in 2025, projected to reach 20.3% by 2035, driven by significant passenger vehicle population and high start-stop penetration.
The United Kingdom holds an 18.2% share in 2025, expected to increase to 18.6% by 2035 through established aftermarket infrastructure and continued vehicle fleet replacement cycles. Italy commands a 16.4% share in 2025, rising to 16.8% by 2035, while Spain accounts for 11.3% in 2025, increasing to 11.5% by 2035 as start-stop vehicle adoption accelerates in Southern European markets. The Rest of Europe region, including Poland, Netherlands, Nordic countries, and other markets, is anticipated to hold 5.8% in 2025, declining slightly to 3.6% by 2035, attributed to market consolidation favoring larger established markets with extensive distribution networks and higher premium battery penetration rates supporting advanced automotive technologies.
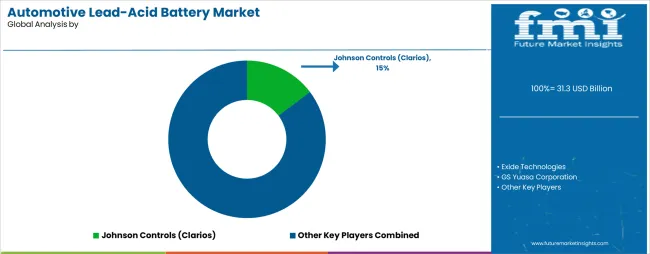
The Automotive Lead Acid Battery Market operates with moderate concentration, featuring approximately 15-20 major global participants and numerous regional manufacturers, where leading companies control roughly 55-65% of the global market share through established brand recognition, extensive distribution networks, and integrated manufacturing capabilities spanning multiple geographic regions. Competition emphasizes brand reputation, distribution access, and price-performance optimization rather than radical product innovation given mature battery technology characteristics.
Market Leaders encompass Johnson Controls (operating as Clarios following divestiture), Exide Technologies, GS Yuasa Corporation, East Penn Manufacturing, and EnerSys, which maintain competitive advantages through global manufacturing footprints, established OEM relationships spanning decades, and comprehensive product portfolios addressing diverse market segments from economy to premium applications. These companies leverage vertical integration including lead recycling capabilities, extensive distribution partnerships with automotive retailers and wholesalers, and brand recognition supporting consumer purchasing decisions and professional installer preferences.
Technology Challengers include regional battery manufacturers and specialized producers focusing on specific geographic markets or product segments through competitive pricing strategies, local manufacturing advantages, and targeted distribution approaches serving independent retailers and commercial fleet customers. These companies compete through cost leadership in conventional battery segments and selective technology adoption in growing AGM markets.
Regional Specialists feature companies focusing on specific geographic markets with strong local brand recognition, established distribution relationships, and manufacturing capabilities optimized for regional market requirements including climate-specific product formulations and local regulatory compliance. Market dynamics favor participants combining manufacturing efficiency with strong distribution partnerships, brand recognition supporting premium pricing, and recycling capabilities reducing raw material costs. Competitive pressure intensifies as automotive retail consolidation creates powerful distribution gatekeepers while online direct-to-consumer channels enable new market entrants bypassing traditional distribution structures. Technology competition between lead-acid and lithium-ion batteries in auxiliary applications creates long-term strategic considerations requiring lead-acid manufacturers to emphasize proven reliability, cost advantages, and established recycling infrastructure supporting sustainability positioning.
| Item | Value |
|---|---|
| Quantitative Units | USD 31.3 billion (2025) |
| Battery Technology | Flooded Batteries, Absorbent Glass Mat (AGM), Enhanced Flooded Battery (EFB), Gel Batteries |
| Application | Starting Lighting & Ignition (SLI), Start-Stop Vehicles, Micro-Hybrid Systems, Auxiliary Power |
| Vehicle Type | Passenger Vehicles, Light Commercial Vehicles, Heavy Commercial Vehicles, Motorcycles & Two-Wheelers |
| Distribution Channel | OEM Direct Supply, Automotive Aftermarket Retailers, Independent Distributors, Online Direct-to-Consumer |
| Regions Covered | North America, Europe, Asia Pacific, Latin America, Middle East & Africa |
| Countries Covered | United States, European Union (Germany, France, Italy), Japan, South Korea, United Kingdom, India, China, and 15+ additional countries |
| Key Companies Profiled | Johnson Controls (Clarios), Exide Technologies, GS Yuasa Corporation, East Penn Manufacturing, EnerSys, and others |
| Additional Attributes | Dollar sales by battery technology, application, and vehicle type categories, regional adoption trends across North America, Europe, and Asia Pacific, competitive landscape with global battery manufacturers and regional specialists, consumer preferences for reliability and cost-performance balance, OEM specifications for start-stop and conventional vehicle applications, aftermarket distribution dynamics and retail channel evolution, innovations in AGM technology and extended service life, and development of sustainable manufacturing with enhanced recycling infrastructure. |
The global Automotive Lead Acid Battery Market is estimated to be valued at USD 31.3 billion in 2025.
The market size for the Automotive Lead Acid Battery Market is projected to reach USD 52.4 billion by 2035.
The Automotive Lead Acid Battery Market is expected to grow at a 5.3% CAGR between 2025 and 2035.
The key product types in Automotive Lead Acid Battery Market are flooded batteries (conventional), absorbent glass mat (agm) batteries, enhanced flooded batteries (efb), gel batteries and valve-regulated lead-acid (vrla).
In terms of , application segment to command 0.0% share in the Automotive Lead Acid Battery Market in 2025.


Full Research Suite comprises of:
Market outlook & trends analysis
Interviews & case studies
Strategic recommendations
Vendor profiles & capabilities analysis
5-year forecasts
8 regions and 60+ country-level data splits
Market segment data splits
12 months of continuous data updates
DELIVERED AS:
PDF EXCEL ONLINE
Automotive Performance Part Market Size and Share Forecast Outlook 2025 to 2035
Automotive Carbon Ceramic Brake Market Size and Share Forecast Outlook 2025 to 2035
Automotive Camshaft Market Size and Share Forecast Outlook 2025 to 2035
Automotive Stamping Industry Analysis in India Size and Share Forecast Outlook 2025 to 2035
Automotive Cylinder Liner Market Size and Share Forecast Outlook 2025 to 2035
Automotive Microcontroller Market Size and Share Forecast Outlook 2025 to 2035
Automotive Roof Rails Market Size and Share Forecast Outlook 2025 to 2035
Automotive Active Safety System Market Size and Share Forecast Outlook 2025 to 2035
Automotive Diagnostic Scan Tool Market Size and Share Forecast Outlook 2025 to 2035
Automotive Test Equipment Market Size and Share Forecast Outlook 2025 to 2035
Automotive Dynamic Map Data Market Size and Share Forecast Outlook 2025 to 2035
Automotive Green Tires Market Size and Share Forecast Outlook 2025 to 2035
Automotive E-Tailing Market Size and Share Forecast Outlook 2025 to 2035
Automotive Interior Market Forecast Outlook 2025 to 2035
Automotive Key Market Size and Share Forecast Outlook 2025 to 2035
Automotive Appearance Chemical Market Forecast and Outlook 2025 to 2035
Automotive Seating Market Forecast and Outlook 2025 to 2035
Automotive Domain Control Module Market Forecast and Outlook 2025 to 2035
Automotive Remote Diagnostic Market Forecast and Outlook 2025 to 2035
Automotive-grade Inertial Navigation System Market Size and Share Forecast Outlook 2025 to 2035

Thank you!
You will receive an email from our Business Development Manager. Please be sure to check your SPAM/JUNK folder too.
Chat With
MaRIA