The Lead Capture Software Market is estimated to be valued at USD 2.8 billion in 2025 and is projected to reach USD 5.8 billion by 2035, registering a compound annual growth rate (CAGR) of 7.4% over the forecast period.
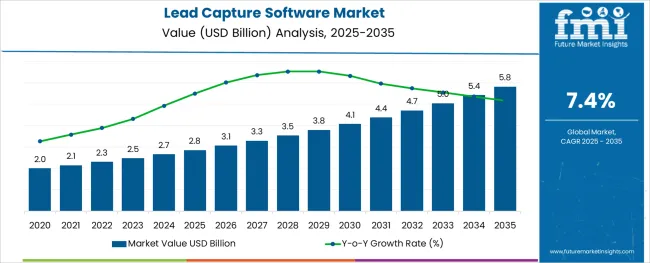
The lead capture software market has been experiencing steady growth as businesses across industries increasingly prioritize data-driven strategies to enhance customer acquisition and conversion rates. The rapid shift toward digital-first marketing models, accelerated by expanding e-commerce ecosystems and remote work adoption, has elevated the importance of efficient lead generation and management tools.
Enterprises are actively investing in solutions that automate lead collection, qualification, and routing processes to improve operational efficiency and drive revenue growth. Market performance has been bolstered by the integration of AI-powered analytics, multi-channel capture capabilities, and CRM interoperability within these platforms, enabling companies to optimize their marketing spend and conversion ratios.
Moving forward, demand is expected to rise as organizations seek scalable, cloud-based lead capture solutions to manage growing customer data volumes and navigate increasingly competitive digital markets. Additionally, a heightened emphasis on personalized marketing campaigns and regulatory compliance related to data protection is anticipated to shape product innovations and influence adoption patterns across small, mid-sized, and large enterprises.
The market is segmented by Offering and Enterprise Size and region. By Offering, the market is divided into Software and Services. In terms of Enterprise Size, the market is classified into SMEs and Large Enterprises. Regionally, the market is classified into North America, Latin America, Western Europe, Eastern Europe, Balkan & Baltic Countries, Russia & Belarus, Central Asia, East Asia, South Asia & Pacific, and the Middle East & Africa.
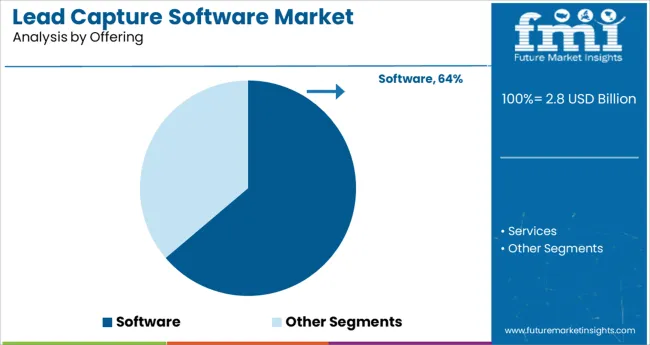
The software segment accounted for a dominant 63.8% of the total lead capture software market, reflecting strong enterprise demand for scalable and customizable solutions capable of enhancing lead generation processes. Growth within this segment has been driven by the widespread adoption of digital marketing channels, including social media, webinars, and virtual events, which require sophisticated tools to capture and manage prospect data effectively.
Vendors have responded by offering platforms with enhanced integrations, automation features, and real-time analytics to support lead qualification and nurturing strategies. The availability of cloud-based deployment models and subscription-based pricing structures has further expanded accessibility for businesses of all sizes.
As organizations increasingly seek unified marketing technology stacks, the interoperability of lead capture software with existing CRM and email marketing systems has become a decisive factor in vendor selection. Future momentum is expected to persist as enterprises pursue AI-driven capabilities, predictive lead scoring, and advanced customer segmentation features to improve conversion rates and campaign ROI.
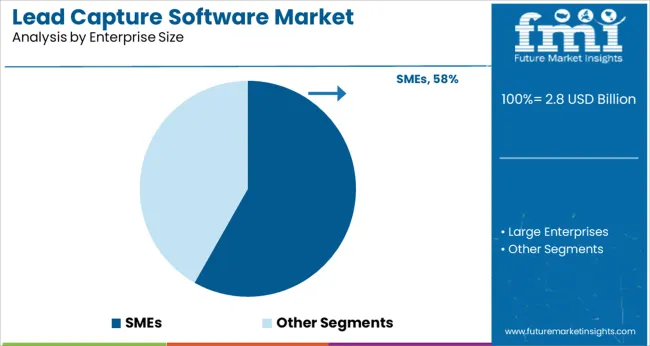
Within the enterprise size category, the SMEs segment captured a significant 58.2% market share, demonstrating strong adoption of lead capture software solutions among small and mid-sized businesses. This trend has been fueled by growing awareness of the operational and financial benefits associated with automating lead management processes, particularly as digital customer acquisition channels multiply.
SMEs have increasingly prioritized affordable, easy-to-deploy platforms offering user-friendly interfaces and scalable functionalities tailored to limited IT resources and marketing budgets. The proliferation of cloud-based applications and pay-as-you-go models has significantly reduced adoption barriers for this segment, enabling businesses to access advanced lead capture capabilities previously restricted to larger enterprises.
Additionally, the heightened competition in digital marketplaces has compelled SMEs to invest in data-driven tools that enhance customer engagement and conversion efficiency. Moving ahead, sustained demand from this segment is anticipated as these organizations pursue more personalized marketing initiatives and seek solutions offering AI-powered analytics and multi-channel integration to support business growth objectives.
The soaring demand for lead capture software is on the surge as it greatly assists the key organizations that use lead capture software to find new sales opportunities.
Since most business sectors are serious, organizations must find new business opportunities to stay ahead of the competition.
Lead collection software serves the same as it’s utilized by salespeople to identify new clients by combining data from various sources such as direct from advertising specialists, drives, etc.
The above-mentioned factor is considered to bring about some of the pivotal lead capture software market trends in the near future.
The trajectory of lead capture software adoption trends is rising as lead capture software allows customers to collect leads through various devices and channels such as email, website, and events, including online lead capture software.
Emerging trends in the lead capture software market include options for easily faring and importing lead information to and from various arrangements such as account pages, plain content, and so on.
Increased demand for digitalized documentation solutions is likely to open up a wide array of profitable lead-capture software market opportunities.
The global lead capture software market is confronted with significant challenges due to the scarcity of efficient Internet connectivity infrastructure in developing economies, thereby adversely affecting the lead capture software key trends & opportunities.
The rise in cyber threats, malware injections, data loss, and shared vulnerabilities are all factors impeding the lead capture software market growth.
Based on the offering, the software segment is projected to dominate the lead capture software market with a CAGR of 5.1% from 2025 to 2035.
Organizations use lead capture software to find new sales opportunities.
Since most business sectors are serious, organizations find new business opportunities to stay ahead of the competition.
Salespeople use lead capture software to identify new clients by combining data from various sources such as direct from drives, advertising specialists, salespeople, or customer service representatives.
The large enterprise is anticipated to account for greater lead capture software market share leading with a CAGR of 6.2% during the forecast period 2025 to 2035.
The large enterprises' segment is projected to account for a sizable portion of the market in various countries.
A large enterprise has full-time IT staff with several specialists, over 1,000 employees, a large CAPEX, and a presence in multiple domestic and international locations.
Qualified leads are critical for any large business, which emphasizes the importance of lead generation solutions.
Upcall, Callbox, and HubSpot, Inc. are a few of the top lead-generation companies serving large enterprises.
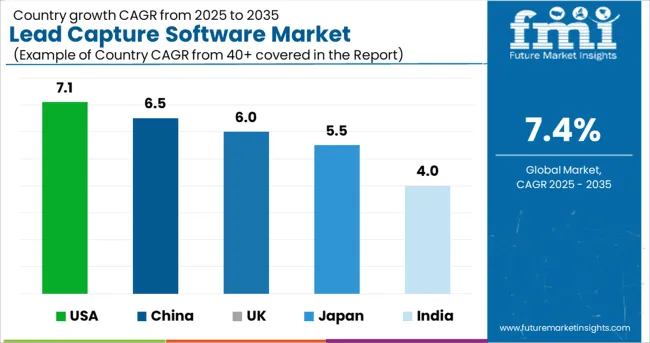
| Regions | CAGR (2025 to 2035) |
|---|---|
| USA Market | 7.1% |
| UK Market | 6.0% |
| China Market | 6.5% |
| Japan Market | 5.5% |
| India Market | 4.0% |
The global lead capture software market is divided into four regions: North America, Europe, Asia Pacific, the Middle East, Africa, and Latin America.
The USA is expected to account for a sizable global lead capture software market share with a CAGR of 7.1% from 2025 to 2035.
On account of increased investment in Research and Development and solution adoption in the region, China, India, and Japan's lead capture software market is expected to grow at a faster rate during the forecasted period.
The increasing number of lead-capture software companies across regions is expected to fuel the lead-capture software market growth even further.
Prominent lead capture software manufacturers increasing investments in product capabilities and business expansion are expected to spike the lead capture software market size during the forecast period.
Many market participants are discovering lucrative lead-capture software market opportunities in emerging economies such as China and India, where large populations are combined with new innovations in a variety of industries.
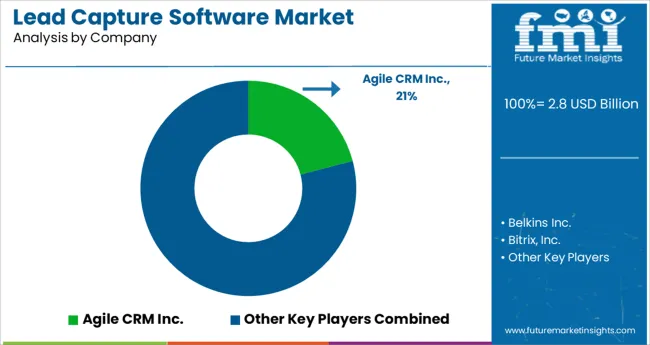
Various players are focusing on organic growth strategies such as product approvals, product launches, and other things like patents and events thereby enlarging their lead capture software market share.
Acquisitions, partnerships, and collaborations were among the inorganic growth strategies observed in the lead capture software market.
These activities have paved the way for market participants to expand their business and customer base, in turn, consolidating their market position and providing the best lead capture software.
With the rising demand for lead generation software, market players in the lead capture software market are expected to benefit from lucrative lead capture software market opportunities in the future.
One of the vital recent developments in the lead capture software market is when HubSpot, a customer relationship management (CRM) platform for small and medium-sized businesses, is expanding its toolkit.
The new product is designed to transform the role of operations professionals in the corporate world, allowing them to take the lead in assisting their organizations' scaling.
Some of the key players in the market are:
The global lead capture software market is estimated to be valued at USD 2.8 billion in 2025.
It is projected to reach USD 5.8 billion by 2035.
The market is expected to grow at a 7.4% CAGR between 2025 and 2035.
The key product types are software and services.
smes segment is expected to dominate with a 58.2% industry share in 2025.


Our Research Products

The "Full Research Suite" delivers actionable market intel, deep dives on markets or technologies, so clients act faster, cut risk, and unlock growth.

The Leaderboard benchmarks and ranks top vendors, classifying them as Established Leaders, Leading Challengers, or Disruptors & Challengers.

Locates where complements amplify value and substitutes erode it, forecasting net impact by horizon

We deliver granular, decision-grade intel: market sizing, 5-year forecasts, pricing, adoption, usage, revenue, and operational KPIs—plus competitor tracking, regulation, and value chains—across 60 countries broadly.

Spot the shifts before they hit your P&L. We track inflection points, adoption curves, pricing moves, and ecosystem plays to show where demand is heading, why it is changing, and what to do next across high-growth markets and disruptive tech

Real-time reads of user behavior. We track shifting priorities, perceptions of today’s and next-gen services, and provider experience, then pace how fast tech moves from trial to adoption, blending buyer, consumer, and channel inputs with social signals (#WhySwitch, #UX).

Partner with our analyst team to build a custom report designed around your business priorities. From analysing market trends to assessing competitors or crafting bespoke datasets, we tailor insights to your needs.
Supplier Intelligence
Discovery & Profiling
Capacity & Footprint
Performance & Risk
Compliance & Governance
Commercial Readiness
Who Supplies Whom
Scorecards & Shortlists
Playbooks & Docs
Category Intelligence
Definition & Scope
Demand & Use Cases
Cost Drivers
Market Structure
Supply Chain Map
Trade & Policy
Operating Norms
Deliverables
Buyer Intelligence
Account Basics
Spend & Scope
Procurement Model
Vendor Requirements
Terms & Policies
Entry Strategy
Pain Points & Triggers
Outputs
Pricing Analysis
Benchmarks
Trends
Should-Cost
Indexation
Landed Cost
Commercial Terms
Deliverables
Brand Analysis
Positioning & Value Prop
Share & Presence
Customer Evidence
Go-to-Market
Digital & Reputation
Compliance & Trust
KPIs & Gaps
Outputs
Full Research Suite comprises of:
Market outlook & trends analysis
Interviews & case studies
Strategic recommendations
Vendor profiles & capabilities analysis
5-year forecasts
8 regions and 60+ country-level data splits
Market segment data splits
12 months of continuous data updates
DELIVERED AS:
PDF EXCEL ONLINE
Lead Mining Software Market Size and Share Forecast Outlook 2025 to 2035
Lead Scoring Software Market Size and Share Forecast Outlook 2025 to 2035
Lead Intelligence Software Market Size and Share Forecast Outlook 2025 to 2035
Document Capture Software Market Size and Share Forecast Outlook 2025 to 2035
Lead-to-Account Matching and Routing Software Market Size and Share Forecast Outlook 2025 to 2035
Intelligent Enterprise Data Capture Software Industry Analysis in Japan Size and Share Forecast Outlook 2025 to 2035
Intelligent Enterprise Data Capture Software Market Size, Growth, and Forecast 2025 to 2035
Intelligent Enterprise Data Capture Software Market in Korea – Trends & Forecast 2025 to 2035
Western Europe Intelligent Enterprise Data Capture Software Market - Growth & Forecast 2025-2035
Software-Defined Wide Area Network Market Size and Share Forecast Outlook 2025 to 2035
Lead-free Brass Rods Market Size and Share Forecast Outlook 2025 to 2035
Lead Acid Battery Market Size and Share Forecast Outlook 2025 to 2035
Lead Acid Battery Recycling Market Size and Share Forecast Outlook 2025 to 2035
Lead Smelting and Refining Market Size and Share Forecast Outlook 2025 to 2035
Software Defined Vehicle Market Size and Share Forecast Outlook 2025 to 2035
Software Defined Networking (SDN) And Network Function Virtualization (NFV) Market Size and Share Forecast Outlook 2025 to 2035
Software Defined Perimeter (SDP) Market Size and Share Forecast Outlook 2025 to 2035
Software-Defined Wide Area Network SD-WAN Market Size and Share Forecast Outlook 2025 to 2035
Software Defined Radio (SDR) Market Size and Share Forecast Outlook 2025 to 2035
Software License Management (SLM) Market Size and Share Forecast Outlook 2025 to 2035

Thank you!
You will receive an email from our Business Development Manager. Please be sure to check your SPAM/JUNK folder too.
Chat With
MaRIA