The Lead Scoring Software Market is estimated to be valued at USD 2.4 billion in 2025 and is projected to reach USD 7.1 billion by 2035, registering a compound annual growth rate (CAGR) of 11.6% over the forecast period.
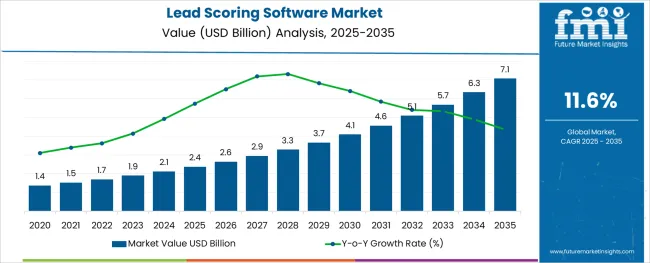
The lead scoring software market is witnessing steady growth as businesses increasingly prioritize data-driven strategies to enhance their sales pipelines and marketing conversion rates. The growing complexity of customer acquisition processes, combined with the rising adoption of marketing automation platforms, has elevated the importance of reliable lead qualification tools.
As organizations seek to improve operational efficiency and allocate resources toward high-potential prospects, the deployment of lead scoring software has gained considerable momentum across industries. In the coming years, market expansion is expected to be propelled by the integration of artificial intelligence and machine learning algorithms, enabling more precise, behavior-based, and predictive scoring models.
The shift toward omnichannel customer engagement and heightened competition in both B2B and B2C sectors further amplifies the need for advanced lead prioritization solutions. Additionally, the increasing emphasis on CRM integration and real-time analytics capabilities is likely to stimulate product innovations and enterprise adoption, positioning the market for consistent growth across established and emerging economies.
The market is segmented by Type, Application, and Language and region. By Type, the market is divided into On-Premises and Cloud-based. In terms of Application, the market is classified into Large Enterprises and SMEs. Based on Language, the market is segmented into Single Language and Multiple Language. Regionally, the market is classified into North America, Latin America, Western Europe, Eastern Europe, Balkan & Baltic Countries, Russia & Belarus, Central Asia, East Asia, South Asia & Pacific, and the Middle East & Africa.
The market is segmented by Type, Application, and Language and region. By Type, the market is divided into On-Premises and Cloud-based. In terms of Application, the market is classified into Large Enterprises and SMEs. Based on Language, the market is segmented into Single Language and Multiple Language. Regionally, the market is classified into North America, Latin America, Western Europe, Eastern Europe, Balkan & Baltic Countries, Russia & Belarus, Central Asia, East Asia, South Asia & Pacific, and the Middle East & Africa.
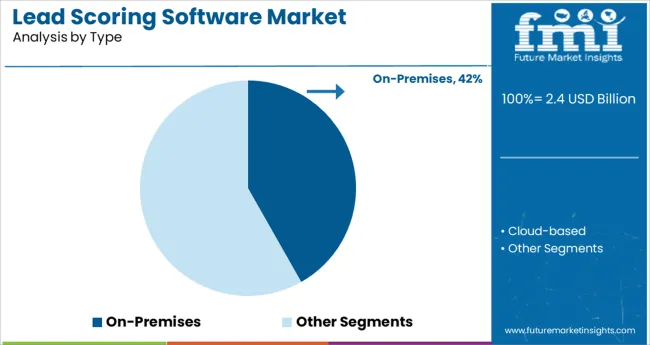
The on-premises segment accounted for approximately 41.8% of the total lead scoring software market share, maintaining a substantial presence within the deployment type category. This segment’s sustained relevance is primarily driven by data-sensitive industries and large organizations requiring enhanced control over their data management processes and IT infrastructure.
On-premises solutions offer businesses the ability to customize lead scoring models according to proprietary algorithms and internal compliance standards, an advantage particularly valued in sectors with stringent data privacy regulations. Despite the accelerating shift toward cloud-based solutions, on-premises software continues to attract enterprises with existing legacy systems and significant investments in private server environments.
Additionally, concerns surrounding data residency, cybersecurity, and operational continuity have led several large corporations to retain on-premises deployments for critical applications. The segment’s future outlook remains stable, with incremental growth anticipated through hybrid models that combine on-premises control with cloud-based analytics enhancements.
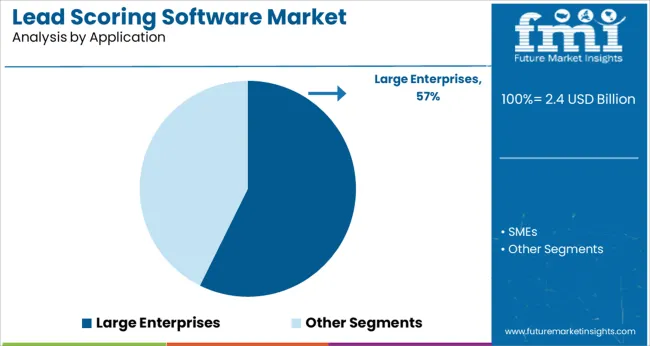
Within the application category, the large enterprises segment dominated with a 57.3% market share, reflecting the greater adoption of lead scoring software among businesses with expansive sales operations and high-volume lead generation activities. These organizations typically manage diverse product portfolios and multi-tiered customer engagement processes, necessitating sophisticated lead prioritization tools to optimize their conversion strategies.
Large enterprises often operate across multiple geographic regions and sales channels, making it essential to deploy scalable and customizable lead scoring solutions that can integrate seamlessly with existing CRM and marketing automation systems. The segment’s prominence is further supported by substantial IT budgets and a heightened focus on customer experience management, enabling the procurement and implementation of advanced, AI-powered scoring models.
Over the forecast period, sustained demand for predictive analytics, real-time lead scoring, and deeper integration with sales enablement platforms is expected to reinforce this segment’s leading market position.
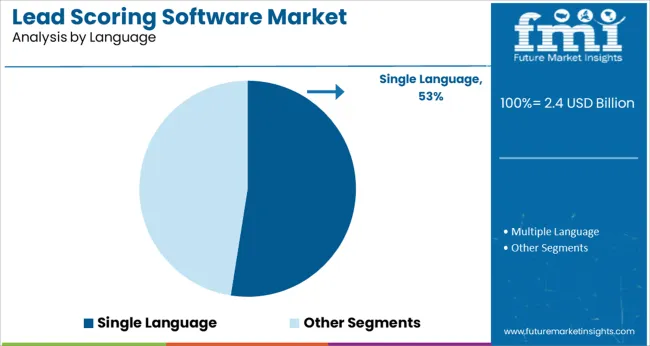
The single language segment represented around 52.5% of the lead scoring software market share within the language category, primarily driven by businesses operating within domestic or regionally confined markets. These organizations often prioritize lead scoring platforms that cater to a specific language environment, simplifying software implementation, user training, and operational efficiency.
The prevalence of English, Mandarin, and Spanish-language solutions in major markets has further consolidated this segment’s position. Additionally, single language lead scoring software typically requires fewer localization resources and offers a cost-effective option for small and medium enterprises or large firms focusing on single-language customer bases.
While multilingual platforms are gradually gaining traction among globally operating corporations, the demand for reliable, single-language solutions remains resilient, particularly in markets where regulatory, cultural, or operational factors favor language-specific customer engagement tools. Future segment growth is likely to be sustained by continued regional market expansions and platform upgrades incorporating AI-driven scoring logic within single-language frameworks.
The lead scoring software adoption trends are facilitated by the features of lead scoring software, which saves time and money while producing the desired results when compared to traditional methods of lead acquisition.
Lead-scoring software in the real estate industry helps to reduce excessive workload while also improving lead conversion and productivity thereby widening the lead-scoring software market opportunities.
Individual income growth, an increasing tendency to relocate to new locations due to job requirements, and increased construction activity are all considered to be some of the vital factors enlarging the lead-scoring software market size.
The lead-scoring software market outlook is likely to witness a positive phase as lead-scoring software can improve a brand's ability to reach target prospects and capture the attention of qualified leads, making it easier for sales to convert them.
Lead scoring software is useful for more than just finding prospects as it may also present numerous lead scoring software market opportunities.
Key lead scoring strategies include personalizing all marketing and channels through the use of behavioral lead data and predictive scoring, tracking website performance and analytics to identify the source of traffic and leads, and optimizing a website for conversions through the use of the right copy and message to resonate with target groups.
Adopting the same is expected to bring about potential lead-scoring software market growth opportunities. Also, one can achieve better results by combining marketing and sales efforts.
Tracking customer interactions and engagement, as well as improving social media strategy, are some of the other factors expected to boost the lead-scoring software market statistics.
The cloud-based segment is predicted to lead the lead-scoring software market, by type with a CAGR of 11.3% from 2025 to 2035. Cloud-based deployment is expected to be the most preferred method of software deployment, and the segment is expected to maintain its dominance over the next few years.
The advancement of cloud computing technology and services such as Software as a Service (SaaS), Infrastructure as a Service (IaaS), and Platform as a Service (PaaS) is projected to fuel the lead-scoring software market growth.
The large enterprise segment is likely to hold sway over the lead-scoring software market advancing with a CAGR of 11.2% through 2035. While the large generation of data across industries likely increase product demand across large enterprises, the same augurs well for lead-scoring software market trends & forecast.
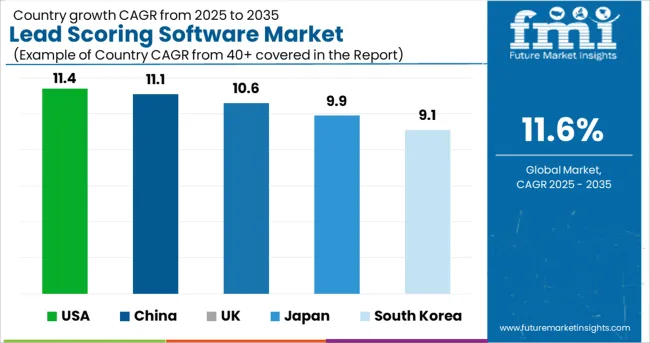
| Regions | CAGR (2025 to 2035) |
|---|---|
| USA Market | 11.4% |
| UK Market | 10.6% |
| China Market | 11.1% |
| Japan Market | 9.9% |
| South Korea Market | 9.1% |
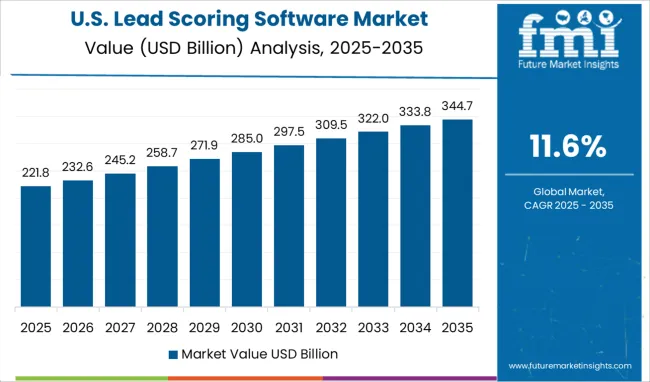
The USA is anticipated to lead the global lead-scoring software market leading with a CAGR of 11.4% during the forecast period 2025 to 2035.
The USA witnessed a high unemployment rate, indicating that the economy was in trouble.
The cancellation of in-person meetings and trade shows was one of the most significant effects of COVID-19 on the B2B industry.
The decrease in the number of trade shows and personal meetings has had a significant impact on the adoption of lead-scoring software.
On account of the increasing number of food manufacturers in the industry, China, Japanese, and South Korean market is expected to hold a higher lead-scoring software market share during the forecast period.
The Middle East and Africa markets are likely to grow at a rapid pace due to the expanding food industry, while Latin America is expected to grow at a moderate pace during the forecast period.
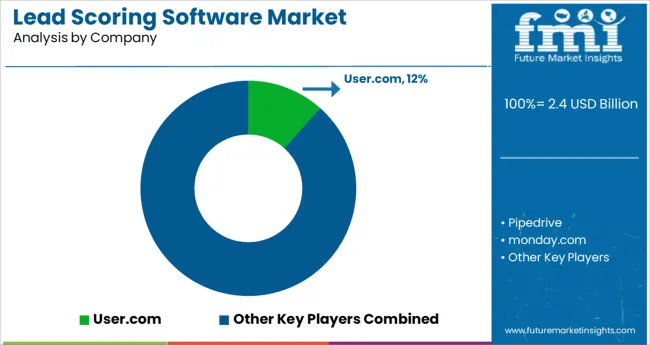
The lead-scoring software market is highly fragmented due to a large number of lead-scoring companies in the market. As a result, being innovative in the market is critical, as consumers prefer products with cutting-edge features.
Capital expenditure is also high, allowing companies with strong lead-scoring strategies to move quickly. Market players are involved in various strategies to consolidate their market position thereby enlarging their lead-scoring software market share.
A couple of recent developments in lead scoring software market are as follows:
It also enhanced clone actions, making it easier to copy email content or new asset types associated with campaigns.
The global lead scoring software market is estimated to be valued at USD 2.4 billion in 2025.
It is projected to reach USD 7.1 billion by 2035.
The market is expected to grow at a 11.6% CAGR between 2025 and 2035.
The key product types are on-premises and cloud-based.
large enterprises segment is expected to dominate with a 57.3% industry share in 2025.


Full Research Suite comprises of:
Market outlook & trends analysis
Interviews & case studies
Strategic recommendations
Vendor profiles & capabilities analysis
5-year forecasts
8 regions and 60+ country-level data splits
Market segment data splits
12 months of continuous data updates
DELIVERED AS:
PDF EXCEL ONLINE
Lead-free Brass Rods Market Size and Share Forecast Outlook 2025 to 2035
Lead Acid Battery Market Size and Share Forecast Outlook 2025 to 2035
Lead Acid Battery Recycling Market Size and Share Forecast Outlook 2025 to 2035
Lead Smelting and Refining Market Size and Share Forecast Outlook 2025 to 2035
Lead Management Market Size and Share Forecast Outlook 2025 to 2035
Leadership Development Program Market Analysis - Size, Share, and Forecast 2025 to 2035
Lead Market Growth - Trends & Forecast 2025 to 2035
Examining Market Share Trends in Leadership Development Programs
Lead Zirconate Titanate Market Size & Trends 2025
Lead Stearate Market
Leadscrew Market
Lead Mining Software Market Size and Share Forecast Outlook 2025 to 2035
Lead Capture Software Market Size and Share Forecast Outlook 2025 to 2035
Lead Intelligence Software Market Size and Share Forecast Outlook 2025 to 2035
Lead-to-Account Matching and Routing Software Market Size and Share Forecast Outlook 2025 to 2035
KNN Lead-free Piezoelectric Ceramics Market Size and Share Forecast Outlook 2025 to 2035
BNT Lead-free Piezoelectric Ceramics Market Size and Share Forecast Outlook 2025 to 2035
Online Leadership Development Program Market Forecast and Outlook 2025 to 2035
Custom Leadership Development Program Market Growth, Trends and Forecast from 2025 to 2035
Europe Leadership Development Program Market - Growth & Demand 2025 to 2035

Thank you!
You will receive an email from our Business Development Manager. Please be sure to check your SPAM/JUNK folder too.
Chat With
MaRIA