Reports

- Global Locations -

Headquarters

Future Market Insights, Inc.

Christiana Corporate, 200
Continental Drive, Suite 401,
Newark, Delaware - 19713,
United States

T: +1-845-579-5705

Americas

Future Market Insights, Inc.

616 Corporate Way, Suite 2-9018,
Valley Cottage, NY 10989, United States

T: +1-347-918-3531

MEA

Future Market Insights

1602-6 Jumeirah Bay X2 Tower, Plot No: JLT-PH2-X2A,
Jumeirah Lakes Towers, Dubai,
United Arab Emirates

Europe

Future Market Insights

3rd Floor, 207 Regent Street,
W1B 3HH London
United Kingdom

T: + 44 (0) 20 8123 9659
D: +44 (0) 20 3287 4268

Asia Pacific

Future Market Insights

IndiaLand Global Tech Park, Unit UG-1, Behind Grand HighStreet, Phase 1, Hinjawadi, MH, Pune – 411057, India

Lead-to-account Matching and Routing Software Market Outlook (2022 to 2032)

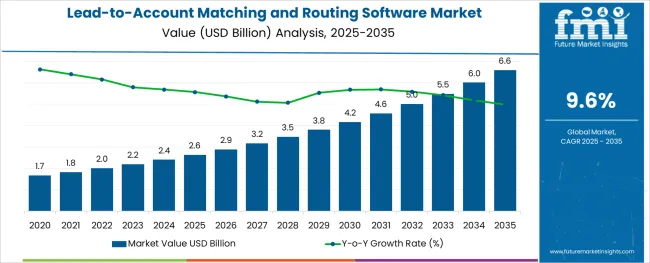
[339 Pages Report] The lead-to-account matching and routing software market are predicted to grow at a reasonable CAGR of 9.6% during the forecast period of 2022 to 2032. The global lead-to-account matching and routing market are estimated to reach a value of nearly US$ 2 Billion by 2032, increasing from US$ 810 Million in 2022.

In comparison to conventional CRM software, specific lead-to-account matching and routing software solutions have manifested to be mission-critical in today’s complex GTM motions of big corporate houses.

Lead-to-account matching and routing software solutions correspond fresh leads to the relevant account holder records in a CRM, subsequently routing them to the appropriate salesperson based on the process mapping of any organization. Timeliness and precision in lead-to-account matching and routing are very important parts of any go-to-market (GTM) operations strategy making this service, at a third-party level, a growing market in the present times.

Since the use of Salesforce lead-to-account matching and routing software allows businesses to gain a better knowledge of leads & engagements and ensures that the leads are followed up on more quickly. Numerous such advantages of integrating it are analyzed to propel the lead-to-account matching and routing market growth now and ahead.

Attributes Details
Lead-to-account Matching and Routing Software Market Size (2021) US$ 728 Million
Lead-to-account Matching and Routing Software Market Value (2022) US$ 810 Million
Lead-to-account Matching and Routing Software Market Value (2032) US$ 2 Billion
Lead-to-account Matching and Routing Software Market Growth Rate (2022 to 2032) 9.6%

Don't pay for what you don't need

Customize your report by selecting specific countries or regions and save 30%!

What is the Covid-19 Impact on Global Lead-to-account Matching and Routing Software Market?

Covid-19 has had a financial impact on all types of business enterprises around the world. A global market study on lead-to-account matching and routing software adoption trends reveals the negative as well as positive impacts that have resulted in the present course of the market. As per the report, the global growth rate of the market has dropped significantly, which was recorded to be 11.2% during the previous analysis period of 2015 to 2021.

On the contrary, the global shift of businesses over digital or online platforms got accelerated during the pandemic years leading to some favorable opportunities for the lead-to-account matching and routing software market. This hike in demand for digital marketing and services is poised to be the stimulating factor in reviving the lead-to-account matching and routing software market size in the post-pandemic years.

What is the Future of the Global Lead-to-account Matching and Routing Software Market?

Attracting potential consumers over digital platforms has turned out to be the most critical factor for the success of any enterprise in this age of information. The application of suitable software to carry out this requirement with enhanced user experience has set in the demand for lead-to-account matching and routing software market.

The software analyzed for the lead-to-account matching and routing software market report not only saves time and resources by automating GTM operations but also assists in sending cleaner and more accurate data into the company’s CRM. The software tools that can detect the occurrence of any repetitive data and reduce duplication are expected to further augment the lead-to-account matching and routing software market future trends in the coming days.

The function of revenue operations can benefit from the automatic routing solutions that can minimize the loss of new leads and establish account routing rules that are predicted to influence the lead-to-account matching and routing software market key trends and opportunities in the future.

Integration of a number of other key variables, such as information on account history or even lead source, is considered to play a greater role in the adoption of lead-to-account matching and routing software by the end users.

What are the Major Challenges Experienced by the Lead-to-account Matching and Routing Software Market Players?

The ongoing tussle between public administration and big corporate houses, in the domain of digital data management software, regarding the privacy and security of data is expected to restrain the emerging trend in the lead-to-account matching and routing software market to a certain extent.

Also, the higher cost associated with the installation and maintenance of the digital system is a major limiting factor for the growth of lead-to-account matching and routing software market size in different verticals.

Sudip Saha
Sudip Saha

Principal Consultant

Talk to Analyst

Find your sweet spots for generating winning opportunities in this market.

Comparative View of Adjacent Lead-to-account Matching and Routing Software Market

Lead-to-account Matching and Routing Software Market:

Attributes Lead-to-account Matching and Routing Software Market
CAGR (2022 to 2032) 6.6%
Market Value (2027) US$ 1.3 Billion
Growth Factor The proliferation of digital marketing methods in the internet space.
Opportunity Improving the condition of digital literacy around the world to encourage the market further.
Key Trends Provision of other beneficial features in the solution to ease online business activities.

Lead Capture Software Market:

Attributes Lead Capture Software Market
CAGR (2022 to 2032) 7.4%
Market Value (2027) US$ 3.4 Billion
Growth Factor Increase in the success rate of converting potential customers into actual ones.
Opportunity Growing volume of digital footprint over e-commerce platforms and shopping sites.
Key Trends Integration of lead capture software into the official web pages of business enterprises.

Lead Intelligence Software Market:

Attributes Lead Intelligence Software Market
CAGR (2022 to 2032) 6.4%
Market Value (2027) US$ 10.5 Billion
Growth Factor Emphasis on developing consumer-specific products.
Opportunity Expansion of product ads over social networking platforms with varied user bases.
Key Trends Adoption of advanced software to derive fruitful decisions out of lead intelligence software.

According to one of the prominent analysts for this market segment, automated lead-to-account matching and routing software are ‘absolutely essential for any market player with the growing volume of leads in the present competitive world. Adoption of the software leading to the new G2 category is recognized to be a fundamental strategy for the marketing and sales department that is already boosting the demand for lead-to-account matching and routing software market in different regions of the world.

As the use of CRM systems has an intrinsic capability to manage lead-to-account matching and routing but is manual and time-consuming, its consolidation by the use of software solutions automates the whole process reducing labor hours. Acquiring such advanced capacity connected with any organization’s CRM has proved to be extremely profitable and is expected to fuel the lead-to-account matching and routing software market growth in the long run.

Revenue operations specialists, such as sales development representatives or even account executives, avoid spending time trying to route to the relevant personnel and account by utilizing the lead-to-account matching and routing software. Various workflow management solutions, such as marketing automation software or account data management software, are frequently utilized alongside the lead-to-account matching Salesforce solutions resulting in mutual expansion of the overall market.

What is the Segmentation Outlook of the Lead-to-Account Matching and Routing Software Market?

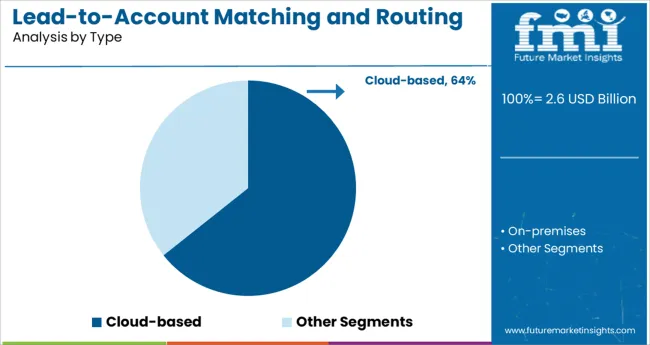
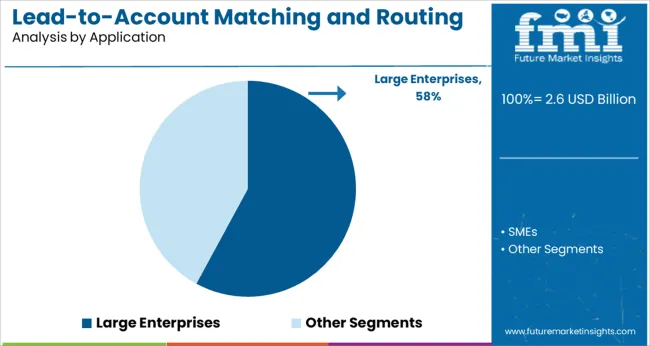
The market for lead-to-account matching and routing software is divided into three categories: Type, Application, and region. The market is divided into two types of deployments: cloud and on-premise. The lead-to-account matching and routing software market are further divided into SMEs and large enterprises, depending on company size. In terms of revenue and projection for the period 2022 to 2032, the segmental analysis focuses on revenue and forecast by type and Application.

Cloud-based segment creating a Higher Potential in the Lead-to-Account Matching and Routing Software Market

The global lead-to-account matching and routing software market has been segmented into two groups based on comprehensive research: On-premise and cloud-based. On-premise in the global lead-to-account matching and routing software market category by type has a considerable market share. Cloud-based is the leading market by type, with a forecasted CAGR of 9.3% during the projected period.

Large enterprises leading the Lead-to-Account Matching and Routing Software Market, based on Application

According to FMI, the global lead-to-account matching and routing software market is divided into two categories based on Application: large enterprises and SMEs. Large organizations dominate the global lead-to-account matching and routing software market, which is predicted to grow at a 9.4% CAGR through 2032.

Get the data you need at a Fraction of the cost

Personalize your report by choosing insights you need
and save 40%!

Which is the Key Region in the Lead-to-Account Matching and Routing Software Market?

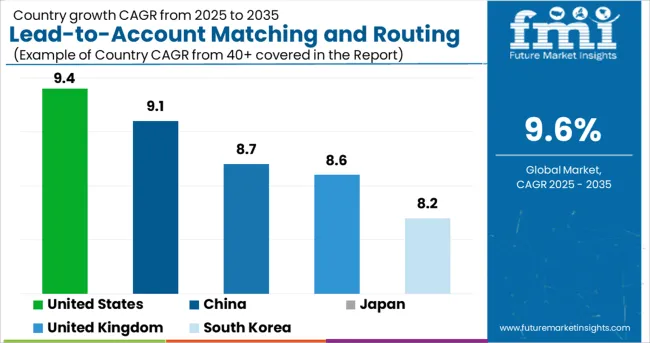
Among the other regions, the USA is anticipated to dominate the lead-to-account matching and routing software market during the forecast period. An increasing number of digital businesses in North America is likely to generate demand for digital marketing-related solutions.

Since lead-to-account matching and routing software is an advanced routing and scheduling solution for B2B teams looking into the revenue aspect, the adoption has grown for achieving high inbound conversion rates, new levels of productivity, and customer satisfaction. In the coming years, as businesses march towards digitalization, North America is likely to stay dominant in terms of adoption as well as the development of such solutions.
Regions CAGR (2022 to 2032)
United States 9.4%
United Kingdom 8.6%
China 9.1%
Japan 8.7%
South Korea 8.2%

What is the Competitive Outlook of the Lead-to-Account Matching and Routing Software Market?

Lead-to-account matching and routing software market compete mostly on the basis of providing innovative and efficient services. The statistics show how competitors are capitalizing on the market for lead-to-account matching and routing software.

With the increased demand for Lead-to-account matching and routing software in the global market, market players in the Lead-to-account matching and routing software market are expected to benefit from attractive growth prospects in the future.

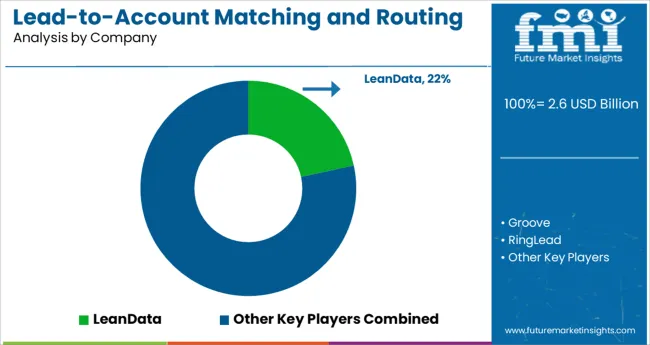
Key Players

  • LeanData
  • Groove
  • RingLead
  • Engagio
  • Openprise

Key segments

By Type:

  • On-Premises
  • Cloud

By Application:

  • Large Enterprises
  • SMEs

By Region:

  • North America
  • Latin America
  • Europe
  • Asia Pacific
  • Middle East & Africa

Frequently Asked Questions

What is the CAGR of the Lead-to-Account Matching and Routing Software Market?

The lead-to-account matching and routing software market is projected to have a CAGR of 9.6% during the forecast period.

Which is the Leading Region in the Lead-to-Account Matching and Routing Software Market?

The US is the leading region, with an anticipated CAGR of 9.4% through 2032.

Which Segment Leads in the Lead-to-Account Matching and Routing Software Market by Type?

Cloud based leads the market with the projected CAGR of 9.3% through 2032.

What is the Growth Estimated for the Lead-to-Account Matching and Routing Software Market by 2032?

The lead-to-account matching and routing software market is predicted to grow to US$ 2 billion by 2032.

Which Segment Leads in the Lead-to-Account Matching and Routing Software Market by Application?

Large enterprises lead the market with the projected CAGR of 9.4% by 2032.

Table of Content

1. Executive Summary | Lead-to-Account Matching and Routing Software Market

    1.1. Global Market Outlook 

    1.2. Summary of Statistics

    1.3. Key Market Characteristics & Attributes

    1.4. Analysis and Recommendations

2. Market Overview

    2.1. Market Coverage / Taxonomy 

    2.2. Market Definition / Scope / Limitations

3. Market Risks and Trends Assessment 

    3.1. Risk Assessment 

        3.1.1. COVID-19 Crisis and Impact on Demand

        3.1.2. COVID-19 Impact Benchmark with Previous Crisis 

        3.1.3. Impact on Market Value (US$ Million)

        3.1.4. Assessment by Key Countries

        3.1.5. Assessment by Key Market Segments

        3.1.6. Action Points and Recommendation for Suppliers

    3.2. Key Trends Impacting the Market

    3.3. Formulation and Product Development Trends

4. Market Background and Foundation Data Points 

    4.1. Global Market (US$ Million)

    4.2. Market Opportunity Assessment (US$ Million)

        4.2.1. Total Available Market

        4.2.2. Serviceable Addressable Market

        4.2.3. Serviceable Obtainable Market

    4.3. Market Scenario Forecast 

        4.3.1. Demand in Optimistic Scenario

        4.3.2. Demand in Likely Scenario

        4.3.3. Demand in Conservative Scenario 

    4.4. Investment Feasibility Analysis 

        4.4.1. Investment in Established Markets

            4.4.1.1. In Short Term

            4.4.1.2. In Long Term

        4.4.2. Investment in Emerging Markets

            4.4.2.1. In Short Term

            4.4.2.2. In Long Term

    4.5. Forecast Factors - Relevance & Impact 

        4.5.1. Top Companies Historical Growth

        4.5.2. Global Market Growth

        4.5.3. Adoption Rate, By Country

    4.6. Market Dynamics 

        4.6.1. Market Driving Factors and Impact Assessment

        4.6.2. Prominent Market Challenges and Impact Assessment

        4.6.3. Market Opportunities

        4.6.4. Prominent Trends in the Global Market & Their Impact Assessment

5. Key Success Factors 

    5.1. Manufacturers’ Focus on Low Penetration High Growth Markets

    5.2. Banking on with Segments High Incremental Opportunity

    5.3. Peer Benchmarking 

6. Global Market Demand Analysis 2015 to 2021 and Forecast, 2022 to 2032

    6.1. Historical Market Analysis, 2015 to 2021

    6.2. Current and Future Market Projections, 2022 to 2032

    6.3. Y-o-Y Growth Trend Analysis

7. Global Market Value Analysis 2015 to 2021 and Forecast, 2022 to 2032

    7.1. Historical Market Value (US$ Million) Analysis, 2015 to 2021

    7.2. Current and Future Market Value (US$ Million) Projections, 2022 to 2032

        7.2.1. Y-o-Y Growth Trend Analysis

        7.2.2. Absolute $ Opportunity Analysis

8. Global Market Analysis 2015 to 2021 and Forecast 2022 to 2032, By Type

    8.1. Introduction / Key Findings

    8.2. Historical Market Size (US$ Million) Analysis By Type, 2015 to 2021

    8.3. Current and Future Market Size (US$ Million) Analysis and Forecast By Type, 2022 to 2032

        8.3.1. Cloud-based

        8.3.2. On-premises

    8.4. Market Attractiveness Analysis By Type

9. Global Market Analysis 2015 to 2021 and Forecast 2022 to 2032, By Application

    9.1. Introduction / Key Findings

    9.2. Historical Market Size (US$ Million) Analysis By Application, 2015 to 2021

    9.3. Current and Future Market Size (US$ Million) Analysis and Forecast By Application, 2022 to 2032

        9.3.1. Large Enterprises

        9.3.2. SMEs

    9.4. Market Attractiveness Analysis By Application

10. Global Market Analysis 2015 to 2021 and Forecast 2022 to 2032, By Region

    10.1. Introduction

    10.2. Historical Market Size (US$ Million) Analysis By Region, 2015 to 2021

    10.3. Current Market Size (US$ Million) & Analysis and Forecast By Region, 2022 to 2032

        10.3.1. North America

        10.3.2. Latin America

        10.3.3. Europe

        10.3.4. Asia Pacific 

        10.3.5. Middle East and Africa (MEA)

    10.4. Market Attractiveness Analysis By Region

11. North America Market Analysis 2015 to 2021 and Forecast 2022 to 2032

    11.1. Introduction

    11.2. Pricing Analysis

    11.3. Historical Market Value (US$ Million) Trend Analysis By Market Taxonomy, 2015 to 2021

    11.4. Market Value (US$ Million) & Forecast By Market Taxonomy, 2022 to 2032

        11.4.1. By Country

            11.4.1.1. United States of America

            11.4.1.2. Canada

            11.4.1.3. Rest of North America

        11.4.2. By Type

        11.4.3. By Application

    11.5. Market Attractiveness Analysis

        11.5.1. By Country

        11.5.2. By Type

        11.5.3. By Application

12. Latin America Market Analysis 2015 to 2021 and Forecast 2022 to 2032

    12.1. Introduction

    12.2. Pricing Analysis

    12.3. Historical Market Value (US$ Million) Trend Analysis By Market Taxonomy, 2015 to 2021

    12.4. Market Value (US$ Million) & Forecast By Market Taxonomy, 2022 to 2032

        12.4.1. By Country

            12.4.1.1. Brazil

            12.4.1.2. Mexico

            12.4.1.3. Rest of Latin America

        12.4.2. By Type

        12.4.3. By Application

    12.5. Market Attractiveness Analysis

        12.5.1. By Country

        12.5.2. By Type

        12.5.3. By Application

13. Europe Market Analysis 2015 to 2021 and Forecast 2022 to 2032

    13.1. Introduction

    13.2. Pricing Analysis

    13.3. Historical Market Value (US$ Million) Trend Analysis By Market Taxonomy, 2015 to 2021

    13.4. Market Value (US$ Million) & Forecast By Market Taxonomy, 2022 to 2032

        13.4.1. By Country

            13.4.1.1. Germany

            13.4.1.2. France

            13.4.1.3. United Kingdom

            13.4.1.4. Italy

            13.4.1.5. Benelux

            13.4.1.6. Nordic Countries

            13.4.1.7. Rest of Europe

        13.4.2. By Type

        13.4.3. By Application

    13.5. Market Attractiveness Analysis

        13.5.1. By Country

        13.5.2. By Type

        13.5.3. By Application

14. Asia Pacific Market Analysis 2015 to 2021 and Forecast 2022 to 2032

    14.1. Introduction

    14.2. Pricing Analysis

    14.3. Historical Market Value (US$ Million) Trend Analysis By Market Taxonomy, 2015 to 2021

    14.4. Market Value (US$ Million) & Forecast By Market Taxonomy, 2022 to 2032

        14.4.1. By Country

            14.4.1.1. China

            14.4.1.2. Japan

            14.4.1.3. South Korea

            14.4.1.4. Rest of Asia Pacific

        14.4.2. By Type

        14.4.3. By Application

    14.5. Market Attractiveness Analysis

        14.5.1. By Country

        14.5.2. By Type

        14.5.3. By Application

15. Middle East and Africa Market Analysis 2015 to 2021 and Forecast 2022 to 2032

    15.1. Introduction

    15.2. Pricing Analysis

    15.3. Historical Market Value (US$ Million) Trend Analysis By Market Taxonomy, 2015 to 2021

    15.4. Market Value (US$ Million) & Forecast By Market Taxonomy, 2022 to 2032

        15.4.1. By Country

            15.4.1.1. GCC Countries

            15.4.1.2. South Africa

            15.4.1.3. Turkey

            15.4.1.4. Rest of Middle East and Africa

        15.4.2. By Type

        15.4.3. By Application

    15.5. Market Attractiveness Analysis

        15.5.1. By Country

        15.5.2. By Type

        15.5.3. By Application

16. Key Countries Market Analysis 2015 to 2021 and Forecast 2022 to 2032

    16.1. Introduction

        16.1.1. Market Value Proportion Analysis, By Key Countries

        16.1.2. Global Vs. Country Growth Comparison

    16.2. US Market Analysis

        16.2.1. Value Proportion Analysis by Market Taxonomy

        16.2.2. Value & Analysis and Forecast by Market Taxonomy, 2015 to 2032

            16.2.2.1. By Type

            16.2.2.2. By Application

    16.3. Canada Market Analysis

        16.3.1. Value Proportion Analysis by Market Taxonomy

        16.3.2. Value & Analysis and Forecast by Market Taxonomy, 2015 to 2032

            16.3.2.1. By Type

            16.3.2.2. By Application

    16.4. Mexico Market Analysis

        16.4.1. Value Proportion Analysis by Market Taxonomy

        16.4.2. Value & Analysis and Forecast by Market Taxonomy, 2015 to 2032

            16.4.2.1. By Type

            16.4.2.2. By Application

    16.5. Brazil Market Analysis

        16.5.1. Value Proportion Analysis by Market Taxonomy

        16.5.2. Value & Analysis and Forecast by Market Taxonomy, 2015 to 2032

            16.5.2.1. By Type

            16.5.2.2. By Application

    16.6. Germany Market Analysis

        16.6.1. Value Proportion Analysis by Market Taxonomy

        16.6.2. Value & Analysis and Forecast by Market Taxonomy, 2015 to 2032

            16.6.2.1. By Type

            16.6.2.2. By Application

    16.7. France Market Analysis

        16.7.1. Value Proportion Analysis by Market Taxonomy

        16.7.2. Value & Analysis and Forecast by Market Taxonomy, 2015 to 2032

            16.7.2.1. By Type

            16.7.2.2. By Application

    16.8. Italy Market Analysis

        16.8.1. Value Proportion Analysis by Market Taxonomy

        16.8.2. Value & Analysis and Forecast by Market Taxonomy, 2015 to 2032

            16.8.2.1. By Type

            16.8.2.2. By Application

    16.9. BENELUX Market Analysis

        16.9.1. Value Proportion Analysis by Market Taxonomy

        16.9.2. Value & Analysis and Forecast by Market Taxonomy, 2015 to 2032

            16.9.2.1. By Type

            16.9.2.2. By Application

    16.10. UK Market Analysis

        16.10.1. Value Proportion Analysis by Market Taxonomy

        16.10.2. Value & Analysis and Forecast by Market Taxonomy, 2015 to 2032

            16.10.2.1. By Type

            16.10.2.2. By Application

    16.11. Nordic Countries Market Analysis

        16.11.1. Value Proportion Analysis by Market Taxonomy

        16.11.2. Value & Analysis and Forecast by Market Taxonomy, 2015 to 2032

            16.11.2.1. By Type

            16.11.2.2. By Application

    16.12. China Market Analysis

        16.12.1. Value Proportion Analysis by Market Taxonomy

        16.12.2. Value & Analysis and Forecast by Market Taxonomy, 2015 to 2032

            16.12.2.1. By Type

            16.12.2.2. By Application

    16.13. Japan Market Analysis

        16.13.1. Value Proportion Analysis by Market Taxonomy

        16.13.2. Value & Analysis and Forecast by Market Taxonomy, 2015 to 2032

            16.13.2.1. By Type

            16.13.2.2. By Application

    16.14. South Korea Market Analysis

        16.14.1. Value Proportion Analysis by Market Taxonomy

        16.14.2. Value & Analysis and Forecast by Market Taxonomy, 2015 to 2032

            16.14.2.1. By Type

            16.14.2.2. By Application

    16.15. GCC Countries Market Analysis

        16.15.1. Value Proportion Analysis by Market Taxonomy

        16.15.2. Value & Analysis and Forecast by Market Taxonomy, 2015 to 2032

            16.15.2.1. By Type

            16.15.2.2. By Application

    16.16. South Africa Market Analysis

        16.16.1. Value Proportion Analysis by Market Taxonomy

        16.16.2. Value & Analysis and Forecast by Market Taxonomy, 2015 to 2032

            16.16.2.1. By Type

            16.16.2.2. By Application

    16.17. Turkey Market Analysis

        16.17.1. Value Proportion Analysis by Market Taxonomy

        16.17.2. Value & Analysis and Forecast by Market Taxonomy, 2015 to 2032

            16.17.2.1. By Type

            16.17.2.2. By Application

        16.17.3. Competition Landscape and Player Concentration in the Country

17. Market Structure Analysis

    17.1. Market Analysis by Tier of Companies 

    17.2. Market Concentration

    17.3. Market Share Analysis of Top Players

    17.4. Market Presence Analysis

        17.4.1. By Regional Footprint of Players

        17.4.2. Product Footprint by Players

18. Competition Analysis

    18.1. Competition Dashboard

    18.2. Competition Benchmarking

    18.3. Competition Deep Dive 

        18.3.1. LeanData

            18.3.1.1. Overview

            18.3.1.2. Product Portfolio

            18.3.1.3. Sales Footprint

            18.3.1.4. Strategy Overview

        18.3.2. Groove

        18.3.3. RingLead

        18.3.4. Engagio

        18.3.5. Openprise

        18.3.6. Leadspace

        18.3.7. Lane Four

        18.3.8. Terminus

        18.3.9. Bizible

        18.3.10. CaliberMind

        18.3.11. Demandbase

        18.3.12. Traction Complete

19. Assumptions and Acronyms Used

20. Research Methodology

Don't pay for what you don't need

Customize your report by selecting specific countries or regions and save 30%!

List of Tables

Table 1: Global Market Value (US$ Million), By Type, 2015 to 2021

Table 2: Global Market Value (US$ Million), By Type, 2022 to 2032

Table 3: Global Market Value (US$ Million), By Application, 2015 to 2021

Table 4: Global Market Value (US$ Million), By Application, 2022 to 2032

Table 5: Global Market, By Region, 2015 to 2021

Table 6: Global Market, By Region, 2022 to 2032

Table 7: North America Market Value (US$ Million), By Type, 2015 to 2021

Table 8: North America Market Value (US$ Million), By Type, 2022 to 2032

Table 9: North America Market Value (US$ Million), By Application, 2015 to 2021

Table 10: North America Market Value (US$ Million), By Application, 2022 to 2032

Table 11: North America Market, By Country, 2015 to 2021

Table 12: North America Market, By Country, 2022 to 2032

Table 13: Latin America Market Value (US$ Million), By Type, 2015 to 2021

Table 14: Latin America Market Value (US$ Million), By Type, 2022 to 2032

Table 15: Latin America Market Value (US$ Million), By Application, 2015 to 2021

Table 16: Latin America Market Value (US$ Million), By Application, 2022 to 2032

Table 17: Latin America Market, By Country, 2015 to 2021

Table 18: Latin America Market, By Country, 2022 to 2032

Table 19: Europe Market Value (US$ Million), By Type, 2015 to 2021

Table 20: Europe Market Value (US$ Million), By Type, 2022 to 2032

Table 21: Europe Market Value (US$ Million), By Application, 2015 to 2021

Table 22: Europe Market Value (US$ Million), By Application, 2022 to 2032

Table 23: Europe Market, By Country, 2015 to 2021

Table 24: Europe Market, By Country, 2022 to 2032

Table 25: Asia Pacific Market Value (US$ Million), By Type, 2015 to 2021

Table 26: Asia Pacific Market Value (US$ Million), By Type, 2022 to 2032

Table 27: Asia Pacific Market Value (US$ Million), By Application, 2015 to 2021

Table 28: Asia Pacific Market Value (US$ Million), By Application, 2022 to 2032

Table 29: Asia Pacific Market, By Country, 2015 to 2021

Table 30: Asia Pacific Market, By Country, 2022 to 2032

Table 31: MEA Market Value (US$ Million), By Type, 2015 to 2021

Table 32: MEA Market Value (US$ Million), By Type, 2022 to 2032

Table 33: MEA Market Value (US$ Million), By Application, 2015 to 2021

Table 34: MEA Market Value (US$ Million), By Application, 2022 to 2032

Table 35: MEA Market, By Country, 2015 to 2021

Table 36: MEA Market, By Country, 2022 to 2032

Table 37: Global Market Incremental $ Opportunity, By Type, 2015 to 2021

Table 38: Global Market Incremental $ Opportunity, By Application, 2022 to 2032

Table 39: Global Market Incremental $ Opportunity, By Region, 2022 to 2032

Table 40: North America Market Incremental $ Opportunity, By Type, 2015 to 2021

Table 41: North America Market Incremental $ Opportunity, By Application, 2022 to 2032

Table 42: North America Market Incremental $ Opportunity, By Country, 2022 to 2032

Table 43: Latin America Market Incremental $ Opportunity, By Type, 2015 to 2021

Table 44: Latin America Market Incremental $ Opportunity, By Application, 2022 to 2032

Table 45: Latin America Market Incremental $ Opportunity, By Country, 2022 to 2032

Table 46: Europe Market Incremental $ Opportunity, By Type, 2015 to 2021

Table 47: Europe Market Incremental $ Opportunity, By Application, 2022 to 2032

Table 48: Europe Market Incremental $ Opportunity, By Country, 2022 to 2032

Table 49: Asia Pacific Market Incremental $ Opportunity, By Type, 2015 to 2021

Table 50: Asia Pacific Market Incremental $ Opportunity, By Application, 2022 to 2032

Table 51: Asia Pacific Market Incremental $ Opportunity, By Country, 2022 to 2032

Table 52: MEA Market Incremental $ Opportunity, By Type, 2015 to 2021

Table 53: MEA Market Incremental $ Opportunity, By Application, 2022 to 2032

Table 54: MEA Market Incremental $ Opportunity, By Country, 2022 to 2032
Sudip Saha
Sudip Saha

Principal Consultant

Talk to Analyst

Find your sweet spots for generating winning opportunities in this market.

List of Charts

Figure 1: Global Market Value (US$ Million) and Year-on-Year Growth, 2015 to 2032

Figure 2: Global Market Absolute $ Historical Gain (2015 to 2021) and Opportunity (2022 to 2032), US$ Million

Figure 3: Global Market Share, By Type, 2022 & 2032

Figure 4: Global Market Y-o-Y Growth Projections, By Type - 2022 to 2032

Figure 5: Global Market Attractiveness Index, By Type - 2022 to 2032

Figure 6: Global Market Share, By Application, 2022 & 2032

Figure 7: Global Market Y-o-Y Growth Projections, By Application - 2022 to 2032

Figure 8: Global Market Attractiveness Index, By Application - 2022 to 2032

Figure 9: Global Market Share, By Region, 2022 & 2032

Figure 10: Global Market Y-o-Y Growth Projections, By Region - 2022 to 2032

Figure 11: Global Market Attractiveness Index, By Region - 2022 to 2032

Figure 12: North America Market Value (US$ Million) and Year-on-Year Growth, 2015 to 2032

Figure 13: North America Market Absolute $ Opportunity Historical (2015 to 2021) and Forecast Period (2022 to 2032), US$ Million

Figure 14: North America Market Share, By Type, 2022 & 2032

Figure 15: North America Market Y-o-Y Growth Projections, By Type - 2022 to 2032

Figure 16: North America Market Attractiveness Index, By Type - 2022 to 2032

Figure 17: North America Market Share, By Application, 2022 & 2032

Figure 18: North America Market Y-o-Y Growth Projections, By Application - 2022 to 2032

Figure 19: North America Market Attractiveness Index, By Application - 2022 to 2032

Figure 20: North America Market Share, By Country, 2022 & 2032

Figure 21: North America Market Y-o-Y Growth Projections, By Country - 2022 to 2032

Figure 22: North America Market Attractiveness Index, By Country - 2022 to 2032

Figure 23: Latin America Market Value (US$ Million) and Year-on-Year Growth, 2015 to 2032

Figure 24: Latin America Market Absolute $ Opportunity Historical (2015 to 2021) and Forecast Period (2022 to 2032), US$ Million

Figure 25: Latin America Market Share, By Type, 2022 & 2032

Figure 26: Latin America Market Y-o-Y Growth Projections, By Type - 2022 to 2032

Figure 27: Latin America Market Attractiveness Index, By Type - 2022 to 2032

Figure 28: Latin America Market Share, By Application, 2022 & 2032

Figure 29: Latin America Market Y-o-Y Growth Projections, By Application - 2022 to 2032

Figure 30: Latin America Market Attractiveness Index, By Application - 2022 to 2032

Figure 31: Latin America Market Share, By Country, 2022 & 2032

Figure 32: Latin America Market Y-o-Y Growth Projections, By Country - 2022 to 2032

Figure 33: Latin America Market Attractiveness Index, By Country - 2022 to 2032

Figure 34: Europe Market Value (US$ Million) and Year-on-Year Growth, 2015 to 2032

Figure 35: Europe Market Absolute $ Opportunity Historical (2015 to 2021) and Forecast Period (2022 to 2032), US$ Million

Figure 36: Europe Market Share, By Type, 2022 & 2032

Figure 37: Europe Market Y-o-Y Growth Projections, By Type - 2022 to 2032

Figure 38: Europe Market Attractiveness Index, By Type - 2022 to 2032

Figure 39: Europe Market Share, By Application, 2022 & 2032

Figure 40: Europe Market Y-o-Y Growth Projections, By Application - 2022 to 2032

Figure 41: Europe Market Attractiveness Index, By Application - 2022 to 2032

Figure 42: Europe Market Share, By Country, 2022 & 2032

Figure 43: Europe Market Y-o-Y Growth Projections, By Country - 2022 to 2032

Figure 44: Europe Market Attractiveness Index, By Country - 2022 to 2032

Figure 45: MEA Market Value (US$ Million) and Year-on-Year Growth, 2015 to 2032

Figure 46: MEA Market Absolute $ Opportunity Historical (2015 to 2021) and Forecast Period (2022 to 2032), US$ Million

Figure 47: MEA Market Share, By Type, 2022 & 2032

Figure 48: MEA Market Y-o-Y Growth Projections, By Type - 2022 to 2032

Figure 49: MEA Market Attractiveness Index, By Type - 2022 to 2032

Figure 50: MEA Market Share, By Application, 2022 & 2032

Figure 51: MEA Market Y-o-Y Growth Projections, By Application - 2022 to 2032

Figure 52: MEA Market Attractiveness Index, By Application - 2022 to 2032

Figure 53: MEA Market Share, By Country, 2022 & 2032

Figure 54: MEA Market Y-o-Y Growth Projections, By Country - 2022 to 2032

Figure 55: MEA Market Attractiveness Index, By Country - 2022 to 2032

Figure 56: Asia Pacific Market Value (US$ Million) and Year-on-Year Growth, 2015 to 2032

Figure 57: Asia Pacific Market Absolute $ Opportunity Historical (2015 to 2021) and Forecast Period (2022 to 2032), US$ Million

Figure 58: Asia Pacific Market Share, By Type, 2022 & 2032

Figure 59: Asia Pacific Market Y-o-Y Growth Projections, By Type - 2022 to 2032

Figure 60: Asia Pacific Market Attractiveness Index, By Type - 2022 to 2032

Figure 61: Asia Pacific Market Share, By Application, 2022 & 2032

Figure 62: Asia Pacific Market Y-o-Y Growth Projections, By Application - 2022 to 2032

Figure 63: Asia Pacific Market Attractiveness Index, By Application - 2022 to 2032

Figure 64: Asia Pacific Market Share, By Country, 2022 & 2032

Figure 65: Asia Pacific Market Y-o-Y Growth Projections, By Country - 2022 to 2032

Figure 66: Asia Pacific Market Attractiveness Index, By Country - 2022 to 2032

Figure 67: US Market Value (US$ Million) and Forecast, 2022 to 2032

Figure 68: US Market Share, By Type, 2021

Figure 69: US Market Share, By Application, 2021

Figure 70: Canada Market Value (US$ Million) and Forecast, 2022 to 2032

Figure 71: Canada Market Share, By Type, 2021

Figure 72: Canada Market Share, By Application, 2021

Figure 73: Brazil Market Value (US$ Million) and Forecast, 2022 to 2032

Figure 74: Brazil Market Share, By Type, 2021

Figure 75: Brazil Market Share, By Application, 2021

Figure 76: Mexico Market Value (US$ Million) and Forecast, 2022 to 2032

Figure 77: Mexico Market Share, By Type, 2021

Figure 78: Mexico Market Share, By Application, 2021

Figure 79: Germany Market Value (US$ Million) and Forecast, 2022 to 2032

Figure 80: Germany Market Share, By Type, 2021

Figure 81: Germany Market Share, By Application, 2021

Figure 82: UK Market Value (US$ Million) and Forecast, 2022 to 2032

Figure 83: UK Market Share, By Type, 2021

Figure 84: UK Market Share, By Application, 2021

Figure 85: France Market Value (US$ Million) and Forecast, 2022 to 2032

Figure 86: France Market Share, By Type, 2021

Figure 87: France Market Share, By Application, 2021

Figure 88: Italy Market Value (US$ Million) and Forecast, 2022 to 2032

Figure 89: Italy Market Share, By Type, 2021

Figure 90: Italy Market Share, By Application, 2021

Figure 91: BENELUX Market Value (US$ Million) and Forecast, 2022 to 2032

Figure 92: BENELUX Market Share, By Type, 2021

Figure 93: BENELUX Market Share, By Application, 2021

Figure 94: Nordic Countries Market Value (US$ Million) and Forecast, 2022 to 2032

Figure 95: Nordic Countries Market Share, By Type, 2021

Figure 96: Nordic Countries Market Share, By Application, 2021

Figure 97: China Market Value (US$ Million) and Forecast, 2022 to 2032

Figure 98: China Market Share, By Type, 2021

Figure 99: China Market Share, By Application, 2021

Figure 100: Japan Market Value (US$ Million) and Forecast, 2022 to 2032

Figure 101: Japan Market Share, By Type, 2021

Figure 102: Japan Market Share, By Application, 2021

Figure 103: South Korea Market Value (US$ Million) and Forecast, 2022 to 2032

Figure 104: South Korea Market Share, By Type, 2021

Figure 105: South Korea Market Share, By Application, 2021

Figure 106: GCC Countries Market Value (US$ Million) and Forecast, 2022 to 2032

Figure 107: GCC Countries Market Share, By Type, 2021

Figure 108: GCC Countries Market Share, By Application, 2021

Figure 109: South Africa Market Value (US$ Million) and Forecast, 2022 to 2032

Figure 110: South Africa Market Share, By Type, 2021

Figure 111: South Africa Market Share, By Application, 2021

Figure 112: Turkey Market Value (US$ Million) and Forecast, 2022 to 2032

Figure 113: Turkey Market Share, By Type, 2021

Figure 114: Turkey Market Share, By Application, 2021

Recommendations

Technology

LTE and 5G Market

Published : July 2023

Technology

Metrology Software Market

Published : June 2023

Technology

MEA Enterprise Software Market

Published : September 2022

Technology

Poland IT Software and Service Market

Published : January 2015

Explore Technology Insights

View Reports

Lead-to-Account Matching and Routing Software Market