3PL Software Market
Market Insights on 3PL Software covering sales outlook, demand forecast & up-to-date key trends
3PL Software Market By Mode of Transport, Service Type, Industry & Region - Forecast 2022 - 2032
3PL Software Market Outlook (2022-2032)
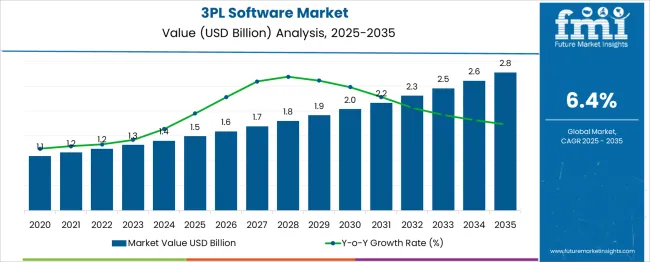
[301 Pages Report] The global 3PL market size was valued at US$ 1.2 Billion in 2021 and is projected to grow at a compound annual growth rate of 6.4% reaching US$ 2.3 Billion by 2032 from US$ 1.24 Billion in 2022. Considering the development of the e-commerce industry and a desire to improve business efficiency, along with the emergence of the internet, contribute to the global 3PL software market.
"The multi-fold growth of warehouse management systems and the adoption of new technologies such as artificial intelligence and the internet of things through industries will further spur growth in the market".
The efficient management of supply chains is crucial to the business growth. As supply chain management and logistics become more complex, new locations, manufacturing methods, expanding customer bases, and meeting customer expectations bring about new challenges in the market.
Attributes |
Details |
3PL Software Market CAGR (2022-2032) |
6.4% |
3PL Software Market Size (2022) |
1.24 Billion |
3PL Software Market Size (2032) |
2.3 Billion |
In-house solutions are often the choice of some businesses, but they are not always the most cost- and time-effective solutions. The bottom line is adversely impacted by failures or mismanagement, which hampers growth and deteriorates customer satisfaction.
With technology, companies like third-party logistics can optimize transportation, warehouse operations, and customer relationships through tools like electronic data interchange (EDI) and application programming interfaces (API). A COVID-19 shutdown affected the global market, negatively affecting the logistic sector.
Economic activities in many countries started to recover and partially adapted to pandemic restrictions. It is predicted that the global economy will remain below the levels seen prior to the pandemic for a prolonged period of time, despite the recovery from COVID-19's devastation. As a result of the pandemic, global debt has gotten worse. The slowdown will also likely be steeper than expected over the next decade.
Let us know your requirement to get
100% FREE customization
Which Are Some Prominent Drivers Influencing 3PL Software Market Growth?
A new era of technologies is transforming the dynamics of the third-party logistics industry. Companies are adopting an innovative, customer-centric, and agile approach to supply chain management due to advanced data collection capabilities, warehouse automation, and digitalization of the entire supply chain to the market.
Due to these developments, 3PL companies have developed technologically advanced methods to gain a competitive advantage by investing in blockchain technologies, mobile technology, and software designed for 3PL companies.
Delivery logistics businesses are in high demand in the market due to the growth of online businesses. As internet and smartphone usage continues to grow, online payment apps will grow as well, which will lead to steady growth in for 3PL software market over the next few years.
Market growth for e-commerce logistics has been further fueled by changes in consumer lifestyle, economic growth, and preferences for shopping at their fingertips has all increased 3PL software growth in the market. Further, the increased level of globalization has led to an increase in manufacturing activities around the world. 3PL services will become increasingly important in order to maintain it effectively.
The scope and market share of 3PL companies is predicted to increase, since supply chain productivity can be improved, along with cost and reliability gains, with the help of 3PL companies' expertise in management and information technology.
Moreover, the growing share of e-tailers as well as the increasing number of reverse logistics operations despite the shifting demand patterns for third-party logistics are two major factors driving the growth of this market. Despite this, the inability to directly control logistics services and the possibility of losing reputation are the major obstacles to the growth of this sector.
How Do 3PL Software Vendors Deal With Current Technological Challenges?
Regulatory issues, limited infrastructure, and a shortage of logistics experts hinder the growth of the market. Increasing chances of business downtime due to software installation problems have hampered market growth. High initial expenses and the lack of trained professionals can hinder the growth of this market. Virtualized automation is experiencing limited market growth due to insufficient tools and methods available to deal with synchronization issues.
An organization that uses third-party logistics services has to depend on the competence, honesty, and reliability of the providers. This scenario involves a manufacturer relying on a 3PL, which yields a lack of direct control over the process.
Furthermore, the manufacturer cannot monitor the activities taking place in the warehouse, which might jeopardize the quality of the products. Thus, manufacturers' inability to control logistics services hinders the growth of the 3 PL software market.
Increasing online orders as well as increasing traffic in the 3PL software industry has hindered the growth of the market. Technology advancements, the constantly changing business environment, economic pressures, and regulatory compliance are some of the challenges faced by the 3PL software market.
Among other challenges facing the market, the market is struggling with capacity constraints, a lack of understanding of energy consumption, limitations on network capacity, and budget restrictions for energy use.
Find your sweet spots for generating winning opportunities in this market.
Talk to AnalystComparative View Of 3PL Software Market
3PL Software:
Attributes |
3PL Software |
CAGR (2022-2032) |
6.4% |
Growth Factor |
Globalization is attributed in part to dynamic economic conditions and global economic progress. The advancement of globalization has led to different trade-related activities becoming more prevalent in the past decade. |
Opportunity |
The continued growth of the e-commerce industry is expected to Create Huge Opportunities for this Market. |
Key Trends |
Retailers and manufacturers are increasingly focusing their attention on their core business activities, as well as subcontracting activities, such as logistics, in which they, have witnessed in the market. |
IoT Spend by Logistics Industry:
Attributes |
IoT Spend by Logistics Industry |
CAGR (2022-2032) |
11.2% |
Growth Factor |
A growing market for high-tech vehicles and a growing number of connected devices are driving the market. |
Opportunity |
The growing supply capacities to meet customer needs on a local and global basis, along with promising industrialization prospects in emerging economies, are expected to lead to massive business opportunities in the market. |
Key Trends |
In the cargo logistics industry, digitization is a key trend aimed at capturing the IoT global market in the future market. |
E-Commerce Logistics:
Attributes |
E-Commerce Logistics |
CAGR (2022-2032) |
17.8% |
Growth Factor |
The adoption of advanced technologies, including smartphones and the internet, is responsible for the growth of the logistics market in the e-commerce sector. |
Opportunity |
A growing demand for e-commerce orders that demand quick delivery of products will push shippers for one day delivery demand in the market. |
Key Trends |
E-commerce logistics will see a rise in supply chain automation and digitization, enabling deliveries of larger goods to be made so at lower costs. |
Considering the continuous improvements in IoT and technologies across the globe, the 3PL software market is likely to experience significant growth during the forecast period. The software market for 3PLs has undergone several changes that have created a large number of opportunities for companies in the logistics industry.
Furthermore, the growing demand for cloud-based solutions and the ability to improve operational efficiency and automate processes are other factors driving the market growth for 3PL software the market. The outsourcing of logistics operations to 3PL companies can be extremely beneficial to businesses as they expand.
To optimize worldwide shipping operations, such companies handle global logistics functions such as purchases, cargo handling, customs and export, and distribution through the usage of 3PL software. The market demand for such software is increasing.
Increasing emphasis on reducing costs and improving operations are expected to drive 3PL software growth in the future. There are multiple players operating in the market of 3PL software. As a result, there is a great deal of fragmentation within the sector.
Logistical automation is predicted to be a crucial part of the growth of the market in the future. Using robots as part of warehouse automation and unloading dock services improves the efficiency of order fulfillment services.
Segmental Analysis Of 3PL Software Market
By Mode of Transport, 3PL Software to be extensively used for Roadways
The road transport market is expected to grow at the fastest rate as compared to other transport modes. With public-private partnerships and a focus on logistics infrastructure, roadways will account for the biggest share in 2022. The global market is expected to grow at a CAGR of 6.5% during the forecast period.
The roadways segment has the largest market share and is expected to keep it for the foreseeable future. As road infrastructure has improved and cross-border trade between landlocked countries has grown, so has the need for roadways in 3PL industries. Additionally, 3PL service providers provide innovative delivery solutions to first-party companies by utilizing the latest software tools such as TMS and WMS in the market.
Increasing demand for transportation route planning, contract management, and tariff surcharge management are all these factors to propel market demand for the 3PL software market.
The ability to view shipment status in real-time and the capability to synchronize your data with your ERP suite have prompted the market for three-party logistics software in the market. Moreover, the software helps workers coordinate activities like unloading and quality assurance checks with ease.
Which industry has the greatest potential within the 3PL Software Market?
As a whole, the technological industry is seen to grow the most rapidly in the market during the forecast period. The market is expected to grow at a CAGR of 6.3% during the forecast period. Utilization of emerging new technologies that can make a positive impact on the 3PL business and establish a positive trend for market growth with greater frequency will grow the market of the 3PL software.
With the growing need for more productivity in the industry, the market for third-party logistics software is growing rapidly for these businesses as well. Using advanced technology software reduces the operating costs of a company in the market by achieving efficiencies in both the operational and financial side of the business, resulting in huge market demand for 3PL software in the market.
Technology has paved the way for 3PL software to feature end-to-end transparency throughout the process of delivering products and services to customers. Using 3PL software, customers can also record and track the entire delivery process and shipment with the help of modern technology.
As the world's population grows, the existence and further development of modern software systems have allowed the integration and automation of logistics to become easier to handle with the growth.
An unified Market Research Subscription Platform, built for today’s disparate research needs.
3PL Software Regional Outlook
How Opportunistic is the 3PL Software market in North America?
The North American market is expected to generate US$ 976.2 Million in revenue over the forecast period due to the proliferation of highly developed IT industries and growth of economies, such as those in the United States, and Canada.
Increase in partnership among leading logistics service providers to incorporate new projects. Moreover, the establishment of a partnership and the development of new services to meet the needs of the countries further fuel the regional market growth.
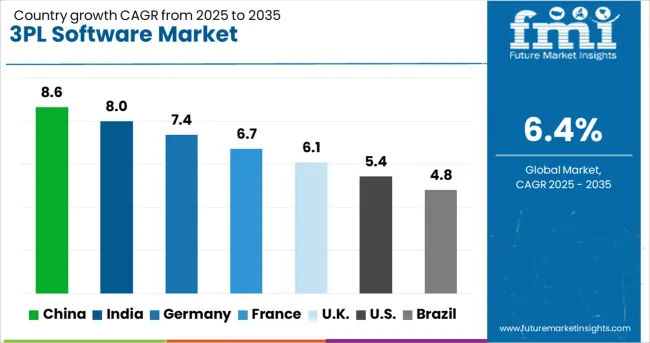
By 2032, the U.S 3PL software market is expected to grow at a CAGR of 6.2% during the forecast period. With the rapid development of cloud-based solutions, the influx of IoT solutions, and the presence of a large number of companies, 3PL software has experienced positive growth in this region. Because of early adoption of software and subsequent technological advancements in warehouses, the U.S. 3PL software market is experiencing rapid growth in this region.
What factors influence the growth of the 3PL software industry in Asia Pacific?
Market growth for 3PL IoT technologies is expected to be strongest in Asia-Pacific region during the forecast period. For the 3PL software development market, APAC is forecast to grow at the fastest rate during the forecast period.
China is expected to be valued at US$ 174.6 Million with a CAGR of 6.1% during the forecast period. Furthermore, China accounts for 32% of revenue growth in the region. The rapid technological advancements and the increased number of retail and logistics companies in these regions has created a market for third-party logistics software in the market.
Region has seen a steady growth fueled by companies in the e-commerce industry incorporating warehouse projects and their solutions into their supply chain.
The Japanese market is expected to grow at a CAGR of 5.1% over the forecast period. South Korea's market is projected to grow at a CAGR of 4.1% during the forecast period. Having an impact on reducing operational expenses, the increasing demand for cost-savings and supply chain operations in the market is expected to grow the market in this region.
How will Europe benefit from the growth of the 3PL software market?
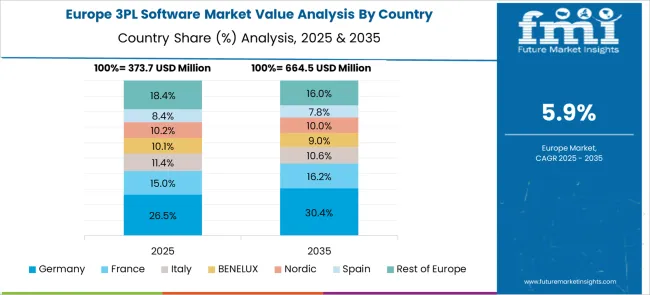
European exports are expected to increase by US$ 599.8 Million during forecasted period. As global trade activity grows, companies recognize that outsourcing their logistics service to another company is an economical option, as there is a continuous pressure on travel reliability and efficiency and managing complexities of in-house logistics without increasing overhead costs.
During the forecast period, the 3PL software market in the UK is expected to grow at a compound annual growth rate of 5.6%. Warehouse expansions and global presence of logistics firms in the region will be two major factors driving the market for IoT in the logistics industry. Increasing investments for the advancement of IoT technology are helping the technology, which is widely used in logistics businesses, gain traction on the market.
What is the Level of Competition for 3PL Software in the Market?
Through strategic partnerships, manufacturers can increase production and meet consumer demand, increasing both their revenues and market share. The introduction of new products and technologies will allow end-users to reap the benefits of new technologies. Increasing the company's production capacity is one of the potential benefits of a strategic partnership.
Recent Developments In The 3PL Software Market
- In November 2021, Gloden Egg Solutions, was acquired by ShipHero. The acquisition has resulted in ShipHero having a strategically located warehouse for use by its fulfillment and 3PL clients in the northwest quarter of the United States.
- In December 2021, 3PL Central acquired CIO Technologies, and many of the company's products, including CartRover, during the acquisition. CartRover is the latest addition to the 3PL Central product line, adding integration expertise that ensures seamless data flow from external commerce engines. The system integrates disparate systems to streamline fulfillment processes for 3PL Warehouse Manager users, allowing them to seamlessly integrate their systems with any of the more than 100 e-commerce carts and marketplaces that CartRover supports.
- In January 2022, ShipMonk announced the acquisition of Ruby Has Fulfillment. The acquisition will enable ShipMonk to further expand its operations in the United States as well as internationally in Canada and the United Kingdom, thus complementing its enterprise fulfillment opportunities to meet the needs of the growing direct-to-consumer (DTC) brands.
Key Players
- C.H. Robinson Worldwide, Inc.
- DB Schenker
- DHL International GMBH
- FedEx Corporation
- KUEHNE+AGEL Inc.
- Maersk
- Nippon Express
- Panalpina World Transport Ltd.
- Union Pacific Railroad
- United Parcel Service
Key Segments Covered In The 3PL Software Market Report
3PL Software Market by Mode of Transport:
- 3PL Software for Railways
- 3PL Software for Roadways
- 3PL Software for Waterways
- 3PL Software for Airways
3PL Software Market by Service Type:
- 3PL Software for Dedicated Contract Carriage (DCC)
- 3PL Software for Domestic Transportation Management
- 3PL Software for International Transportation Management
- 3PL Software for Warehousing & Distribution
- 3PL Software for Other Service Types
3PL Software Market by Industry:
- 3PL Software for the Technological Industry
- 3PL Software for the Automotive Industry
- 3PL Software for the Retailing Industry
- 3PL Software for the Elements Industry
- 3PL Software for the Food & Groceries Industry
- 3PL Software for the Healthcare Industry
- 3PL Software for Other Industries
3PL Software Market by Region:
- North America 3PL Software Market
- Latin America 3PL Software Market
- Europe 3PL Software Market
- Asia Pacific 3PL Software Market
- Middle East & Africa 3PL Software Market
Frequently Asked Questions
The 3PL software market is expected to grow at a steady CAGR of 6.4% over the forecast period
The global market for 3PL software was valued at US$ 1.20 Billion as of 2021
Roadways is projected to have the highest market with a CAGR of 6.5% during the forecast period
U.S leads the global 3PL software market with a CAGR of 6.2% during the forecast period
The market for 3PL software is expected to grow by nearly US$ 2.3 Billion by 2032
Technological industry is expected to drive the market for 3PL software over the next few years
China is expected to garner US$ 174.6 Million while expanding at a 6.1% CAGR from 2022 to 2032
According to the market, 3PL software had an absolute dollar growth of US$ 1.1 Billion
1. Executive Summary
1.1. Global Market Outlook
1.2. Summary of Statistics
1.3. Key Market Characteristics & Attributes
1.4. FMI Analysis and Recommendations
2. Market Overview
2.1. Market Coverage / Taxonomy
2.2. Market Definition / Scope / Limitations
3. Market Risks and Trends Assessment
3.1. Risk Assessment
3.1.1. COVID-19 Crisis and Impact on 3PL Software Demand
3.1.2. COVID-19 Impact Benchmark with Previous Crisis
3.1.3. Impact on Market Value (US$ Mn)
3.1.4. Assessment by Key Countries
3.1.5. Assessment by Key Market Segments
3.1.6. Action Points and Recommendation for Suppliers
3.2. Key Trends Impacting the Market
3.3. Formulation and Product Development Trends
4. Market Background
4.1. 3PL Software Management Market, by Key Countries
4.2. 3PL Software Management Market Opportunity Assessment (US$ Mn)
4.2.1. Total Available Market
4.2.2. Serviceable Addressable Market
4.2.3. Serviceable Obtainable Market
4.3. Market Scenario Forecast
4.3.1. Demand in optimistic Scenario
4.3.2. Demand in Likely Scenario
4.3.3. Demand in Conservative Scenario
4.4. Investment Feasibility Analysis
4.4.1. Investment in Established Markets
4.4.1.1. In Short Term
4.4.1.2. In Long Term
4.4.2. Investment in Emerging Markets
4.4.2.1. In Short Term
4.4.2.2. In Long Term
4.5. Forecast Factors - Relevance & Impact
4.5.1. Top Companies Historical Growth
4.5.2. Growth in Automation, By Country
4.5.3. 3PL Software Management Adoption Rate, By Country
4.6. Market Dynamics
4.6.1. Market Driving Factors and Impact Assessment
4.6.2. Prominent Market Challenges and Impact Assessment
4.6.3. 3PL Software Management Market Opportunities
4.6.4. Prominent Trends in the Global Market & Their Impact Assessment
5. Key Success Factors
5.1. Manufacturers’ Focus on Low Penetration High Growth Markets
5.2. Banking on with Segments High Incremental Opportunity
5.3. Peer Benchmarking
6. Global 3PL Software Market Demand Analysis 2015-2021 and Forecast, 2022-2032
6.1. Historical Market Analysis, 2015-2021
6.2. Current and Future Market Projections, 2022-2032
6.3. Y-o-Y Growth Trend Analysis
7. Global 3PL Software Market Value Analysis 2015-2021 and Forecast, 2022-2032
7.1. Historical Market Value (US$ Mn) Analysis, 2015-2021
7.2. Current and Future Market Value (US$ Mn) Projections, 2022-2032
7.2.1. Y-o-Y Growth Trend Analysis
7.2.2. Absolute $ Opportunity Analysis
8. Global 3PL Software Market Analysis 2015-2021 and Forecast 2022-2032, By Mode of Transport
8.1. Introduction / Key Findings
8.2. Historical Market Size (US$ Mn) Analysis By Mode of Transport, 2015-2021
8.3. Current and Future Market Size (US$ Mn) Analysis and Forecast By Mode of Transport, 2022-2032
8.3.1. Railways
8.3.2. Roadways
8.3.3. Waterways
8.3.4. Airways
8.4. Market Attractiveness Analysis By Mode of Transport
9. Global 3PL Software Market Analysis 2015-2021 and Forecast 2022-2032, By Service Type
9.1. Introduction / Key Findings
9.2. Historical Market Size (US$ Mn) Analysis By Service Type, 2015-2021
9.3. Current and Future Market Size (US$ Mn) Analysis and Forecast By Service Type, 2022-2032
9.3.1. Dedicated Contract Carriage (DCC)
9.3.2. Domestic Transportation Management
9.3.3. International Transportation Management
9.3.4. Warehousing &Distribution
9.3.5. Others
9.4. Market Attractiveness Analysis By Service Type
10. Global 3PL Software Market Analysis 2015-2021 and Forecast 2022-2032, By Industry
10.1. Introduction / Key Findings
10.2. Historical Market Size (US$ Mn) Analysis By Industry, 2015-2021
10.3. Current and Future Market Size (US$ Mn) Analysis and Forecast By Industry, 2022-2032
10.3.1. Technological
10.3.2. Automotive
10.3.3. Retailing
10.3.4. Elements
10.3.5. Food & Groceries
10.3.6. Healthcare
10.3.7. Others
10.4. Market Attractiveness Analysis By Industry
11. Global 3PL Software Market Analysis 2015-2021 and Forecast 2022-2032, By Region
11.1. Introduction
11.2. Historical Market Size (US$ Mn) Analysis By Region, 2015-2021
11.3. Current Market Size (US$ Mn) & Analysis and Forecast By Region, 2022-2032
11.3.1. North America
11.3.2. Latin America
11.3.3. Europe
11.3.4. Asia Pacific
11.3.5. Middle East and Africa (MEA)
11.4. Market Attractiveness Analysis By Region
12. North America 3PL Software Market Analysis 2015-2021 and Forecast 2022-2032
12.1. Introduction
12.2. Pricing Analysis
12.3. Historical Market Size (US$ Mn) Trend Analysis By Market Taxonomy, 2015-2021
12.4. Market Size (US$ Mn) & Forecast By Market Taxonomy, 2022-2032
12.4.1. By Country
12.4.1.1. U.S.
12.4.1.2. Canada
12.4.1.3. Rest of North America
12.4.2. By Mode of Transport
12.4.3. By Industry
12.4.4. By Service Type
12.5. Market Attractiveness Analysis
12.5.1. By Country
12.5.2. By Mode of Transport
12.5.3. By Industry
12.5.4. By Service Type
13. Latin America 3PL Software Market Analysis 2015-2021 and Forecast 2022-2032
13.1. Introduction
13.2. Pricing Analysis
13.3. Historical Market Size (US$ Mn) Trend Analysis By Market Taxonomy, 2015-2021
13.4. Market Size (US$ Mn) & Forecast By Market Taxonomy, 2022-2032
13.4.1. By Country
13.4.1.1. Brazil
13.4.1.2. Mexico
13.4.1.3. Rest of Latin America
13.4.2. By Mode of Transport
13.4.3. By Industry
13.4.4. By Service Type
13.5. Market Attractiveness Analysis
13.5.1. By Country
13.5.2. By Mode of Transport
13.5.3. By Industry
13.5.4. By Service Type
14. Europe 3PL Software Market Analysis 2015-2021 and Forecast 2022-2032
14.1. Introduction
14.2. Pricing Analysis
14.3. Historical Market Size (US$ Mn) Trend Analysis By Market Taxonomy, 2015-2021
14.4. Market Size (US$ Mn) & Forecast By Market Taxonomy, 2022-2032
14.4.1. By Country
14.4.1.1. Germany
14.4.1.2. France
14.4.1.3. U.K.
14.4.1.4. Italy
14.4.1.5. Benelux
14.4.1.6. Nordic Countries
14.4.1.7. Rest of Europe
14.4.2. By Mode of Transport
14.4.3. By Industry
14.4.4. By Service Type
14.5. Market Attractiveness Analysis
14.5.1. By Country
14.5.2. By Mode of Transport
14.5.3. By Industry
14.5.4. By Service Type
15. Asia Pacific 3PL Software Market Analysis 2015-2021 and Forecast 2022-2032
15.1. Introduction
15.2. Pricing Analysis
15.3. Historical Market Size (US$ Mn) Trend Analysis By Market Taxonomy, 2015-2021
15.4. Market Size (US$ Mn) & Forecast By Market Taxonomy, 2022-2032
15.4.1. By Country
15.4.1.1. China
15.4.1.2. Japan
15.4.1.3. South Korea
15.4.1.4. Rest of Asia Pacific
15.4.2. By Mode of Transport
15.4.3. By Industry
15.4.4. By Service Type
15.5. Market Attractiveness Analysis
15.5.1. By Country
15.5.2. By Mode of Transport
15.5.3. By Industry
15.5.4. By Service Type
16. Middle East and Africa 3PL Software Market Analysis 2015-2021 and Forecast 2022-2032
16.1. Introduction
16.2. Pricing Analysis
16.3. Historical Market Size (US$ Mn) Trend Analysis By Market Taxonomy, 2015-2021
16.4. Market Size (US$ Mn) & Forecast By Market Taxonomy, 2022-2032
16.4.1. By Country
16.4.1.1. GCC Countries
16.4.1.2. South Africa
16.4.1.3. Turkey
16.4.1.4. Rest of Middle East and Africa
16.4.2. By Mode of Transport
16.4.3. By Industry
16.4.4. By Service Type
16.5. Market Attractiveness Analysis
16.5.1. By Country
16.5.2. By Mode of Transport
16.5.3. By Industry
16.5.4. By Service Type
17. Key Countries 3PL Software Market Analysis 2015-2021 and Forecast 2022-2032
17.1. Introduction
17.1.1. Market Value Proportion Analysis, By Key Countries
17.1.2. Global Vs. Country Growth Comparison
17.2. US 3PL Software Market Analysis
17.2.1. Value Proportion Analysis by Market Taxonomy
17.2.2. Value & Analysis and Forecast by Market Taxonomy, 2015-2032
17.2.2.1. By Mode of Transport
17.2.2.2. By Industry
17.2.2.3. By Service Type
17.3. Canada 3PL Software Market Analysis
17.3.1. Value Proportion Analysis by Market Taxonomy
17.3.2. Value & Analysis and Forecast by Market Taxonomy, 2015-2032
17.3.2.1. By Mode of Transport
17.3.2.2. By Industry
17.3.2.3. By Service Type
17.4. Mexico 3PL Software Market Analysis
17.4.1. Value Proportion Analysis by Market Taxonomy
17.4.2. Value & Analysis and Forecast by Market Taxonomy, 2015-2032
17.4.2.1. By Mode of Transport
17.4.2.2. By Industry
17.4.2.3. By Service Type
17.5. Brazil 3PL Software Market Analysis
17.5.1. Value Proportion Analysis by Market Taxonomy
17.5.2. Value & Analysis and Forecast by Market Taxonomy, 2015-2032
17.5.2.1. By Mode of Transport
17.5.2.2. By Industry
17.5.2.3. By Service Type
17.6. Germany 3PL Software Market Analysis
17.6.1. Value Proportion Analysis by Market Taxonomy
17.6.2. Value & Analysis and Forecast by Market Taxonomy, 2015-2032
17.6.2.1. By Mode of Transport
17.6.2.2. By Industry
17.6.2.3. By Service Type
17.7. France 3PL Software Market Analysis
17.7.1. Value Proportion Analysis by Market Taxonomy
17.7.2. Value & Analysis and Forecast by Market Taxonomy, 2015-2032
17.7.2.1. By Mode of Transport
17.7.2.2. By Industry
17.7.2.3. By Service Type
17.8. Italy 3PL Software Market Analysis
17.8.1. Value Proportion Analysis by Market Taxonomy
17.8.2. Value & Analysis and Forecast by Market Taxonomy, 2015-2032
17.8.2.1. By Mode of Transport
17.8.2.2. By Industry
17.8.2.3. By Service Type
17.9. BENELUX 3PL Software Market Analysis
17.9.1. Value Proportion Analysis by Market Taxonomy
17.9.2. Value & Analysis and Forecast by Market Taxonomy, 2015-2032
17.9.2.1. By Mode of Transport
17.9.2.2. By Industry
17.9.2.3. By Service Type
17.10. UK 3PL Software Market Analysis
17.10.1. Value Proportion Analysis by Market Taxonomy
17.10.2. Value & Analysis and Forecast by Market Taxonomy, 2015-2032
17.10.2.1. By Mode of Transport
17.10.2.2. By Industry
17.10.2.3. By Service Type
17.11. Nordic Countries 3PL Software Market Analysis
17.11.1. Value Proportion Analysis by Market Taxonomy
17.11.2. Value & Analysis and Forecast by Market Taxonomy, 2015-2032
17.11.2.1. By Mode of Transport
17.11.2.2. By Industry
17.11.2.3. By Service Type
17.12. China 3PL Software Market Analysis
17.12.1. Value Proportion Analysis by Market Taxonomy
17.12.2. Value & Analysis and Forecast by Market Taxonomy, 2015-2032
17.12.2.1. By Mode of Transport
17.12.2.2. By Industry
17.12.2.3. By Service Type
17.13. Japan 3PL Software Market Analysis
17.13.1. Value Proportion Analysis by Market Taxonomy
17.13.2. Value & Analysis and Forecast by Market Taxonomy, 2015-2032
17.13.2.1. By Mode of Transport
17.13.2.2. By Industry
17.13.2.3. By Service Type
17.14. South Korea 3PL Software Market Analysis
17.14.1. Value Proportion Analysis by Market Taxonomy
17.14.2. Value & Analysis and Forecast by Market Taxonomy, 2015-2032
17.14.2.1. By Mode of Transport
17.14.2.2. By Industry
17.14.2.3. By Service Type
17.15. GCC Countries 3PL Software Market Analysis
17.15.1. Value Proportion Analysis by Market Taxonomy
17.15.2. Value & Analysis and Forecast by Market Taxonomy, 2015-2032
17.15.2.1. By Mode of Transport
17.15.2.2. By Industry
17.15.2.3. By Service Type
17.16. South Africa 3PL Software Market Analysis
17.16.1. Value Proportion Analysis by Market Taxonomy
17.16.2. Value & Analysis and Forecast by Market Taxonomy, 2015-2032
17.16.2.1. By Mode of Transport
17.16.2.2. By Industry
17.16.2.3. By Service Type
17.17. Turkey 3PL Software Market Analysis
17.17.1. Value Proportion Analysis by Market Taxonomy
17.17.2. Value & Analysis and Forecast by Market Taxonomy, 2015-2032
17.17.2.1. By Mode of Transport
17.17.2.2. By Industry
17.17.2.3. By Service Type
17.17.3. Competition Landscape and Player Concentration in the Country
18. Market Structure Analysis
18.1. Market Analysis by Tier of Companies
18.2. Market Concentration
18.3. Market Share Analysis of Top Players
18.4. Market Presence Analysis
18.4.1. By Regional footprint of Players
18.4.2. Product footprint by Players
19. Competition Analysis
19.1. Competition Dashboard
19.2. Competition Benchmarking
19.3. Competition Deep Dive
19.3.1. C.H. Robinson Worldwide, Inc.
19.3.1.1. Overview
19.3.1.2. Product Portfolio
19.3.1.3. Sales Footprint
19.3.1.4. Strategy Overview
19.3.2. DB Schenker
19.3.2.1. Overview
19.3.2.2. Product Portfolio
19.3.2.3. Sales Footprint
19.3.2.4. Strategy Overview
19.3.3. DHL International GMBH
19.3.3.1. Overview
19.3.3.2. Product Portfolio
19.3.3.3. Sales Footprint
19.3.3.4. Strategy Overview
19.3.4. FedEx Corporation
19.3.4.1. Overview
19.3.4.2. Product Portfolio
19.3.4.3. Sales Footprint
19.3.4.4. Strategy Overview
19.3.5. KUEHNE+NAGEL Inc.
19.3.5.1. Overview
19.3.5.2. Product Portfolio
19.3.5.3. Sales Footprint
19.3.5.4. Strategy Overview
19.3.6. Maersk
19.3.6.1. Overview
19.3.6.2. Product Portfolio
19.3.6.3. Sales Footprint
19.3.6.4. Strategy Overview
19.3.7. Nippon Express
19.3.7.1. Overview
19.3.7.2. Product Portfolio
19.3.7.3. Sales Footprint
19.3.7.4. Strategy Overview
19.3.8. Panalpina World Transport Ltd.
19.3.8.1. Overview
19.3.8.2. Product Portfolio
19.3.8.3. Sales Footprint
19.3.8.4. Strategy Overview
19.3.9. Union Pacific Railroad
19.3.9.1. Overview
19.3.9.2. Product Portfolio
19.3.9.3. Sales Footprint
19.3.9.4. Strategy Overview
19.3.10. United Parcel Service
19.3.10.1. Overview
19.3.10.2. Product Portfolio
19.3.10.3. Sales Footprint
19.3.10.4. Strategy Overview
20. Assumptions and Acronyms Used
21. Research Methodology
Let us know your requirement to get
100% FREE customization
Table 01: Global 3PL Software Market Value (US$ Mn), By Mode of Transport, 2015 – 2021
Table 02: Global 3PL Software Market Value (US$ Mn), By Mode of Transport, 2022 – 2032
Table 03: Global 3PL Software Market Value (US$ Mn), By Industry, 2015 – 2021
Table 04: Global 3PL Software Market Value (US$ Mn), By Industry, 2022 – 2032
Table 05: Global 3PL Software Market Value (US$ Mn), By Service Type, 2015 – 2021
Table 06: Global 3PL Software Market Value (US$ Mn), By Service Type, 2022 – 2032
Table 07: Global 3PL Software Market, By Region, 2015 – 2021
Table 08: Global 3PL Software Market, By Region, 2022 – 2032
Table 09: North America 3PL Software Market Value (US$ Mn), By Mode of Transport, 2015 – 2021
Table 10: North America 3PL Software Market Value (US$ Mn), By Mode of Transport, 2022 – 2032
Table 11: North America 3PL Software Market Value (US$ Mn), By Industry, 2015 – 2021
Table 12: North America 3PL Software Market Value (US$ Mn), By Industry, 2022 – 2032
Table 13: North America 3PL Software Market Value (US$ Mn), By Service Type, 2015 – 2021
Table 14: North America 3PL Software Market Value (US$ Mn), By Service Type, 2022 – 2032
Table 15: North America 3PL Software Market, By Country, 2015 – 2021
Table 16: North America 3PL Software Market, By Country, 2022 – 2032
Table 17: Latin America 3PL Software Market Value (US$ Mn), By Mode of Transport, 2015 – 2021
Table 18: Latin America 3PL Software Market Value (US$ Mn), By Mode of Transport, 2022 – 2032
Table 19: Latin America 3PL Software Market Value (US$ Mn), By Industry, 2015 – 2021
Table 20: Latin America 3PL Software Market Value (US$ Mn), By Industry, 2022 – 2032
Table 21: Latin America 3PL Software Market Value (US$ Mn), By Service Type, 2015 – 2021
Table 22: Latin America 3PL Software Market Value (US$ Mn), By Service Type, 2022 – 2032
Table 23: Latin America 3PL Software Market, By Country, 2015 – 2021
Table 24: Latin America 3PL Software Market, By Country, 2022 – 2032
Table 25: Europe 3PL Software Market Value (US$ Mn), By Mode of Transport, 2015 – 2021
Table 26: Europe 3PL Software Market Value (US$ Mn), By Mode of Transport, 2022 – 2032
Table 27: Europe 3PL Software Market Value (US$ Mn), By Industry, 2015 – 2021
Table 28: Europe 3PL Software Market Value (US$ Mn), By Industry, 2022 – 2032
Table 29: Europe 3PL Software Market Value (US$ Mn), By Service Type, 2015 – 2021
Table 30: Europe 3PL Software Market Value (US$ Mn), By Service Type, 2022 – 2032
Table 31: Europe 3PL Software Market, By Country, 2015 – 2021
Table 32: Europe 3PL Software Market, By Country, 2022 – 2032
Table 33: Asia Pacific 3PL Software Market Value (US$ Mn), By Mode of Transport, 2015 – 2021
Table 34: Asia Pacific 3PL Software Market Value (US$ Mn), By Mode of Transport, 2022 – 2032
Table 35: Asia Pacific 3PL Software Market Value (US$ Mn), By Industry, 2015 – 2021
Table 36: Asia Pacific 3PL Software Market Value (US$ Mn), By Industry, 2022 – 2032
Table 37: Asia Pacific 3PL Software Market Value (US$ Mn), By Service Type, 2015 – 2021
Table 38: Asia Pacific 3PL Software Market Value (US$ Mn), By Service Type, 2022 – 2032
Table 39: Asia Pacific 3PL Software Market, By Country, 2015 – 2021
Table 40: Asia Pacific 3PL Software Market, By Country, 2022 – 2032
Table 41: MEA 3PL Software Market Value (US$ Mn), By Mode of Transport, 2015 – 2021
Table 42: MEA 3PL Software Market Value (US$ Mn), By Mode of Transport, 2022 – 2032
Table 43: MEA 3PL Software Market Value (US$ Mn), By Industry, 2015 – 2021
Table 44: MEA 3PL Software Market Value (US$ Mn), By Industry, 2022 – 2032
Table 45: MEA 3PL Software Market Value (US$ Mn), By Service Type, 2015 – 2021
Table 46: MEA 3PL Software Market Value (US$ Mn), By Service Type, 2022 – 2032
Table 47: MEA 3PL Software Market, By Country, 2015 – 2021
Table 48: MEA 3PL Software Market, By Country, 2022 – 2032
Table 49: Global 3PL Software Market Incremental $ Opportunity, By Mode of Transport, 2015 - 2021
Table 50: Global 3PL Software Market Incremental $ Opportunity, By Industry, 2022 – 2032
Table 51: Global 3PL Software Market Incremental $ Opportunity, By Service Type, 2015 - 2021
Table 52: Global 3PL Software Market Incremental $ Opportunity, By Region, 2022 – 2032
Table 53: North America 3PL Software Market Incremental $ Opportunity, By Mode of Transport, 2015 - 2021
Table 54: North America 3PL Software Market Incremental $ Opportunity, By Industry, 2022 – 2032
Table 55: North America 3PL Software Market Incremental $ Opportunity, By Service Type, 2015 – 2021
Table 56: North America 3PL Software Market Incremental $ Opportunity, By Country, 2022 – 2032
Table 57: Latin America 3PL Software Market Incremental $ Opportunity, By Mode of Transport, 2015 - 2021
Table 58: Latin America 3PL Software Market Incremental $ Opportunity, By Industry, 2022 – 2032
Table 59: Latin America 3PL Software Market Incremental $ Opportunity, By Service Type, 2015 - 2021
Table 60: Latin America 3PL Software Market Incremental $ Opportunity, By Country, 2022 – 2032
Table 61: Europe 3PL Software Market Incremental $ Opportunity, By Mode of Transport, 2015 - 2021
Table 62: Europe 3PL Software Market Incremental $ Opportunity, By Industry, 2022 – 2032
Table 63: Europe 3PL Software Market Incremental $ Opportunity, By Service Type, 2015 - 2021
Table 64: Europe 3PL Software Market Incremental $ Opportunity, By Country, 2022 - 2032
Table 65: Asia Pacific 3PL Software Market Incremental $ Opportunity, By Mode of Transport, 2015 - 2021
Table 66: Asia Pacific 3PL Software Market Incremental $ Opportunity, By Industry, 2022 – 2032
Table 67: Asia Pacific 3PL Software Market Incremental $ Opportunity, By Service Type, 2015 - 2021
Table 68: Asia Pacific 3PL Software Market Incremental $ Opportunity, By Country, 2022 – 2032
Table 69: MEA 3PL Software Market Incremental $ Opportunity, By Mode of Transport, 2015 - 2021
Table 70: MEA 3PL Software Market Incremental $ Opportunity, By Industry, 2022 – 2032
Table 71: MEA 3PL Software Market Incremental $ Opportunity, By Service Type, 2015 - 2021
Table 72: MEA 3PL Software Market Incremental $ Opportunity, By Country, 2022 - 2032
Find your sweet spots for generating winning opportunities in this market.
Talk to AnalystFigure 01: Global 3PL Software Market Value (US$ Mn) and Year-on-Year Growth, 2015-2032
Figure 02: Global 3PL Software Market Absolute $ Historical Gain (2015 - 2021) and Opportunity (2022 – 2032), US$ Mn
Figure 03: Global 3PL Software Market Share, By Mode of Transport, 2022 & 2032
Figure 04: Global 3PL Software Market Y-o-Y Growth Projections, Type – 2022-2032
Figure 05: Global 3PL Software Market Attractiveness Index, Type – 2022-2032
Figure 06: Global 3PL Software Market Share, By Industry, 2022 & 2032
Figure 07: Global 3PL Software Market Y-o-Y Growth Projections, By Industry – 2022-2032
Figure 08: Global 3PL Software Market Attractiveness Index, By Industry – 2022-2032
Figure 09: Global 3PL Software Market Share, By Service Type, 2022 & 2032
Figure 10: Global 3PL Software Market Y-o-Y Growth Projections, By Service Type – 2022-2032
Figure 11: Global 3PL Software Market Attractiveness Index, By Service Type – 2022-2032
Figure 12: Global 3PL Software Market Share, By Region, 2022 & 2032
Figure 13: Global 3PL Software Market Y-o-Y Growth Projections, By Region – 2022-2032
Figure 14: Global 3PL Software Market Attractiveness Index, By Region – 2022-2032
Figure 15: North America 3PL Software Market Value (US$ Mn) and Year-on-Year Growth, 2015-2032
Figure 16: North America 3PL Software Market Absolute $ Opportunity Historical (2015 - 2021) and Forecast Period (2022 – 2032), US$ Mn
Figure 17: North America 3PL Software Market Share, Type, 2022 & 2032
Figure 18: North America 3PL Software Market Y-o-Y Growth Projections, Type – 2022-2032
Figure 19: North America 3PL Software Market Attractiveness Index, Type – 2022-2032
Figure 20: North America 3PL Software Market Share, By Industry, 2022 & 2032
Figure 21: North America 3PL Software Market Y-o-Y Growth Projections, By Industry – 2022-2032
Figure 22: North America 3PL Software Market Attractiveness Index, By Industry – 2022-2032
Figure 23: North America 3PL Software Market Share, By Service Type, 2022 & 2032
Figure 24: North America 3PL Software Market Y-o-Y Growth Projections, By Service Type – 2022-2032
Figure 25: North America 3PL Software Market Attractiveness Index, By Service Type – 2022-2032
Figure 26: North America 3PL Software Market Share, By Country, 2022 & 2032
Figure 27: North America Market Y-o-Y Growth Projections, By Country – 2022-2032
Figure 28: North America Market Attractiveness Index, By Country – 2022-2032
Figure 29: Latin America 3PL Software Market Value (US$ Mn) and Year-on-Year Growth, 2015-2032
Figure 30: Latin America 3PL Software Market Absolute $ Opportunity Historical (2015 - 2021) and Forecast Period (2022 – 2032), US$ Mn
Figure 31: Latin America 3PL Software Market Share, Type, 2022 & 2032
Figure 32: Latin America 3PL Software Market Y-o-Y Growth Projections, Type – 2022-2032
Figure 33: Latin America 3PL Software Market Attractiveness Index, Type – 2022-2032
Figure 34: Latin America 3PL Software Market Share, By Industry, 2022 & 2032
Figure 35: Latin America 3PL Software Market Y-o-Y Growth Projections, By Industry – 2022-2032
Figure 36: Latin America 3PL Software Market Attractiveness Index, By Industry – 2022-2032
Figure 37: Latin America 3PL Software Market Share, By Service Type, 2022 & 2032
Figure 38: Latin America 3PL Software Market Y-o-Y Growth Projections, By Service Type – 2022-2032
Figure 39: Latin America 3PL Software Market Attractiveness Index, By Service Type – 2022-2032
Figure 40: Latin America 3PL Software Market Share, By Country, 2022 & 2032
Figure 41: Latin America 3PL Software Market Y-o-Y Growth Projections, By Country – 2022-2032
Figure 42: Latin America 3PL Software Market Attractiveness Index, By Country – 2022-2032
Figure 43: Europe 3PL Software Market Value (US$ Mn) and Year-on-Year Growth, 2015-2032
Figure 44: Europe 3PL Software Market Absolute $ Opportunity Historical (2015 - 2021) and Forecast Period (2022 – 2032), US$ Mn
Figure 45: Europe 3PL Software Market Share, Type, 2022 & 2032
Figure 46: Europe 3PL Software Market Y-o-Y Growth Projections, Type – 2022-2032
Figure 47: Europe 3PL Software Market Attractiveness Index, Type – 2022-2032
Figure 48: Europe 3PL Software Market Share, By Industry, 2022 & 2032
Figure 49: Europe 3PL Software Market Y-o-Y Growth Projections, By Industry – 2022-2032
Figure 50: Europe 3PL Software Market Attractiveness Index, By Industry – 2022-2032
Figure 51: Europe 3PL Software Market Share, By Service Type, 2022 & 2032
Figure 52: Europe 3PL Software Market Y-o-Y Growth Projections, By Service Type – 2022-2032
Figure 53: Europe 3PL Software Market Attractiveness Index, By Service Type – 2022-2032
Figure 54: Europe 3PL Software Market Share, By Country, 2022 & 2032
Figure 55: Europe 3PL Software Market Y-o-Y Growth Projections, By Country – 2022-2032
Figure 56: Europe 3PL Software Market Attractiveness Index, By Country – 2022-2032
Figure 57: MEA 3PL Software Market Value (US$ Mn) and Year-on-Year Growth, 2015-2032
Figure 58: MEA 3PL Software Market Absolute $ Opportunity Historical (2015 - 2021) and Forecast Period (2022 – 2032), US$ Mn
Figure 59: MEA 3PL Software Market Share, Type, 2022 & 2032
Figure 60: MEA 3PL Software Market Y-o-Y Growth Projections, Type – 2022-2032
Figure 61: MEA 3PL Software Market Attractiveness Index, Type – 2022-2032
Figure 62: MEA 3PL Software Market Share, By Industry, 2022 & 2032
Figure 63: MEA 3PL Software Market Y-o-Y Growth Projections, By Industry – 2022-2032
Figure 64: MEA 3PL Software Market Attractiveness Index, By Industry – 2022-2032
Figure 65: MEA 3PL Software Market Share, By Service Type, 2022 & 2032
Figure 66: MEA 3PL Software Market Y-o-Y Growth Projections, By Service Type – 2022-2032
Figure 67: MEA 3PL Software Market Attractiveness Index, By Service Type – 2022-2032
Figure 68: MEA 3PL Software Market Share, By Country, 2022 & 2032
Figure 69: MEA 3PL Software Market Y-o-Y Growth Projections, By Country – 2022-2032
Figure 70: MEA 3PL Software Market Attractiveness Index, By Country – 2022-2032
Figure 71: Asia Pacific 3PL Software Market Value (US$ Mn) and Year-on-Year Growth, 2015-2030
Figure 72: Asia Pacific 3PL Software Market Absolute $ Opportunity Historical (2015 - 2021) and Forecast Period (2022 – 2032), US$ Mn
Figure 73: Asia Pacific 3PL Software Market Share, Type, 2022 & 2032
Figure 74: Asia Pacific 3PL Software Market Y-o-Y Growth Projections, Type – 2022-2032
Figure 75: Asia Pacific 3PL Software Market Attractiveness Index, Type – 2022-2032
Figure 76: Asia Pacific 3PL Software Market Share, By Industry, 2022 & 2032
Figure 77: Asia Pacific 3PL Software Market Y-o-Y Growth Projections, By Industry – 2022-2032
Figure 78: Asia Pacific 3PL Software Market Attractiveness Index, By Industry – 2022-2032
Figure 79: Asia Pacific 3PL Software Market Share, By Service Type, 2022 & 2032
Figure 80: Asia Pacific 3PL Software Market Y-o-Y Growth Projections, By Service Type – 2022-2032
Figure 81: Asia Pacific 3PL Software Market Attractiveness Index, By Service Type – 2022-2032
Figure 82: Asia Pacific 3PL Software Market Share, By Country, 2022 & 2032
Figure 83: Asia Pacific 3PL Software Market Y-o-Y Growth Projections, By Country – 2022-2032
Figure 84: Asia Pacific 3PL Software Market Attractiveness Index, By Country – 2022-2032
Figure 85: US 3PL Software Market Value (US$ Mn) and Forecast, 2022 - 2032
Figure 86: US 3PL Software Market Share, Type, 2021
Figure 87: US 3PL Software Market Share, By Industry, 2021
Figure 88: US 3PL Software Market Share, By Service Type, 2021
Figure 89: Canada 3PL Software Market Value (US$ Mn) and Forecast, 2022 - 2032
Figure 90: Canada 3PL Software Market Share, Type, 2021
Figure 91: Canada 3PL Software Market Share, By Industry, 2021
Figure 92: Canada 3PL Software Market Share, By Service Type, 2021
Figure 93: Brazil 3PL Software Market Value (US$ Mn) and Forecast, 2022 - 2032
Figure 94: Brazil 3PL Software Market Share, Type, 2021
Figure 95: Brazil 3PL Software Market Share, By Industry, 2021
Figure 96: Brazil 3PL Software Market Share, By Service Type, 2021
Figure 97: Mexico 3PL Software Market Value (US$ Mn) and Forecast, 2022 - 2032
Figure 98: Mexico 3PL Software Market Share, Type, 2021
Figure 99: Mexico 3PL Software Market Share, By Industry, 2021
Figure 100: Mexico 3PL Software Market Share, By Service Type, 2021
Figure 101: Germany 3PL Software Market Value (US$ Mn) and Forecast, 2022 - 2032
Figure 102: Germany 3PL Software Market Share, Type, 2021
Figure 103: Germany 3PL Software Market Share, By Industry, 2021
Figure 104: Germany 3PL Software Market Share, By Service Type, 2021
Figure 105: U.K. 3PL Software Market Value (US$ Mn) and Forecast, 2022 - 2032
Figure 106: U.K. 3PL Software Market Share, Type, 2021
Figure 107: U.K. 3PL Software Market Share, By Industry, 2021
Figure 108: U.K. 3PL Software Market Share, By Service Type, 2021
Figure 109: France 3PL Software Market Value (US$ Mn) and Forecast, 2022 - 2032
Figure 110: France 3PL Software Market Share, Type, 2021
Figure 111: France 3PL Software Market Share, By Industry, 2021
Figure 112: France 3PL Software Market Share, By Service Type, 2021
Figure 113: Italy 3PL Software Market Value (US$ Mn) and Forecast, 2022 - 2032
Figure 114: Italy 3PL Software Market Share, Type, 2021
Figure 115: Italy 3PL Software Market Share, By Industry, 2021
Figure 116: Italy 3PL Software Market Share, By Service Type, 2021
Figure 117: BENELUX 3PL Software Market Value (US$ Mn) and Forecast, 2022 - 2032
Figure 118: BENELUX 3PL Software Market Share, Type, 2021
Figure 119: BENELUX 3PL Software Market Share, By Industry, 2021
Figure 120: BENELUX 3PL Software Market Share, By Service Type, 2021
Figure 121: Nordic Countries 3PL Software Market Value (US$ Mn) and Forecast, 2022 - 2032
Figure 122: Nordic Countries 3PL Software Market Share, Type, 2021
Figure 123: Nordic Countries 3PL Software Market Share, By Industry, 2021
Figure 124: Nordic Countries 3PL Software Market Share, By Service Type, 2021
Figure 125: China 3PL Software Market Value (US$ Mn) and Forecast, 2022 - 2032
Figure 126: China 3PL Software Market Share, Type, 2021
Figure 127: China 3PL Software Market Share, By Industry, 2021
Figure 128: China 3PL Software Market Share, By Service Type, 2021
Figure 129: Japan 3PL Software Market Value (US$ Mn) and Forecast, 2022 - 2032
Figure 130: Japan 3PL Software Market Share, Type, 2021
Figure 131: Japan 3PL Software Market Share, By Industry, 2021
Figure 132: Japan 3PL Software Market Share, By Service Type, 2021
Figure 133: South Korea 3PL Software Market Value (US$ Mn) and Forecast, 2022 - 2032
Figure 134: South Korea 3PL Software Market Share, Type, 2021
Figure 135: South Korea 3PL Software Market Share, By Industry, 2021
Figure 136: South Korea 3PL Software Market Share, By Service Type, 2021
Figure 137: GCC Countries 3PL Software Market Value (US$ Mn) and Forecast, 2022 - 2032
Figure 138: GCC Countries 3PL Software Market Share, Type, 2021
Figure 139: GCC Countries 3PL Software Market Share, By Industry, 2021
Figure 140: GCC Countries 3PL Software Market Share, By Service Type, 2021
Figure 141: South Africa 3PL Software Market Value (US$ Mn) and Forecast, 2022 - 2032
Figure 142: South Africa 3PL Software Market Share, Type, 2021
Figure 143: South Africa 3PL Software Market Share, By Industry, 2021
Figure 144: South Africa 3PL Software Market Share, By Service Type, 2021
Figure 145: Turkey 3PL Software Market Value (US$ Mn) and Forecast, 2022 - 2032
Figure 146: Turkey 3PL Software Market Share, Type, 2021
Figure 147: Turkey 3PL Software Market Share, By Industry, 2021
Figure 148: Turkey 3PL Software Market Share, By Service Type, 2021
Need specific information?
Request CustomizationExplore Technology Insights
View Reports