AI in Transportation Market Size, Share, and Forecast Outlook 2025 to 2035

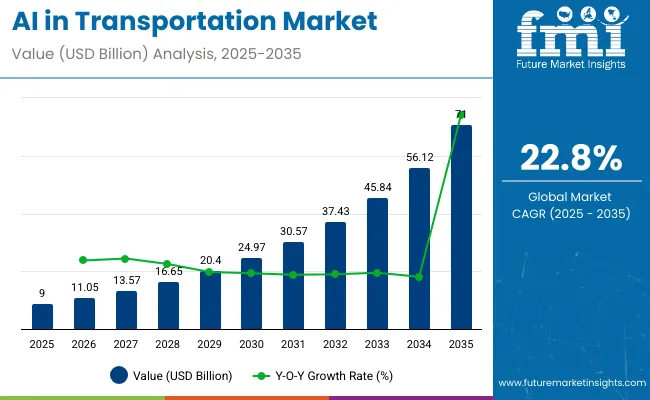
The AI in transportation market is valued at USD 9 billion in 2025 and will expand to nearly USD 71 billion by 2035, advancing at a CAGR of 22.8%, equal to a multiplying factor of about 7.9x.
Quick stats of AI in Transportation Market

  • AI in Transportation Market Size (2025): USD 9 billion
  • Projected AI in Transportation Market Size (2035): USD 71 billion
  • Forecast CAGR of AI in Transportation Market (2025 to 2035): 22.8%
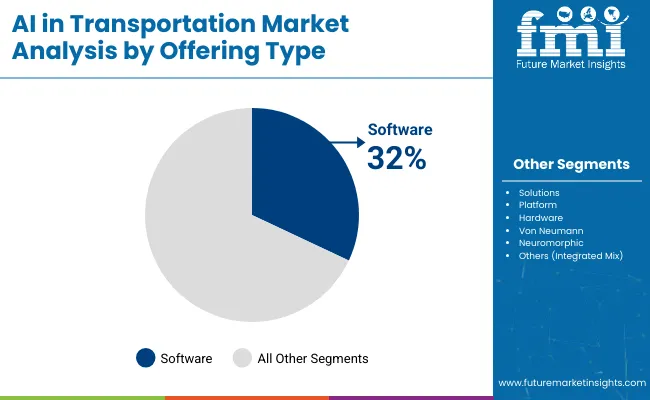
  • Leading Offering in AI in Transportation Market (2025): Software - Solutions with 32% share
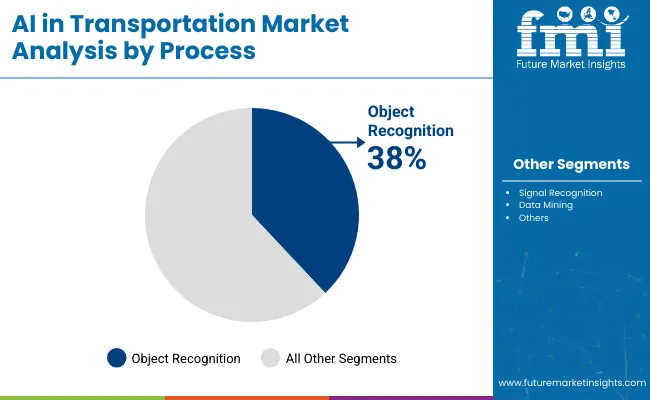
  • Leading Process in AI in Transportation Market (2025): Object Recognition with 38% share
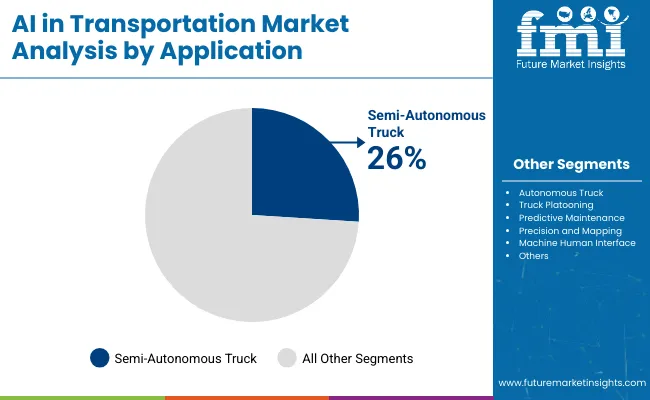
  • Leading Application in AI in Transportation Market (2025): Semi-Autonomous Truck with 26% share
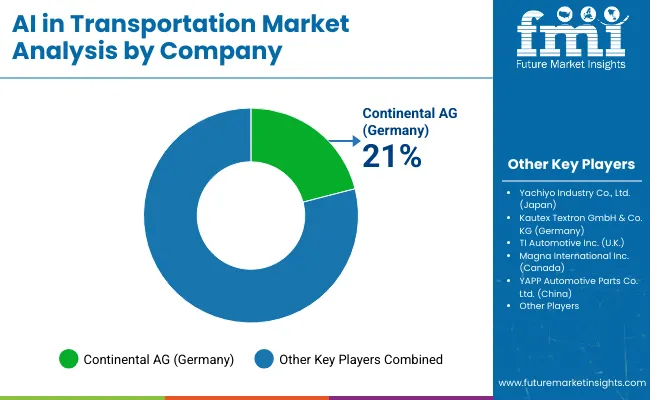
  • Leading Player in Market (2025): Continental AG with 21% share

Ai In Transportation Market

Metric Value
Industry Size (2025E) USD 9 billion
Industry Value (2035F) USD 71 billion
CAGR (2025 to 2035) 22.8%

A compound absolute growth analysis highlights how incremental value accumulation progresses over the forecast horizon. From 2025 to 2028, absolute gains remain moderate, with yearly increases driven by early adoption of AI-enabled fleet management, route optimization, and predictive maintenance solutions. These applications generate measurable cost savings for logistics providers and public transport operators, creating a steady base for further expansion.

During the middle phase, from 2028 to 2032, the annual absolute growth becomes sharper as advanced driver assistance, automated freight systems, and AI-powered traffic management platforms see wider rollout across developed economies. By the later years, from 2032 to 2035, absolute yearly gains peak as large-scale deployment of autonomous mobility services, integrated smart city infrastructure, and AI-based energy optimization in transportation systems accelerate market momentum. This compounding effect results in significant cumulative value creation over the decade. The analysis shows that while percentage growth remains high, the true scale of expansion lies in the absolute dollar increase each year, underscoring the transformative financial impact of AI integration in transportation.

The AI in transportation market is shaped by multiple contributing sectors. Automotive and commercial vehicle manufacturing accounts for approximately 36%, reflecting integration of AI in driver assistance and fleet automation. Software and AI platform providers represent about 24%, delivering machine learning algorithms for route optimization, predictive maintenance, and autonomous driving. Sensor and hardware suppliers contribute nearly 20%, offering lidar, radar, and telematics equipment. Logistics and fleet management services hold close to 12%, adopting AI for fuel optimization and predictive scheduling. Traffic management and infrastructure solutions comprise the remaining 8%, focusing on smart traffic lights, urban mobility platforms, and connected road systems.

The market is experiencing accelerated adoption across both passenger and freight applications. Predictive maintenance enabled by AI has reduced downtime by 15-20% in large fleet operations, improving cost efficiency. AI-powered route optimization has cut logistics fuel expenses by up to 12%, supporting sustainable transport goals. Level 2 and Level 3 assisted driving systems are becoming common, installed in over 45% of new premium vehicles delivered in 2024. In logistics, demand for autonomous middle-mile trucking pilots increased by 18% year-on-year, driven by e-commerce expansion. Cities are deploying AI-based traffic management systems, reducing congestion times by an estimated 10-15% in trial deployments.

Top AI in Transportation Market Dynamics

The market is expanding due to rising adoption of autonomous vehicles, AI powered fleet management, and connected mobility solutions. Passenger vehicles contribute the largest share, while freight and logistics are growing rapidly through AI for route optimization, predictive maintenance, and operational efficiency. Smart city initiatives in Asia Pacific and government-backed intelligent transport programs in North America are driving adoption. The demand for data-driven decision making in transport planning and real-time monitoring is increasing, and OEMs are integrating AI software and sensors into vehicles. AI adoption is becoming essential to enhance safety, efficiency, and reliability across both urban and intercity transport networks.

Driving Force Efficiency and Safety Enhancement

AI in transportation is accelerating because it delivers safety, operational efficiency, and predictive analytics. AI powered predictive maintenance reduces breakdowns and can lower repair costs by up to 20%. Route optimization in freight fleets decreases fuel consumption and delivery time by 10-15%. AI enabled safety features, including adaptive cruise control, lane departure warnings, and collision prevention systems, help reduce accidents by minimizing human error. Autonomous capabilities in passenger cars and commercial vehicles increase driver comfort and productivity. In my view, integrating AI into transportation is no longer optional; it is a core requirement to meet rising mobility demand, manage urban traffic efficiently, and ensure passenger and freight safety in evolving transport systems worldwide.

Growth Opportunity Autonomous Mobility and Smart Logistics

Opportunities are emerging as Level 3 and Level 4 autonomous vehicles enter urban shuttles, robo taxis, and passenger cars. AI powered logistics systems optimize fleet utilization, reduce empty miles, and enhance route planning for long-haul freight. Smart city AI platforms improve traffic flow, reduce congestion, and lower emissions. Integration of predictive analytics and real-time monitoring allows operators to enhance operational efficiency while minimizing costs. From my perspective, combining AI software with vehicle hardware ecosystems will define the next phase of transportation. Companies investing in AI enabled mobility platforms are likely to capture market share in both private and commercial transport, driving adoption across regions with advanced infrastructure.

Emerging Trend Connected Infrastructure and AI Integration

The integration of AI with connected mobility and smart infrastructure is reshaping transportation. Vehicle to everything (V2X) communication allows real-time coordination between cars, traffic signals, and road infrastructure, improving safety and traffic management. Cloud based AI platforms process large datasets to optimize vehicle operations and predictive decision making. Sensor fusion integrating lidar, radar, and cameras improves autonomous navigation accuracy. Adoption of AI enabled smart city platforms allows transport operators to monitor performance, adjust routes dynamically, and manage congestion efficiently. In my assessment, future transportation systems will rely on connected infrastructure to fully exploit AI capabilities, reducing accidents, fuel consumption, and operational inefficiencies while enabling new mobility services.

Market Challenge Cost and Infrastructure Constraints

High costs of AI systems and infrastructure limitations are slowing adoption. Advanced sensors, AI processors, and communication modules increase vehicle and fleet costs, restricting access to premium and large-scale operators. Emerging regions face challenges from limited digital connectivity, inadequate road networks, and inconsistent traffic management, delaying deployment. Cybersecurity risks targeting connected vehicles create additional operational concerns. Training operators and maintaining AI systems require skilled labor, adding complexity. In my view, successful AI adoption in transportation will depend on reducing costs, strengthening infrastructure, and implementing robust cybersecurity measures. Without these interventions, market growth in urban and intercity transport will remain uneven despite technological advancements.

Analyzing AI in Transportation Market by Top Investment Segments

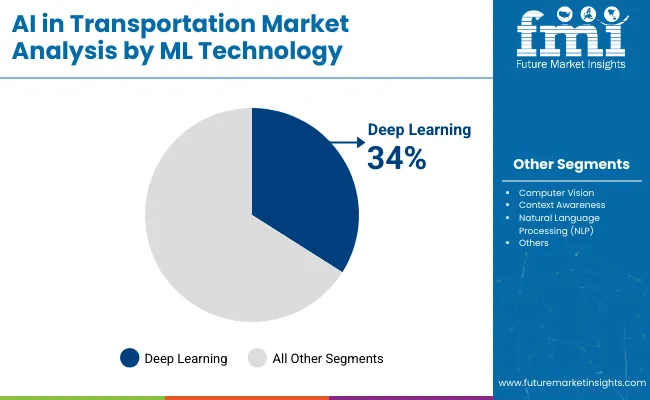
The market in 2025 is shaped by growing reliance on predictive systems, automated freight, and smart logistics. Software solutions lead offerings with 32% share, while deep learning dominates machine learning technologies at 34%. Object recognition is the leading process with 38% share, followed by signal recognition at 34%. Semi-autonomous trucks account for 26% of application demand, with autonomous trucks at 22%. OEMs such as Daimler, Volvo, and PACCAR, along with technology providers including NVIDIA, Waymo, and Mobileye, drive adoption. Market expansion is defined by safety optimization, cost reduction, fleet efficiency, and predictive analytics. Investments focus on data-rich applications integrating AI-driven perception, planning, and decision-making for freight and passenger transport.
Software Solutions, Platforms, And Hardware Drive Offering Segment

Ai In Transportation Market By Offering

Software solutions dominate the offering segment with 32% share, supporting predictive maintenance, route optimization, and fleet analytics. Software platforms contribute 24%, enabling integration of AI tools into transportation ecosystems, with NVIDIA DRIVE and Waymo Driver as leading platforms. Hardware components such as Von Neumann architecture hold 18%, powering conventional AI accelerators, while neuromorphic hardware contributes 14% with companies like Intel and BrainChip developing advanced processors. The remaining 12% is an integrated mix of solutions combining software and hardware. OEMs and logistics operators adopt offerings tailored to operational scale. Growth is driven by rising demand for predictive operations, adaptive routing, and driver-assist functionalities.
  • NVIDIA provides 40% of AI software solutions for OEMs and logistics fleets
  • Waymo Driver platform covers 35% of autonomous testing integrations
  • Intel and BrainChip supply 25% of neuromorphic processors for transportation AI

Deep Learning, Computer Vision, And Context Awareness Lead ML Technologies

Ai In Transportation Market By Ml

Deep learning leads machine learning adoption in transportation with 34% share, powering decision-making in semi-autonomous and autonomous trucks. Computer vision accounts for 28%, widely applied in perception tasks such as lane detection, obstacle recognition, and traffic sign reading. Context awareness contributes 22%, supporting adaptive driving through environmental analysis and predictive modeling. NLP holds 16%, enhancing human-machine interfaces in vehicle communication systems. NVIDIA, Tesla, and Mobileye lead in deep learning and computer vision frameworks, while Baidu Apollo and Aurora integrate context-aware systems. ML adoption is centered on achieving safety, efficiency, and reliability across long-haul logistics and urban transport.
  • NVIDIA delivers 45% of deep learning solutions for AI-driven vehicles
  • Mobileye supplies 35% of computer vision modules for autonomous fleets
  • Aurora integrates 25% of context awareness in predictive transportation systems

Object Recognition, Signal Recognition, And Data Mining Drive Processes

Ai In Transportation Market By Process

Object recognition dominates the process segment with 38% share, ensuring detection of vehicles, pedestrians, and road obstacles through LiDAR, radar, and camera fusion. Signal recognition follows with 34%, focusing on interpreting traffic lights, signs, and V2X communications. Data mining accounts for 28%, applied to predictive maintenance and fleet analytics for operational cost reduction. Companies including Tesla, Waymo, and NVIDIA apply object recognition in semi-autonomous platforms, while Continental and Bosch specialize in signal recognition modules. Data mining solutions are deployed by fleet operators for predictive efficiency. Demand is centered on safety, real-time decision-making, and streamlined logistics management.
  • Tesla and Waymo provide 40% of object recognition solutions for autonomous driving
  • Bosch and Continental deliver 35% of signal recognition technologies
  • IBM and Palantir deploy 25% of data mining tools for fleet operations

Semi-Autonomous and Autonomous Trucks Lead Applications

Ai In Transportation Market By Application

Semi-autonomous trucks dominate applications with 26% share, offering driver assistance and automated long-haul capabilities. Autonomous trucks account for 22%, tested by Waymo, TuSimple, and Daimler across major logistics corridors. Truck platooning contributes 18%, enabling convoys for fuel efficiency and traffic flow optimization. Predictive maintenance holds 12%, while precision mapping contributes 10%, machine-human interface 7%, and other applications 5%. OEMs such as Volvo, PACCAR, and Daimler partner with NVIDIA and Aurora for integrated AI systems. Application demand is driven by operational cost savings, reduced driver fatigue, and supply chain optimization. Adoption is particularly strong in North America and Asia for long-distance freight operations.
  • Daimler and Volvo supply 40% of semi-autonomous trucks in global fleets
  • Waymo and TuSimple provide 35% of autonomous truck pilots in the US and China
  • PACCAR integrates 25% of truck platooning technologies in logistics fleets

Top Countries Driving Adoption, Development, and Integration in the AI in Transportation Market

Ai In Transportation Market By Country

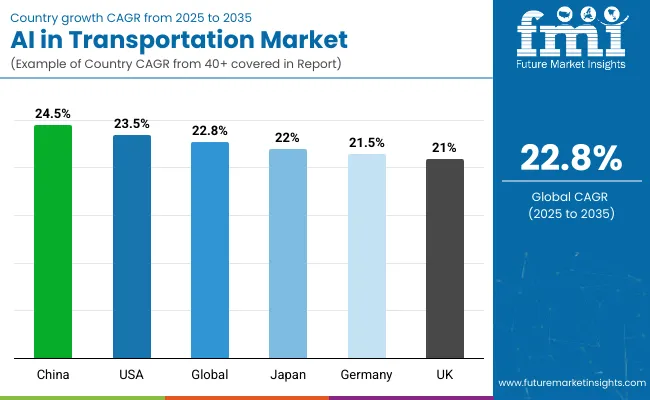
China leads the AI in transportation market with a CAGR of 24.5% from 2025 to 2035, +7% above the global average of 22.8%. Growth is supported by BRICS-led initiatives in autonomous vehicle testing, smart logistics, and large-scale investment in digital mobility platforms. The United States follows at 23.5%, +3% over the global benchmark, driven by OECD-backed innovation in connected infrastructure, AI software development, and supportive regulatory frameworks. Japan records 22.0%, slightly below the global rate, with progress influenced by its strength in robotics and automation but moderated by limited fleet expansion. Germany posts 21.5%, −6% under the global CAGR, shaped by integration of AI in logistics networks and premium automotive manufacturing. The United Kingdom stands at 21.0%, −8% below the global average, reflecting gradual infrastructure readiness. Overall, BRICS economies emphasize adoption at scale, while OECD countries focus on regulated, technology-intensive integration.

AI in Transportation Market Outlook in China

The AI in transportation market in China is projected to grow at a CAGR of 24.5%, fueled by rapid deployment of AI-powered autonomous vehicles and smart fleet management solutions. Major cities such as Beijing, Shanghai, and Guangzhou are leveraging AI for traffic optimization, predictive maintenance, and intelligent route planning. Baidu Apollo and Pony.ai are expanding pilot robo-taxi services, while BYD integrates AI in electric commercial fleets. Logistics companies adopt AI-based predictive routing to enhance delivery efficiency and reduce operational costs. Investments in AI-enabled roadside sensors and vehicle-to-everything communication are increasing system reliability and safety. Urban hubs are prioritizing smart traffic control, and AI-driven analytics are shaping real-time decision-making in public transport and freight networks.

  • Robo-taxi services expand across multiple Tier 1 cities
  • AI logistics platforms reduce delivery times by up to 15%
  • Vehicle-to-everything communication enhances real-time traffic decision-making

AI in Transportation Market Trends in the United States

The United States AI in transportation market is expected to expand at a CAGR of 23.5%, driven by autonomous vehicles, AI-enabled freight systems, and connected infrastructure. Companies like Waymo, Tesla, and Aurora lead in Level 3 and Level 4 automation for passenger and commercial fleets. Freight operators increasingly use AI for predictive routing and load optimization, reducing fuel consumption. Arizona, California, and Texas provide large-scale testing environments for autonomous vehicles, while e-commerce companies implement AI-driven delivery scheduling. Integration of AI-based analytics allows fleet operators to improve safety, reduce congestion, and monitor vehicle health in real time. Adoption is strongest in regions with high industrial density and logistics hubs.

  • AI fleet management reduces fuel consumption and operational costs
  • Predictive routing optimizes delivery schedules in e-commerce logistics
  • Real-time analytics improve vehicle maintenance and safety

AI in Transportation Market Expansion in Japan

The market for AI in transportation in Japan is projected to grow at a CAGR of 22.0%, supported by widespread adoption of autonomous driving technology and intelligent fleet solutions. Toyota, Honda, and Nissan integrate AI into Level 2 and Level 3 systems for passenger cars, while public transportation authority’s deploy AI-driven predictive maintenance. Automated bus programs are piloted in Tokyo and Fukuoka, enhancing safety and reducing delays. AI-assisted logistics systems optimize routing for commercial vehicles, reducing idle time and fuel usage. Government mobility-as-a-service initiatives promote seamless integration of AI in multi-modal transportation. Japan’s focus on robotics and AI in urban traffic systems strengthens efficiency and supports smart city initiatives.

  • Automated buses enhance urban passenger mobility in Tokyo and Fukuoka
  • Predictive maintenance reduces downtime in freight and passenger fleets
  • AI-integrated mobility-as-a-service improves multimodal transportation efficiency

AI in Transportation Market Growth in Germany

Germany’s AI in transportation market is forecasted to grow at a CAGR of 21.5%, driven by automotive, logistics, and industrial applications. BMW, Mercedes-Benz, and Volkswagen integrate Level 3 and Level 4 autonomous functions in production models, while Bosch and Continental provide sensor fusion and AI-based decision-making solutions. AI-assisted fleet management is widely used in Rhine-Ruhr industrial corridors to optimize cargo routing and improve safety. Public-private initiatives fund smart mobility projects, deploying AI in urban traffic control and autonomous shuttle systems. Investment in high-precision AI tools for real-time data processing strengthens operational efficiency and enables predictive maintenance. Industrial corridors prioritize AI deployment in both freight and passenger transportation systems.

  • Freight corridors adopt AI for predictive routing and load optimization
  • Sensor fusion technology enhances autonomous navigation accuracy
  • Smart mobility projects reduce congestion and improve urban traffic safety

AI in Transportation Market Prospects in the United Kingdom

The United Kingdom AI in transportation market is projected to grow at a CAGR of 21.0%, driven by autonomous vehicle testing, AI-enabled logistics, and connected infrastructure. Oxfordshire and London serve as testbeds for Level 4 autonomous systems developed by Oxbotica and FiveAI. Jaguar Land Rover integrates AI-driven lane management, collision avoidance, and driver-assist features in premium models. Public sector programs support AI-enabled mobility projects for urban shuttle services and last-mile delivery networks. Logistics operators adopt AI-powered route optimization to enhance efficiency and reduce fuel consumption. Expansion focuses on smart infrastructure integration, real-time monitoring, and predictive analytics to improve operational reliability across freight and passenger services.
  • Autonomous shuttles expand in Oxfordshire and London urban corridors
  • AI-driven predictive safety systems are deployed in premium vehicle models
  • Route optimization systems reduce fuel usage and delivery times in logistics

Leading AI in Transportation Manufacturers, Suppliers, Distributors

Ai In Transportation Market By Company

The market is driven by global automotive and technology companies delivering intelligent solutions for traffic management, vehicle systems, and fleet operations. Continental AG (Germany) is considered the leading player, supported by its extensive AI-enabled transportation solutions, including smart vehicle components, connected systems, and advanced traffic analytics. The company focuses on integrating AI with sensor technologies and telematics to improve safety, efficiency, and operational reliability for both commercial and passenger vehicles. Yachiyo Industry Co., Ltd. (Japan) and Kautex Textron GmbH & Co. KG (Germany) hold strong positions by providing automotive components optimized for AI applications and connected mobility systems. TI Automotive Inc. (UK) and Magna International Inc. (Canada) specialize in advanced vehicle electronics and fluid management systems integrated with AI capabilities.

Other players contribute by expanding regional reach and developing niche AI-driven transportation solutions. YAPP Automotive Parts Co. Ltd. (China) provides scalable components for connected vehicles, while other regional suppliers enhance adoption in emerging markets through tailored solutions for local fleets and OEMs. These companies emphasize data-driven system design, predictive maintenance, and operational efficiency, allowing fleets and vehicle manufacturers to leverage AI for safer, more reliable, and cost-effective transportation. Strategic partnerships, continuous R&D, and targeted product launches further strengthen their position in a competitive global market.

Leading Players

  • Continental AG
  • Yachiyo Industry Co., Ltd.
  • Kautex Textron GmbH & Co. KG
  • TI Automotive Inc.
  • Magna International Inc.
  • YAPP Automotive Parts Co. Ltd

Report Scope

Report Attributes Details
Market Size (2025) USD 9 billion
Projected Market Size (2035) USD 71 billion
CAGR (2025 to 2035) 22.8%
Base Year for Estimation 2024
Historical Period 2020 to 2024
Projection Period 2025 to 2035
Quantitative Units USD billion for value
Offering Segments Hardware (Neuromorphic, Von Neumann), Software, Platforms, Solutions
Machine Learning Technology Deep Learning, Computer Vision, Context Awareness, Natural Language Processing
Process Segments Signal Recognition, Object Recognition, Data Mining
Application Segments Semi-Autonomous Truck, Truck Platooning, Predictive Maintenance, Precision & Mapping, Autonomous Truck, Machine-Human Interface, Others
Regions Covered North America, Europe, Asia Pacific, Latin America, Middle East & Africa
Countries Covered United States, Canada, Mexico, Brazil, Germany, France, Italy, United Kingdom, Spain, China, Japan, India, South Korea, Australia, United Arab Emirates, Saudi Arabia, South Africa
Leading Players Continental AG (21%), Yachiyo Industry Co. Ltd., Kautex Textron GmbH & Co. KG, TI Automotive Inc., Magna International Inc., YAPP Automotive Parts Co. Ltd
Additional Attributes Dollar sales by offering, machine learning technology, and application, demand dynamics across semi-autonomous and autonomous trucks, regional adoption trends across North America, Europe, and Asia-Pacific, innovation in AI-driven vehicle systems, predictive maintenance, and smart fleet management solutions

AI in Transportation Market Analyzed by Key Investment Segments

By Offering:

  • Software
    • Solutions
    • Platforms
  • Hardware
    • Von Neumann
    • Neuromorphic

By Machine Learning Technology:

  • Deep Learning
  • Computer Vision
  • Context Awareness
  • Natural Language Processing

By Process:

  • Signal Recognition
  • Object Recognition
  • Data Mining

By Application:

  • Semi-Autonomous Truck
  • Truck platooning
  • Predictive maintenance
  • Precision and mapping
  • Autonomous truck
  • Machine human interface
  • Others

By Region:

  • North America
  • Europe
  • Asia Pacific
  • Latin America
  • Middle East and Africa

Table of Content

  1. Executive Summary
    • Global Market Outlook
    • Demand-side Trends
    • Supply-side Trends
    • Technology Roadmap Analysis
    • Analysis and Recommendations
  2. Market Overview
    • Market Coverage / Taxonomy
    • Market Definition / Scope / Limitations
  3. Market Background
    • Market Dynamics
      • Drivers
      • Restraints
      • Opportunity
      • Trends
    • Scenario Forecast
      • Demand in Optimistic Scenario
      • Demand in Likely Scenario
      • Demand in Conservative Scenario
    • Opportunity Map Analysis
    • Product Life Cycle Analysis
    • Supply Chain Analysis
      • Supply Side Participants and their Roles
        • Producers
        • Mid-Level Participants (Traders/ Agents/ Brokers)
        • Wholesalers and Distributors
      • Value Added and Value Created at Node in the Supply Chain
      • List of Raw Material Suppliers
      • List of Existing and Potential Buyer’s
    • Investment Feasibility Matrix
    • Value Chain Analysis
      • Profit Margin Analysis
      • Wholesalers and Distributors
      • Retailers
    • PESTLE and Porter’s Analysis
    • Regulatory Landscape
      • By Key Regions
      • By Key Countries
    • Regional Parent Market Outlook
    • Production and Consumption Statistics
    • Import and Export Statistics
  4. Global Market Analysis 2020 to 2024 and Forecast, 2025 to 2035
    • Historical Market Size Value (USD Billion) & Volume (Thousand Units) Analysis, 2020 to 2024
    • Current and Future Market Size Value (USD Billion) & Volume (Thousand Units) Projections, 2025 to 2035
      • Y-o-Y Growth Trend Analysis
      • Absolute $ Opportunity Analysis
  5. Global Market Pricing Analysis 2020 to 2024 and Forecast 2025 to 2035
  6. Global Market Analysis 2020 to 2024 and Forecast 2025 to 2035, By Offering Type
    • Introduction / Key Findings
    • Historical Market Size Value (USD Billion) & Volume (Thousand Units) Analysis By Offering Type, 2020 to 2024
    • Current and Future Market Size Value (USD Billion) & Volume (Thousand Units) Analysis and Forecast By Offering Type, 2025 to 2035
      • Software
        • Solutions
        • Platforms
      • Hardware
        • Von Neumann
        • Neuromorphic
      • Others (Integrated Mix)
    • Y-o-Y Growth Trend Analysis By Offering Type, 2020 to 2024
    • Absolute $ Opportunity Analysis By Offering Type, 2025 to 2035
  7. Global Market Analysis 2020 to 2024 and Forecast 2025 to 2035, By Machine Learning Technology
    • Introduction / Key Findings
    • Historical Market Size Value (USD Billion) & Volume (Thousand Units) Analysis By Machine Learning Technology, 2020 to 2024
    • Current and Future Market Size Value (USD Billion) & Volume (Thousand Units) Analysis and Forecast By Machine Learning Technology, 2025 to 2035
      • Deep Learning
      • Computer Vision
      • Context Awareness
      • Natural Language Processing (NLP)
    • Y-o-Y Growth Trend Analysis By Machine Learning Technology, 2020 to 2024
    • Absolute $ Opportunity Analysis By Machine Learning Technology, 2025 to 2035
  8. Global Market Analysis 2020 to 2024 and Forecast 2025 to 2035, By Process
    • Introduction / Key Findings
    • Historical Market Size Value (USD Billion) & Volume (Thousand Units) Analysis By Process, 2020 to 2024
    • Current and Future Market Size Value (USD Billion) & Volume (Thousand Units) Analysis and Forecast By Process, 2025 to 2035
      • Object Recognition
      • Signal Recognition
      • Data Mining
    • Y-o-Y Growth Trend Analysis By Process, 2020 to 2024
    • Absolute $ Opportunity Analysis By Process, 2025 to 2035
  9. Global Market Analysis 2020 to 2024 and Forecast 2025 to 2035, By Application
    • Introduction / Key Findings
    • Historical Market Size Value (USD Billion) & Volume (Thousand Units) Analysis By Application, 2020 to 2024
    • Current and Future Market Size Value (USD Billion) & Volume (Thousand Units) Analysis and Forecast By Application, 2025 to 2035
      • Semi-Autonomous Truck
      • Autonomous Truck
      • Truck Platooning
      • Predictive Maintenance
      • Precision and Mapping
      • Machine Human Interface
      • Others
    • Y-o-Y Growth Trend Analysis By Application, 2020 to 2024
    • Absolute $ Opportunity Analysis By Application, 2025 to 2035
  10. Global Market Analysis 2020 to 2024 and Forecast 2025 to 2035, By Region
    • Introduction
    • Historical Market Size Value (USD Billion) & Volume (Thousand Units) Analysis By Region, 2020 to 2024
    • Current Market Size Value (USD Billion) & Volume (Thousand Units) Analysis and Forecast By Region, 2025 to 2035
      • North America
      • Latin America
      • Western Europe
      • Eastern Europe
      • East Asia
      • South Asia & Pacific
      • Middle East and Africa
    • Market Attractiveness Analysis By Region
  11. North America Market Analysis 2020 to 2024 and Forecast 2025 to 2035, By Country
    • Historical Market Size Value (USD Billion) & Volume (Thousand Units) Trend Analysis By Market Taxonomy, 2020 to 2024
    • Market Size Value (USD Billion) & Volume (Thousand Units) Forecast By Market Taxonomy, 2025 to 2035
      • By Country
        • USA
        • Canada
        • Mexico
      • By Offering Type
      • By Machine Learning Technology
      • By Process
      • By Application
    • Market Attractiveness Analysis
      • By Country
      • By Offering Type
      • By Machine Learning Technology
      • By Process
      • By Application
    • Key Takeaways
  12. Latin America Market Analysis 2020 to 2024 and Forecast 2025 to 2035, By Country
    • Historical Market Size Value (USD Billion) & Volume (Thousand Units) Trend Analysis By Market Taxonomy, 2020 to 2024
    • Market Size Value (USD Billion) & Volume (Thousand Units) Forecast By Market Taxonomy, 2025 to 2035
      • By Country
        • Brazil
        • Argentina
        • Rest of LATAM
      • By Offering Type
      • By Machine Learning Technology
      • By Process
      • By Application
    • Market Attractiveness Analysis
      • By Country
      • By Offering Type
      • By Machine Learning Technology
      • By Process
      • By Application
    • Key Takeaways
  13. Western Europe Market Analysis 2020 to 2024 and Forecast 2025 to 2035, By Country
    • Historical Market Size Value (USD Billion) & Volume (Thousand Units) Trend Analysis By Market Taxonomy, 2020 to 2024
    • Market Size Value (USD Billion) & Volume (Thousand Units) Forecast By Market Taxonomy, 2025 to 2035
      • By Country
        • Germany
        • Italy
        • France
        • UK
        • Spain
        • BENELUX
        • Nordic
        • Rest of W.Europe
      • By Offering Type
      • By Machine Learning Technology
      • By Process
      • By Application
    • Market Attractiveness Analysis
      • By Country
      • By Offering Type
      • By Machine Learning Technology
      • By Process
      • By Application
    • Key Takeaways
  14. Eastern Europe Market Analysis 2020 to 2024 and Forecast 2025 to 2035, By Country
    • Historical Market Size Value (USD Billion) & Volume (Thousand Units) Trend Analysis By Market Taxonomy, 2020 to 2024
    • Market Size Value (USD Billion) & Volume (Thousand Units) Forecast By Market Taxonomy, 2025 to 2035
      • By Country
        • Russia
        • Hungary
        • Poland
        • Balkan & Baltics
        • Rest of E. Europe
      • By Offering Type
      • By Machine Learning Technology
      • By Process
      • By Application
    • Market Attractiveness Analysis
      • By Country
      • By Offering Type
      • By Machine Learning Technology
      • By Process
      • By Application
    • Key Takeaways
  15. East Asia Market Analysis 2020 to 2024 and Forecast 2025 to 2035, By Country
    • Historical Market Size Value (USD Billion) & Volume (Thousand Units) Trend Analysis By Market Taxonomy, 2020 to 2024
    • Market Size Value (USD Billion) & Volume (Thousand Units) Forecast By Market Taxonomy, 2025 to 2035
      • By Country
        • China
        • Japan
        • South Korea
      • By Offering Type
      • By Machine Learning Technology
      • By Process
      • By Application
    • Market Attractiveness Analysis
      • By Country
      • By Offering Type
      • By Machine Learning Technology
      • By Process
      • By Application
    • Key Takeaways
  16. South Asia & Pacific Market Analysis 2020 to 2024 and Forecast 2025 to 2035, By Country
    • Historical Market Size Value (USD Billion) & Volume (Thousand Units) Trend Analysis By Market Taxonomy, 2020 to 2024
    • Market Size Value (USD Billion) & Volume (Thousand Units) Forecast By Market Taxonomy, 2025 to 2035
      • By Country
        • India
        • Australia & New Zealand
        • ASEAN
        • Rest of SAP
      • By Offering Type
      • By Machine Learning Technology
      • By Process
      • By Application
    • Market Attractiveness Analysis
      • By Country
      • By Offering Type
      • By Machine Learning Technology
      • By Process
      • By Application
    • Key Takeaways
  17. Middle East and Africa Market Analysis 2020 to 2024 and Forecast 2025 to 2035, By Country
    • Historical Market Size Value (USD Billion) & Volume (Thousand Units) Trend Analysis By Market Taxonomy, 2020 to 2024
    • Market Size Value (USD Billion) & Volume (Thousand Units) Forecast By Market Taxonomy, 2025 to 2035
      • By Country
        • GCC Countries
        • Northern Africa
        • South Africa
        • Turkiye
        • Rest of MEA
      • By Offering Type
      • By Machine Learning Technology
      • By Process
      • By Application
    • Market Attractiveness Analysis
      • By Country
      • By Offering Type
      • By Machine Learning Technology
      • By Process
      • By Application
    • Key Takeaways
  18. Key Countries Market Analysis
    • USA
      • Pricing Analysis
      • Market Share Analysis, 2024
        • By Offering Type
        • By Machine Learning Technology
        • By Process
        • By Application
    • Canada
      • Pricing Analysis
      • Market Share Analysis, 2024
        • By Offering Type
        • By Machine Learning Technology
        • By Process
        • By Application
    • Brazil
      • Pricing Analysis
      • Market Share Analysis, 2024
        • By Offering Type
        • By Machine Learning Technology
        • By Process
        • By Application
    • Mexico
      • Pricing Analysis
      • Market Share Analysis, 2024
        • By Offering Type
        • By Machine Learning Technology
        • By Process
        • By Application
    • Argentina
      • Pricing Analysis
      • Market Share Analysis, 2024
        • By Offering Type
        • By Machine Learning Technology
        • By Process
        • By Application
  19. Market Structure Analysis
    • Competition Dashboard
    • Competition Benchmarking
    • Market Share Analysis of Top Players
      • By Regional
      • By Offering Type
      • By Machine Learning Technology
      • By Process
      • By Application
  20. Competition Analysis
    • Competition Deep Dive
      • Continental AG
        • Overview
        • Product Portfolio
        • Profitability by Market Segments (Product/Age /Sales Channel/Region)
        • Sales Footprint
        • Strategy Overview
          • Marketing Strategy
          • Product Strategy
          • Channel Strategy
      • Yachiyo Industry Co., Ltd.
        • Overview
        • Product Portfolio
        • Profitability by Market Segments (Product/Age /Sales Channel/Region)
        • Sales Footprint
        • Strategy Overview
          • Marketing Strategy
          • Product Strategy
          • Channel Strategy
      • Kautex Textron GmbH & Co. KG
        • Overview
        • Product Portfolio
        • Profitability by Market Segments (Product/Age /Sales Channel/Region)
        • Sales Footprint
        • Strategy Overview
          • Marketing Strategy
          • Product Strategy
          • Channel Strategy
      • TI Automotive Inc.
        • Overview
        • Product Portfolio
        • Profitability by Market Segments (Product/Age /Sales Channel/Region)
        • Sales Footprint
        • Strategy Overview
          • Marketing Strategy
          • Product Strategy
          • Channel Strategy
      • Magna International Inc.
        • Overview
        • Product Portfolio
        • Profitability by Market Segments (Product/Age /Sales Channel/Region)
        • Sales Footprint
        • Strategy Overview
          • Marketing Strategy
          • Product Strategy
          • Channel Strategy
      • YAPP Automotive Parts Co. Ltd.
        • Overview
        • Product Portfolio
        • Profitability by Market Segments (Product/Age /Sales Channel/Region)
        • Sales Footprint
        • Strategy Overview
          • Marketing Strategy
          • Product Strategy
          • Channel Strategy
  21. Assumptions & Acronyms Used
  22. Research Methodology

List of Tables

  • Table 1: Global Market Value (USD Billion) Forecast by Region, 2020-2035
  • Table 2: Global Market Volume (Thousand Units) Forecast by Region, 2020-2035
  • Table 3: Global Market Value (USD Billion) Forecast by Offering Type, 2020-2035
  • Table 4: Global Market Volume (Thousand Units) Forecast by Offering Type, 2020-2035
  • Table 5: Global Market Value (USD Billion) Forecast by Machine Learning Technology, 2020-2035
  • Table 6: Global Market Volume (Thousand Units) Forecast by Machine Learning Technology, 2020-2035
  • Table 7: Global Market Value (USD Billion) Forecast by Process, 2020-2035
  • Table 8: Global Market Volume (Thousand Units) Forecast by Process, 2020-2035
  • Table 9: Global Market Value (USD Billion) Forecast by Application, 2020-2035
  • Table 10: Global Market Volume (Thousand Units) Forecast by Application, 2020-2035
  • Table 11: North America Market Value (USD Billion) Forecast by Country, 2020-2035
  • Table 12: North America Market Volume (Thousand Units) Forecast by Country, 2020-2035
  • Table 13: North America Market Value (USD Billion) Forecast by Offering Type, 2020-2035
  • Table 14: North America Market Volume (Thousand Units) Forecast by Offering Type, 2020-2035
  • Table 15: North America Market Value (USD Billion) Forecast by Machine Learning Technology, 2020-2035
  • Table 16: North America Market Volume (Thousand Units) Forecast by Machine Learning Technology, 2020-2035
  • Table 17: North America Market Value (USD Billion) Forecast by Process, 2020-2035
  • Table 18: North America Market Volume (Thousand Units) Forecast by Process, 2020-2035
  • Table 19: North America Market Value (USD Billion) Forecast by Application, 2020-2035
  • Table 20: North America Market Volume (Thousand Units) Forecast by Application, 2020-2035
  • Table 21: Latin America Market Value (USD Billion) Forecast by Country, 2020-2035
  • Table 22: Latin America Market Volume (Thousand Units) Forecast by Country, 2020-2035
  • Table 23: Latin America Market Value (USD Billion) Forecast by Offering Type, 2020-2035
  • Table 24: Latin America Market Volume (Thousand Units) Forecast by Offering Type, 2020-2035
  • Table 25: Latin America Market Value (USD Billion) Forecast by Machine Learning Technology, 2020-2035
  • Table 26: Latin America Market Volume (Thousand Units) Forecast by Machine Learning Technology, 2020-2035
  • Table 27: Latin America Market Value (USD Billion) Forecast by Process, 2020-2035
  • Table 28: Latin America Market Volume (Thousand Units) Forecast by Process, 2020-2035
  • Table 29: Latin America Market Value (USD Billion) Forecast by Application, 2020-2035
  • Table 30: Latin America Market Volume (Thousand Units) Forecast by Application, 2020-2035
  • Table 31: Western Europe Market Value (USD Billion) Forecast by Country, 2020-2035
  • Table 32: Western Europe Market Volume (Thousand Units) Forecast by Country, 2020-2035
  • Table 33: Western Europe Market Value (USD Billion) Forecast by Offering Type, 2020-2035
  • Table 34: Western Europe Market Volume (Thousand Units) Forecast by Offering Type, 2020-2035
  • Table 35: Western Europe Market Value (USD Billion) Forecast by Machine Learning Technology, 2020-2035
  • Table 36: Western Europe Market Volume (Thousand Units) Forecast by Machine Learning Technology, 2020-2035
  • Table 37: Western Europe Market Value (USD Billion) Forecast by Process, 2020-2035
  • Table 38: Western Europe Market Volume (Thousand Units) Forecast by Process, 2020-2035
  • Table 39: Western Europe Market Value (USD Billion) Forecast by Application, 2020-2035
  • Table 40: Western Europe Market Volume (Thousand Units) Forecast by Application, 2020-2035
  • Table 41: Eastern Europe Market Value (USD Billion) Forecast by Country, 2020-2035
  • Table 42: Eastern Europe Market Volume (Thousand Units) Forecast by Country, 2020-2035
  • Table 43: Eastern Europe Market Value (USD Billion) Forecast by Offering Type, 2020-2035
  • Table 44: Eastern Europe Market Volume (Thousand Units) Forecast by Offering Type, 2020-2035
  • Table 45: Eastern Europe Market Value (USD Billion) Forecast by Machine Learning Technology, 2020-2035
  • Table 46: Eastern Europe Market Volume (Thousand Units) Forecast by Machine Learning Technology, 2020-2035
  • Table 47: Eastern Europe Market Value (USD Billion) Forecast by Process, 2020-2035
  • Table 48: Eastern Europe Market Volume (Thousand Units) Forecast by Process, 2020-2035
  • Table 49: Eastern Europe Market Value (USD Billion) Forecast by Application, 2020-2035
  • Table 50: Eastern Europe Market Volume (Thousand Units) Forecast by Application, 2020-2035
  • Table 51: East Asia Market Value (USD Billion) Forecast by Country, 2020-2035
  • Table 52: East Asia Market Volume (Thousand Units) Forecast by Country, 2020-2035
  • Table 53: East Asia Market Value (USD Billion) Forecast by Offering Type, 2020-2035
  • Table 54: East Asia Market Volume (Thousand Units) Forecast by Offering Type, 2020-2035
  • Table 55: East Asia Market Value (USD Billion) Forecast by Machine Learning Technology, 2020-2035
  • Table 56: East Asia Market Volume (Thousand Units) Forecast by Machine Learning Technology, 2020-2035
  • Table 57: East Asia Market Value (USD Billion) Forecast by Process, 2020-2035
  • Table 58: East Asia Market Volume (Thousand Units) Forecast by Process, 2020-2035
  • Table 59: East Asia Market Value (USD Billion) Forecast by Application, 2020-2035
  • Table 60: East Asia Market Volume (Thousand Units) Forecast by Application, 2020-2035
  • Table 61: South Asia & Pacific Market Value (USD Billion) Forecast by Country, 2020-2035
  • Table 62: South Asia & Pacific Market Volume (Thousand Units) Forecast by Country, 2020-2035
  • Table 63: South Asia & Pacific Market Value (USD Billion) Forecast by Offering Type, 2020-2035
  • Table 64: South Asia & Pacific Market Volume (Thousand Units) Forecast by Offering Type, 2020-2035
  • Table 65: South Asia & Pacific Market Value (USD Billion) Forecast by Machine Learning Technology, 2020-2035
  • Table 66: South Asia & Pacific Market Volume (Thousand Units) Forecast by Machine Learning Technology, 2020-2035
  • Table 67: South Asia & Pacific Market Value (USD Billion) Forecast by Process, 2020-2035
  • Table 68: South Asia & Pacific Market Volume (Thousand Units) Forecast by Process, 2020-2035
  • Table 69: South Asia & Pacific Market Value (USD Billion) Forecast by Application, 2020-2035
  • Table 70: South Asia & Pacific Market Volume (Thousand Units) Forecast by Application, 2020-2035
  • Table 71: Middle East and Africa Market Value (USD Billion) Forecast by Country, 2020-2035
  • Table 72: Middle East and Africa Market Volume (Thousand Units) Forecast by Country, 2020-2035
  • Table 73: Middle East and Africa Market Value (USD Billion) Forecast by Offering Type, 2020-2035
  • Table 74: Middle East and Africa Market Volume (Thousand Units) Forecast by Offering Type, 2020-2035
  • Table 75: Middle East and Africa Market Value (USD Billion) Forecast by Machine Learning Technology, 2020-2035
  • Table 76: Middle East and Africa Market Volume (Thousand Units) Forecast by Machine Learning Technology, 2020-2035
  • Table 77: Middle East and Africa Market Value (USD Billion) Forecast by Process, 2020-2035
  • Table 78: Middle East and Africa Market Volume (Thousand Units) Forecast by Process, 2020-2035
  • Table 79: Middle East and Africa Market Value (USD Billion) Forecast by Application, 2020-2035
  • Table 80: Middle East and Africa Market Volume (Thousand Units) Forecast by Application, 2020-2035

List of Figures

  • Figure 1: Global Market Volume (Thousand Units) Forecast 2020-2035
  • Figure 2: Global Market Pricing Analysis
  • Figure 3: Global Market Value (USD Billion) Forecast 2020-2035
  • Figure 4: Global Market Value Share and BPS Analysis by Offering Type, 2025 and 2035
  • Figure 5: Global Market Y-o-Y Growth Comparison by Offering Type, 2025-2035
  • Figure 6: Global Market Attractiveness Analysis by Offering Type
  • Figure 7: Global Market Value Share and BPS Analysis by Machine Learning Technology, 2025 and 2035
  • Figure 8: Global Market Y-o-Y Growth Comparison by Machine Learning Technology, 2025-2035
  • Figure 9: Global Market Attractiveness Analysis by Machine Learning Technology
  • Figure 10: Global Market Value Share and BPS Analysis by Process, 2025 and 2035
  • Figure 11: Global Market Y-o-Y Growth Comparison by Process, 2025-2035
  • Figure 12: Global Market Attractiveness Analysis by Process
  • Figure 13: Global Market Value Share and BPS Analysis by Application, 2025 and 2035
  • Figure 14: Global Market Y-o-Y Growth Comparison by Application, 2025-2035
  • Figure 15: Global Market Attractiveness Analysis by Application
  • Figure 16: Global Market Value (USD Billion) Share and BPS Analysis by Region, 2025 and 2035
  • Figure 17: Global Market Y-o-Y Growth Comparison by Region, 2025-2035
  • Figure 18: Global Market Attractiveness Analysis by Region
  • Figure 19: North America Market Incremental $ Opportunity, 2025-2035
  • Figure 20: Latin America Market Incremental $ Opportunity, 2025-2035
  • Figure 21: Western Europe Market Incremental $ Opportunity, 2025-2035
  • Figure 22: Eastern Europe Market Incremental $ Opportunity, 2025-2035
  • Figure 23: East Asia Market Incremental $ Opportunity, 2025-2035
  • Figure 24: South Asia & Pacific Market Incremental $ Opportunity, 2025-2035
  • Figure 25: Middle East and Africa Market Incremental $ Opportunity, 2025-2035
  • Figure 26: North America Market Value Share and BPS Analysis by Country, 2025 and 2035
  • Figure 27: North America Market Value Share and BPS Analysis by Offering Type, 2025 and 2035
  • Figure 28: North America Market Y-o-Y Growth Comparison by Offering Type, 2025-2035
  • Figure 29: North America Market Attractiveness Analysis by Offering Type
  • Figure 30: North America Market Value Share and BPS Analysis by Machine Learning Technology, 2025 and 2035
  • Figure 31: North America Market Y-o-Y Growth Comparison by Machine Learning Technology, 2025-2035
  • Figure 32: North America Market Attractiveness Analysis by Machine Learning Technology
  • Figure 33: North America Market Value Share and BPS Analysis by Process, 2025 and 2035
  • Figure 34: North America Market Y-o-Y Growth Comparison by Process, 2025-2035
  • Figure 35: North America Market Attractiveness Analysis by Process
  • Figure 36: North America Market Value Share and BPS Analysis by Application, 2025 and 2035
  • Figure 37: North America Market Y-o-Y Growth Comparison by Application, 2025-2035
  • Figure 38: North America Market Attractiveness Analysis by Application
  • Figure 39: Latin America Market Value Share and BPS Analysis by Country, 2025 and 2035
  • Figure 40: Latin America Market Value Share and BPS Analysis by Offering Type, 2025 and 2035
  • Figure 41: Latin America Market Y-o-Y Growth Comparison by Offering Type, 2025-2035
  • Figure 42: Latin America Market Attractiveness Analysis by Offering Type
  • Figure 43: Latin America Market Value Share and BPS Analysis by Machine Learning Technology, 2025 and 2035
  • Figure 44: Latin America Market Y-o-Y Growth Comparison by Machine Learning Technology, 2025-2035
  • Figure 45: Latin America Market Attractiveness Analysis by Machine Learning Technology
  • Figure 46: Latin America Market Value Share and BPS Analysis by Process, 2025 and 2035
  • Figure 47: Latin America Market Y-o-Y Growth Comparison by Process, 2025-2035
  • Figure 48: Latin America Market Attractiveness Analysis by Process
  • Figure 49: Latin America Market Value Share and BPS Analysis by Application, 2025 and 2035
  • Figure 50: Latin America Market Y-o-Y Growth Comparison by Application, 2025-2035
  • Figure 51: Latin America Market Attractiveness Analysis by Application
  • Figure 52: Western Europe Market Value Share and BPS Analysis by Country, 2025 and 2035
  • Figure 53: Western Europe Market Value Share and BPS Analysis by Offering Type, 2025 and 2035
  • Figure 54: Western Europe Market Y-o-Y Growth Comparison by Offering Type, 2025-2035
  • Figure 55: Western Europe Market Attractiveness Analysis by Offering Type
  • Figure 56: Western Europe Market Value Share and BPS Analysis by Machine Learning Technology, 2025 and 2035
  • Figure 57: Western Europe Market Y-o-Y Growth Comparison by Machine Learning Technology, 2025-2035
  • Figure 58: Western Europe Market Attractiveness Analysis by Machine Learning Technology
  • Figure 59: Western Europe Market Value Share and BPS Analysis by Process, 2025 and 2035
  • Figure 60: Western Europe Market Y-o-Y Growth Comparison by Process, 2025-2035
  • Figure 61: Western Europe Market Attractiveness Analysis by Process
  • Figure 62: Western Europe Market Value Share and BPS Analysis by Application, 2025 and 2035
  • Figure 63: Western Europe Market Y-o-Y Growth Comparison by Application, 2025-2035
  • Figure 64: Western Europe Market Attractiveness Analysis by Application
  • Figure 65: Eastern Europe Market Value Share and BPS Analysis by Country, 2025 and 2035
  • Figure 66: Eastern Europe Market Value Share and BPS Analysis by Offering Type, 2025 and 2035
  • Figure 67: Eastern Europe Market Y-o-Y Growth Comparison by Offering Type, 2025-2035
  • Figure 68: Eastern Europe Market Attractiveness Analysis by Offering Type
  • Figure 69: Eastern Europe Market Value Share and BPS Analysis by Machine Learning Technology, 2025 and 2035
  • Figure 70: Eastern Europe Market Y-o-Y Growth Comparison by Machine Learning Technology, 2025-2035
  • Figure 71: Eastern Europe Market Attractiveness Analysis by Machine Learning Technology
  • Figure 72: Eastern Europe Market Value Share and BPS Analysis by Process, 2025 and 2035
  • Figure 73: Eastern Europe Market Y-o-Y Growth Comparison by Process, 2025-2035
  • Figure 74: Eastern Europe Market Attractiveness Analysis by Process
  • Figure 75: Eastern Europe Market Value Share and BPS Analysis by Application, 2025 and 2035
  • Figure 76: Eastern Europe Market Y-o-Y Growth Comparison by Application, 2025-2035
  • Figure 77: Eastern Europe Market Attractiveness Analysis by Application
  • Figure 78: East Asia Market Value Share and BPS Analysis by Country, 2025 and 2035
  • Figure 79: East Asia Market Value Share and BPS Analysis by Offering Type, 2025 and 2035
  • Figure 80: East Asia Market Y-o-Y Growth Comparison by Offering Type, 2025-2035
  • Figure 81: East Asia Market Attractiveness Analysis by Offering Type
  • Figure 82: East Asia Market Value Share and BPS Analysis by Machine Learning Technology, 2025 and 2035
  • Figure 83: East Asia Market Y-o-Y Growth Comparison by Machine Learning Technology, 2025-2035
  • Figure 84: East Asia Market Attractiveness Analysis by Machine Learning Technology
  • Figure 85: East Asia Market Value Share and BPS Analysis by Process, 2025 and 2035
  • Figure 86: East Asia Market Y-o-Y Growth Comparison by Process, 2025-2035
  • Figure 87: East Asia Market Attractiveness Analysis by Process
  • Figure 88: East Asia Market Value Share and BPS Analysis by Application, 2025 and 2035
  • Figure 89: East Asia Market Y-o-Y Growth Comparison by Application, 2025-2035
  • Figure 90: East Asia Market Attractiveness Analysis by Application
  • Figure 91: South Asia & Pacific Market Value Share and BPS Analysis by Country, 2025 and 2035
  • Figure 92: South Asia & Pacific Market Value Share and BPS Analysis by Offering Type, 2025 and 2035
  • Figure 93: South Asia & Pacific Market Y-o-Y Growth Comparison by Offering Type, 2025-2035
  • Figure 94: South Asia & Pacific Market Attractiveness Analysis by Offering Type
  • Figure 95: South Asia & Pacific Market Value Share and BPS Analysis by Machine Learning Technology, 2025 and 2035
  • Figure 96: South Asia & Pacific Market Y-o-Y Growth Comparison by Machine Learning Technology, 2025-2035
  • Figure 97: South Asia & Pacific Market Attractiveness Analysis by Machine Learning Technology
  • Figure 98: South Asia & Pacific Market Value Share and BPS Analysis by Process, 2025 and 2035
  • Figure 99: South Asia & Pacific Market Y-o-Y Growth Comparison by Process, 2025-2035
  • Figure 100: South Asia & Pacific Market Attractiveness Analysis by Process
  • Figure 101: South Asia & Pacific Market Value Share and BPS Analysis by Application, 2025 and 2035
  • Figure 102: South Asia & Pacific Market Y-o-Y Growth Comparison by Application, 2025-2035
  • Figure 103: South Asia & Pacific Market Attractiveness Analysis by Application
  • Figure 104: Middle East and Africa Market Value Share and BPS Analysis by Country, 2025 and 2035
  • Figure 105: Middle East and Africa Market Value Share and BPS Analysis by Offering Type, 2025 and 2035
  • Figure 106: Middle East and Africa Market Y-o-Y Growth Comparison by Offering Type, 2025-2035
  • Figure 107: Middle East and Africa Market Attractiveness Analysis by Offering Type
  • Figure 108: Middle East and Africa Market Value Share and BPS Analysis by Machine Learning Technology, 2025 and 2035
  • Figure 109: Middle East and Africa Market Y-o-Y Growth Comparison by Machine Learning Technology, 2025-2035
  • Figure 110: Middle East and Africa Market Attractiveness Analysis by Machine Learning Technology
  • Figure 111: Middle East and Africa Market Value Share and BPS Analysis by Process, 2025 and 2035
  • Figure 112: Middle East and Africa Market Y-o-Y Growth Comparison by Process, 2025-2035
  • Figure 113: Middle East and Africa Market Attractiveness Analysis by Process
  • Figure 114: Middle East and Africa Market Value Share and BPS Analysis by Application, 2025 and 2035
  • Figure 115: Middle East and Africa Market Y-o-Y Growth Comparison by Application, 2025-2035
  • Figure 116: Middle East and Africa Market Attractiveness Analysis by Application
  • Figure 117: Global Market - Tier Structure Analysis
  • Figure 118: Global Market - Company Share Analysis

Frequently Asked Questions

What is the market size of the AI in transportation market in 2025?

The market size is valued at USD 9 billion in 2025.

How much will the AI in transportation market reach by 2035?

It is projected to reach USD 71 billion by 2035.

What is the forecast CAGR for the AI in transportation market from 2025 to 2035?

The market is expected to grow at a CAGR of 22.8% during 2025-2035.

Which offering holds the largest share in the market?

Software - Solutions holds the largest share with 32% in 2025.

Who is the leading player in the market?

Continental AG is the leading player with 21% share.

Explore Similar Insights

Future Market Insights

AI in Transportation Market