Reports

- Global Locations -

Headquarters

Future Market Insights, Inc.

Christiana Corporate, 200
Continental Drive, Suite 401,
Newark, Delaware - 19713,
United States

T: +1-347-918-3531

Americas

Future Market Insights, Inc.

616 Corporate Way, Suite 2-9018,
Valley Cottage, NY 10989, United States

MEA

Future Market Insights

1602-6 Jumeirah Bay X2 Tower, Plot No: JLT-PH2-X2A,
Jumeirah Lakes Towers, Dubai,
United Arab Emirates

Europe

Future Market Insights

3rd Floor, 207 Regent Street,
W1B 3HH London
United Kingdom

T: + 44 (0) 20 8123 9659

Asia Pacific

Future Market Insights

IndiaLand Global Tech Park, Unit UG-1, Behind Grand HighStreet, Phase 1, Hinjawadi, MH, Pune – 411057, India

Water-soluble Packaging Market Outlook (2023 to 2033)

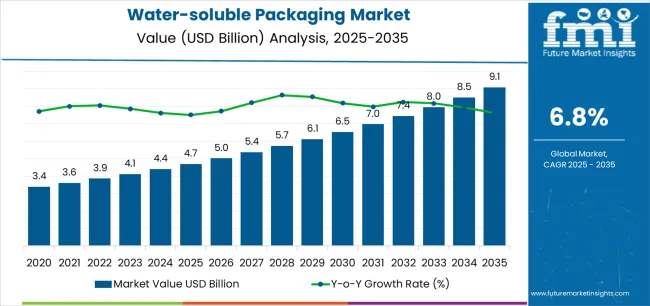
The water-soluble packaging market size is projected to be worth US$ 3,450 million in 2023. The market is likely to surpass US$ 6,491 million by 2033 at a CAGR of 4.0% during the forecast period.

People are Increasingly Turning to Bio-based and Biodegradable Plastics

  • The water-soluble packaging market is a rapidly growing industry that offers environmentally friendly solutions for packaging products.
  • Water-soluble packaging materials dissolve in water and leave no residue; they are widely utilized in industries such as food, healthcare, agriculture, and consumer products.
  • Growing demand for sustainable packaging, government limits on plastic waste, and rising consumer awareness of environmental issues are driving the industry.
  • Key companies are investing in research and development to improve the quality of water-soluble packaging materials and diversify their application areas.
  • Asia Pacific is the core region in the market due to the high adoption of sustainable practices combined with favorable policies and awareness campaigns.

Overall, water-soluble packaging is an environmentally beneficial and sustainable alternative with numerous advantages.

What Should Manufacturers Consider Before Entering Water-Soluble Packaging Industry?

  • Material Selection: Water-soluble packing materials must be carefully chosen by manufacturers. The material must be consumer-safe, environmentally sustainable, and cost-effective.
  • Manufacturing Process: Water-soluble packaging production is more complex than traditional packaging. Manufacturers must ensure that they have the requisite equipment and skills to consistently produce high-quality packaging.
  • Product Compatibility: Not all items are suited for water-soluble packaging. Manufacturers must consider product qualities such as pH and temperature to ensure that the packaging does not dissolve prematurely or damage the quality of the product.
  • Strategy: Manufacturers must have a robust marketing strategy in place to educate consumers on the benefits of water-soluble packaging. Moreover, differentiate their products from traditional packaging solutions.
  • Regulations and Certifications: Water-soluble packaging manufacturers must follow regulations and receive the relevant certifications. This includes ensuring that the packaging is both safe for consumers and compliant with environmental regulations.
  • Supply Chain and Logistics: Manufacturing companies must examine the influence of water-soluble packaging on their supply chain and operations. This includes ensuring compatibility with existing packing equipment, transit, and storage.

Manufacturers who carefully analyze these criteria can effectively enter this expanding sector and provide customers with sustainable, innovative packaging options.

Despite the Numerous Benefits of Water-soluble Packaging, the Market Confronts Several Hurdles in its Expansion.

  • Lack of awareness and education among consumers and manufacturers
  • High production costs compared to traditional packaging materials
  • Limited availability and accessibility of water-soluble packaging materials and machinery
  • Concerns over the strength and durability of water-soluble packaging, particularly for heavier or bulkier products
  • Limited compatibility with certain products and environments, such as high temperatures or humidity
  • Challenges with recycling and waste management, as water-soluble packaging must be disposed of in water and may not be suitable for all waste treatment facilities.

Trends in the Water-soluble Packaging Market:

  • New materials are being developed for water-soluble packaging, such as polysaccharides and proteins, to enhance their properties and sustainability.
  • Water-soluble packaging is being highly adopted in the agriculture sector to deliver agrochemicals, improving crop yields and reducing environmental impact.
  • Water-soluble packaging is gaining popularity in the cosmetics industry for products like soaps and shampoos, due to its convenience and eco-friendliness.
  • Leading brands in the food and beverage industry like Nestle, PepsiCo, and Coca-Cola are exploring water-soluble packaging. To improve sustainability and reduce environmental impact.
  • Startups are emerging in the water-soluble packaging industry, offering innovative and sustainable solutions that attract investors and customers looking for environmentally friendly packaging options.
Attribute Details
Water-soluble Packaging Market Size (2023) US$ 3,450 million
Water-soluble Packaging Market Projected Size (2033) US$ 6,491 million
Value CAGR (2023 to 2033) 6.5%

Don't pay for what you don't need

Customize your report by selecting specific countries or regions and save 30%!

2018 to 2022 Water-soluble Packaging Demand Outlook Compared to 2023 to 2033 Forecast

Since 2018, the market has grown significantly due to increased demand for eco-friendly and sustainable packaging solutions.

The discovery of novel materials, such as polysaccharides and proteins, has enhanced the characteristics and sustainability of water-soluble packaging. Water-soluble packaging is under consideration by key food and beverage firms, as well as startups. To reduce environmental impact and promote sustainability.

Governments throughout the world are also enacting policies to decrease plastic waste and encourage sustainable packaging solutions.

Future Forecast for Water-soluble Packaging Industry:

The water-soluble packaging business is predicted to have a substantial impact on the packaging industry as a whole between 2023 and 2033. Many sectors are likely to adopt it as a standard packaging option.

The usage of biodegradable and compostable materials in water-soluble packaging is projected to grow as customer demand for eco-friendly packaging solutions grows.

Technological developments and greater R&D expenditure are projected to result in the development of more cost-effective water-soluble packaging solutions. As more businesses enter the market, competition is projected to expand, perhaps driving down costs and improving accessibility.

The water-soluble packaging industry is predicted to be a key contributor to the circular economy in 10 years, with a focus on waste reduction and sustainability.

Comparative View of the Adjacent Market

Water-soluble Packaging Market:

Attributes Water-soluble Packaging Market
CAGR (2023 to 2033) 6.5%
Market Value (2033) US$ 6,491 million
Opportunity Growing demand from power generation, cement, and mining industries to minimize their residues.
Key Trends Increasing adoption of renewable energy sources and stringent government regulations for pollution control.

Biodegradable Packaging Market:

Attributes Biodegradable Packaging Market
CAGR (2023 to 2033) 6.1%
Market Value (2033) US$ 475 billion
Opportunity Rising awareness about the benefits of biodegradable packaging and government initiative toward sustainability
Key Trends Increasing demand for sustainable and eco-friendly packaging from several end-use industries.

Zero-waste Packaging Market:

Attributes Zero-waste Packaging Market
CAGR (2023 to 2033) 8.8%
Market Value (2033) US$ 2,490 million
Opportunity Rising environmental concerns and increasing consumers' consciousness to shift from plastic to biodegradable things.
Key Trends Increase in recycling and reusing packaging by consumers and manufacturers to prevent environmental pollution
Ismail Sutaria
Ismail Sutaria

Principal Consultant

Talk to Analyst

Find your sweet spots for generating winning opportunities in this market.

Country-wise Insights

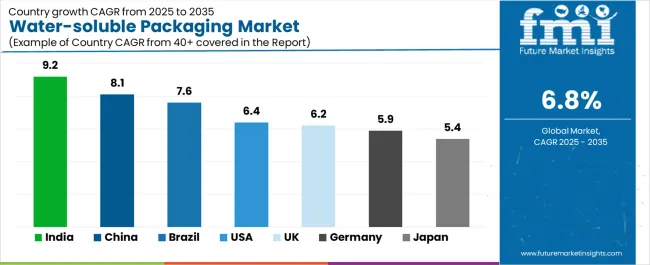
The United States and Canada are Significant Economies in the Water-soluble Packaging Sector in North America.

  • The region has a thriving food and beverage industry, which makes extensive use of water-soluble packaging.
  • In North America, rising environmental concerns and legislation are increasing the demand for sustainable packaging alternatives, particularly water-soluble packaging.
  • North America's well-established pharmaceutical and healthcare industries are also projected to boost expansion in the market.
  • The presence of numerous prominent companies in North America, such as Kuraray and Aicello, is projected to contribute to market growth.
  • Several firms in the water-soluble packaging market are also emerging in North America, offering new and sustainable solutions.
  • Rising demand for water-soluble packaging in power generation and cement industries to propel the united kingdom market growth

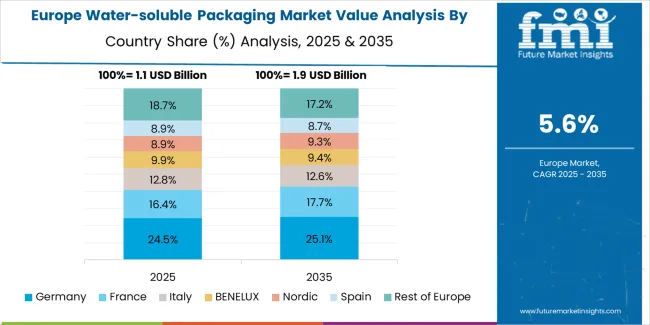
With a Market Share of over 30%, Europe is a Prominent Player in the Global Water-soluble Packaging Business.

  • The region is valuing high on sustainability and environmental preservation, which has raised the demand for environmentally friendly packaging solutions.
  • In Europe, the food and beverage sectors are the vital end-users of water-soluble packaging, followed by the agrochemicals and pharmaceutical industries.
  • Germany, France, and the United Kingdom are crucial markets in Europe for water-soluble packaging.
  • The European Union has implemented several rules to decrease plastic waste and encourage sustainable packaging alternatives, which are likely to drive the region's use of water-soluble packaging.
  • Kuraray Co. Ltd., Aicello Corporation, and Sekisui Chemical Co. Ltd. are key companies in the European water-soluble packaging market.
  • Notable Growth Expected in China's Water-soluble Packaging Market as Government Focuses on Industrial Emission Reduction

The Asia Pacific Region has a Significant Market Share in the industry, Accounting for A Large Portion of the Global Market.

  • The region is likely to increase significantly over the forecast period as a result of rising demand for eco-friendly packaging solutions and the adoption of stringent legislation aimed at reducing plastic waste.
  • Countries like China, India, Japan, and South Korea are important contributors to the region's water-soluble packaging market growth.
  • Rising disposable incomes and changing lifestyles are driving demand for packaged food and beverages, which in turn is driving the need for water-soluble packaging.
  • The region's agriculture business is also using water-soluble packaging for pesticide delivery, which is projected to contribute to market growth.
  • The region is home to several important players in the water-soluble packaging business, including Kuraray, Aicello, and Mitsubishi Chemical.

Category-wise Insights

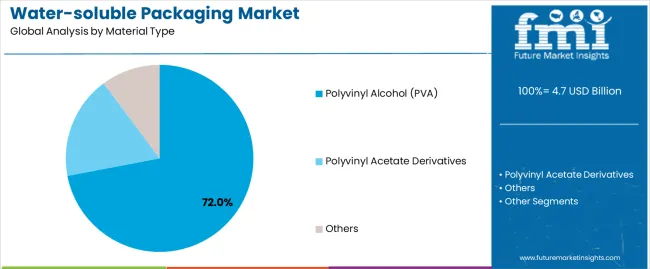
The Polymer Segment in Water-soluble Packaging Uses Polymers that Dissolve in Water, Providing a Sustainable Alternative to Traditional Packaging Materials.

  • Manufacturers focus on developing new and improved polymers to enhance packaging properties like strength, durability, and biodegradability.
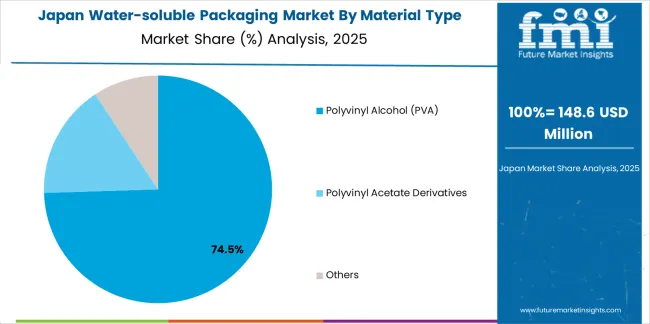
  • Common water-soluble polymers used in packaging include PVA, PEO, and starch-based polymers.
  • In Europe, PVA holds its influence in the market, while North America has a more diversified market with PVA, PEO, and other polymers.
  • The Asia Pacific region also has a significant PVA segment but is showing interest in other biodegradable and compostable polymers.
  • The polymer segment is expected to continue to grow as new materials and applications are developed.

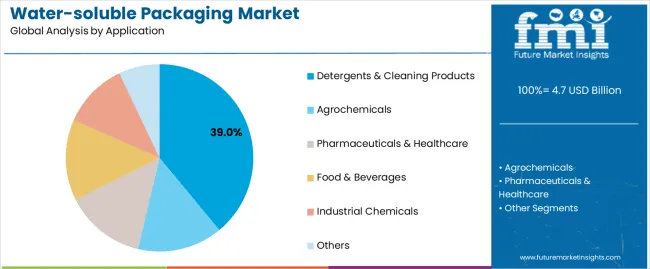
The food and Beverage Industry Highly Adopt Water-soluble Packaging due to its ability to Improve Sustainability and Reduce Plastic Waste.

  • Brands such as Nestle, PepsiCo, and Coca-Cola are exploring the use of water-soluble packaging to reduce their environmental impact and improve sustainability.
  • Water-soluble packaging can be used for a variety of products in the food and beverage industry, including powdered drinks, snack foods, and instant noodles.
  • The packaging dissolves quickly and easily, making it convenient for consumers and reducing waste.
  • Water-soluble packaging also offers advantages in terms of product safety and freshness, as it can provide a barrier against moisture and oxygen.

Get the data you need at a Fraction of the cost

Personalize your report by choosing insights you need
and save 40%!

The Competitive Landscape is driven by factors such as Innovation, Sustainability, Cost-effectiveness, and Regulatory Compliance.

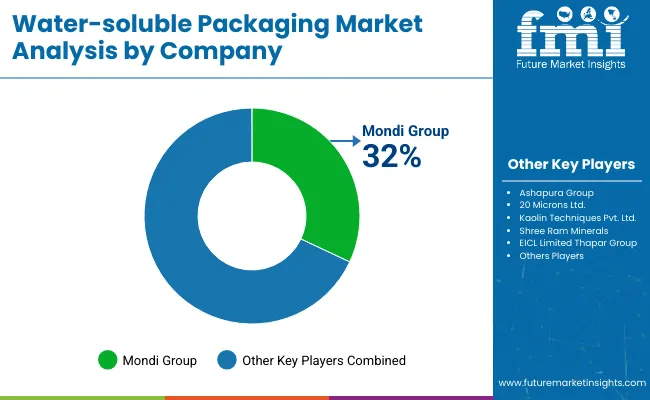
The market players are focusing on expanding their product offerings. By developing new materials and technologies, and collaborating with other companies and institutions to gain a competitive edge in the market. Additionally, mergers and acquisitions are common in the industry, as companies look to consolidate their positions and acquire new technologies and capabilities.

  • Sizable food and beverage companies such as Nestle, PepsiCo, and Coca-Cola, are exploring the use of water-soluble packaging in their products.
  • Startups and smaller companies such as TIPA, Aquapak Polymers Ltd., and Lactips, are focused on developing innovative and sustainable water-soluble packaging solutions.
  • Research institutions and universities, that are conducting R&D in the field of water-soluble packaging and developing new materials and technologies.

Key Players

  • Lithey Inc.
  • Mondi Group
  • Sekisui Chemicals
  • Kuraray Co.Ltd
  • Mitsubishi Chemicals Holdings
  • Aquapak Polymers Ltd
  • Lactips
  • Cortec Corporation
  • Acedag Ltd.
  • MSD Corporation
  • Prodotti Solutions
  • JRF Technology LLC
  • Amtopak Inc.

Key Developments in the Market:

  • In 2019, Kuraray Co. Ltd. bought MonoSol LLC, a water-soluble filmmaker based in the United States. Kuraray was able to increase its product line and strengthen its position in the water-soluble packaging industry as a result of this purchase.
  • Lactips, a French firm that manufactures water-soluble and biodegradable thermoplastic pellets, announced a collaboration with Mitsubishi Chemical Corporation in 2020. This collaboration aims to create and market water-soluble and biodegradable packaging materials for the Japanese market.
  • Avient Corporation announced in 2021 acquired Clariant's Masterbatch business, which offers water-soluble polymer compounds. This acquisition is expected to broaden Avient's product line and boost its position in the market for water-soluble packaging.

Segmentation Analysis of the Market

By Raw Material:

  • Polymers
  • Surfactants
  • Fibers

By Design:

  • Plate
  • Tubular

By End-user Industry:

  • Industrial
  • Food and Beverages
  • Pharmaceuticals
  • Agriculture
  • Chemical
  • Water Treatment
  • Residential

By Region:

  • North America
  • Latin America
  • Europe
  • East Asia
  • South Asia
  • Oceania
  • The Middle East & Africa

Frequently Asked Questions

How Big will the Market be in the United States by 2033?

The United States market will generate a high revenue by 2033.

Which Country is Set to Register Exponential Growth in the Water Soluble Packaging Market?

The United States, France and Germany may witness significant growth in the global market.

What Drives Sales of Water Soluble Packaging?

The growing focus on sustainability are expected to drive sales.

What Key Trends are Driving the Water Soluble Packaging Market?

Increasing food & beverages sector may drive market growth over the coming years.

How was the Historical Performance of the Optic Atrophy Management Market?

The market recorded a CAGR of 4.0% in 2022.

Table of Content

1. Executive Summary

    1.1. Global Market Outlook

    1.2. Demand-side Trends

    1.3. Supply-side Trends

    1.4. Technology Roadmap Analysis

    1.5. Analysis and Recommendations

2. Market Overview

    2.1. Market Coverage / Taxonomy

    2.2. Market Definition / Scope / Limitations

3. Market Background

    3.1. Market Dynamics

        3.1.1. Drivers

        3.1.2. Restraints

        3.1.3. Opportunity

        3.1.4. Trends

    3.2. Scenario Forecast

        3.2.1. Demand in Optimistic Scenario

        3.2.2. Demand in Likely Scenario

        3.2.3. Demand in Conservative Scenario

    3.3. Product Launches & Recent Developments

    3.4. Product Life Cycle Analysis

    3.5. Value Chain Analysis

        3.5.1. Supply Side Participants and Their Roles

            3.5.1.1. Producers

            3.5.1.2. Mid-Level Participants (Traders/ Agents/ Brokers)

            3.5.1.3. Wholesalers and Distributors

        3.5.2. % of Operating Margin Analysis

        3.5.3. List of Existing and Potential Buyers

    3.6. Pricing Analysis

        3.6.1. Price Point Assessment by Region

        3.6.2. Price Point Assessment by Production

        3.6.3. Price Forecast till 2033

        3.6.4. Factors affecting pricing

    3.7. Forecast Factors - Relevance & Impact

    3.8. Regulatory Landscape

    3.9. Regional Parent Market Outlook

    3.10. Production and Consumption Statistics

    3.11. Consumers Survey Analysis

    3.12. Macro-Economic Factors

4. Global Analysis 2018 to 2022 and Forecast, 2023 to 2033

    4.1. Historical Market Size Value (US$ Million) & Volume (Tons) Analysis, 2018 to 2022

    4.2. Current and Future Market Size Value (US$ Million) & Volume (Tons) Projections, 2023 to 2033

        4.2.1. Y-o-Y Growth Trend Analysis

        4.2.2. Absolute $ Opportunity Analysis

5. Global Analysis 2018 to 2022 and Forecast 2023 to 2033, By Material

    5.1. Introduction / Key Findings

    5.2. Historical Market Size Value (US$ Million) & Volume (Tons) Analysis By Material, 2018 to 2022

    5.3. Current and Future Market Size Value (US$ Million) & Volume (Tons) Analysis and Forecast By Material, 2023 to 2033

        5.3.1. Polyvinyl Alcohol (PVA)

        5.3.2. LDPE (Low-Density Polyethylene)

        5.3.3. HDPE (High-Density Polyethylene)

    5.4. Y-o-Y Growth Trend Analysis By Material, 2018 to 2022

    5.5. Absolute $ Opportunity Analysis By Material, 2023 to 2033

6. Global Analysis 2018 to 2022 and Forecast 2023 to 2033, By Product

    6.1. Introduction / Key Findings

    6.2. Historical Market Size Value (US$ Million) & Volume (Tons) Analysis By Product, 2018 to 2022

    6.3. Current and Future Market Size Value (US$ Million) & Volume (Tons) Analysis and Forecast By Product, 2023 to 2033

        6.3.1. Bags

        6.3.2. Pouches

        6.3.3. Pods & Capsules

    6.4. Y-o-Y Growth Trend Analysis By Product, 2018 to 2022

    6.5. Absolute $ Opportunity Analysis By Product, 2023 to 2033

7. Global Analysis 2018 to 2022 and Forecast 2023 to 2033, By Capacity

    7.1. Introduction / Key Findings

    7.2. Historical Market Size Value (US$ Million) & Volume (Tons) Analysis By Capacity, 2018 to 2022

    7.3. Current and Future Market Size Value (US$ Million) & Volume (Tons) Analysis and Forecast By Capacity, 2023 to 2033

        7.3.1. Less than 50 ml

        7.3.2. 51 to 200 ml

        7.3.3. 201 to 300 ml

        7.3.4. Above 300 ml

    7.4. Y-o-Y Growth Trend Analysis By Capacity, 2018 to 2022

    7.5. Absolute $ Opportunity Analysis By Capacity, 2023 to 2033

8. Global Analysis 2018 to 2022 and Forecast 2023 to 2033, By End Use

    8.1. Introduction / Key Findings

    8.2. Historical Market Size Value (US$ Million) & Volume (Tons) Analysis By End Use, 2018 to 2022

    8.3. Current and Future Market Size Value (US$ Million) & Volume (Tons) Analysis and Forecast By End Use, 2023 to 2033

        8.3.1. Chemical & Agrochemical

        8.3.2. Personal Care & Cosmetics

        8.3.3. Home Care

        8.3.4. Food

        8.3.5. Pharmaceuticals

    8.4. Y-o-Y Growth Trend Analysis By End Use, 2018 to 2022

    8.5. Absolute $ Opportunity Analysis By End Use, 2023 to 2033

9. Global Analysis 2018 to 2022 and Forecast 2023 to 2033, By Region

    9.1. Introduction

    9.2. Historical Market Size Value (US$ Million) & Volume (Tons) Analysis By Region, 2018 to 2022

    9.3. Current Market Size Value (US$ Million) & Volume (Tons) Analysis and Forecast By Region, 2023 to 2033

        9.3.1. North America

        9.3.2. Latin America

        9.3.3. Europe

        9.3.4. East Asia

        9.3.5. South Asia

        9.3.6. Oceania

        9.3.7. Middle East and Africa(MEA)

    9.4. Market Attractiveness Analysis By Region

10. North America Analysis 2018 to 2022 and Forecast 2023 to 2033, By Country

    10.1. Historical Market Size Value (US$ Million) & Volume (Tons) Trend Analysis By Market Taxonomy, 2018 to 2022

    10.2. Market Size Value (US$ Million) & Volume (Tons) Forecast By Market Taxonomy, 2023 to 2033

        10.2.1. By Country

            10.2.1.1. USA

            10.2.1.2. Canada

        10.2.2. By Material

        10.2.3. By Product

        10.2.4. By Capacity

        10.2.5. By End Use

    10.3. Market Attractiveness Analysis

        10.3.1. By Country

        10.3.2. By Material

        10.3.3. By Product

        10.3.4. By Capacity

        10.3.5. By End Use

    10.4. Key Takeaways

11. Latin America Analysis 2018 to 2022 and Forecast 2023 to 2033, By Country

    11.1. Historical Market Size Value (US$ Million) & Volume (Tons) Trend Analysis By Market Taxonomy, 2018 to 2022

    11.2. Market Size Value (US$ Million) & Volume (Tons) Forecast By Market Taxonomy, 2023 to 2033

        11.2.1. By Country

            11.2.1.1. Brazil

            11.2.1.2. Mexico

            11.2.1.3. Argentina

            11.2.1.4. Rest of Latin America

        11.2.2. By Material

        11.2.3. By Product

        11.2.4. By Capacity

        11.2.5. By End Use

    11.3. Market Attractiveness Analysis

        11.3.1. By Country

        11.3.2. By Material

        11.3.3. By Product

        11.3.4. By Capacity

        11.3.5. By End Use

    11.4. Key Takeaways

12. Europe Analysis 2018 to 2022 and Forecast 2023 to 2033, By Country

    12.1. Historical Market Size Value (US$ Million) & Volume (Tons) Trend Analysis By Market Taxonomy, 2018 to 2022

    12.2. Market Size Value (US$ Million) & Volume (Tons) Forecast By Market Taxonomy, 2023 to 2033

        12.2.1. By Country

            12.2.1.1. Germany

            12.2.1.2. Italy

            12.2.1.3. France

            12.2.1.4. United Kingdom

            12.2.1.5. Spain

            12.2.1.6. Russia

            12.2.1.7. BENELUX

            12.2.1.8. Poland

            12.2.1.9. Nordic Countries

            12.2.1.10. Rest of Europe

        12.2.2. By Material

        12.2.3. By Product

        12.2.4. By Capacity

        12.2.5. By End Use

    12.3. Market Attractiveness Analysis

        12.3.1. By Country

        12.3.2. By Material

        12.3.3. By Product

        12.3.4. By Capacity

        12.3.5. By End Use

    12.4. Key Takeaways

13. East Asia Analysis 2018 to 2022 and Forecast 2023 to 2033, By Country

    13.1. Historical Market Size Value (US$ Million) & Volume (Tons) Trend Analysis By Market Taxonomy, 2018 to 2022

    13.2. Market Size Value (US$ Million) & Volume (Tons) Forecast By Market Taxonomy, 2023 to 2033

        13.2.1. By Country

            13.2.1.1. China

            13.2.1.2. Japan

            13.2.1.3. South Korea

        13.2.2. By Material

        13.2.3. By Product

        13.2.4. By Capacity

        13.2.5. By End Use

    13.3. Market Attractiveness Analysis

        13.3.1. By Country

        13.3.2. By Material

        13.3.3. By Product

        13.3.4. By Capacity

        13.3.5. By End Use

    13.4. Key Takeaways

14. South Asia Analysis 2018 to 2022 and Forecast 2023 to 2033, By Country

    14.1. Historical Market Size Value (US$ Million) & Volume (Tons) Trend Analysis By Market Taxonomy, 2018 to 2022

    14.2. Market Size Value (US$ Million) & Volume (Tons) Forecast By Market Taxonomy, 2023 to 2033

        14.2.1. By Country

            14.2.1.1. India

            14.2.1.2. Thailand

            14.2.1.3. Malaysia

            14.2.1.4. Indonesia

            14.2.1.5. Singapore

            14.2.1.6. Rest of South Asia

        14.2.2. By Material

        14.2.3. By Product

        14.2.4. By Capacity

        14.2.5. By End Use

    14.3. Market Attractiveness Analysis

        14.3.1. By Country

        14.3.2. By Material

        14.3.3. By Product

        14.3.4. By Capacity

        14.3.5. By End Use

    14.4. Key Takeaways

15. Oceania Analysis 2018 to 2022 and Forecast 2023 to 2033, By Country

    15.1. Historical Market Size Value (US$ Million) & Volume (Tons) Trend Analysis By Market Taxonomy, 2018 to 2022

    15.2. Market Size Value (US$ Million) & Volume (Tons) Forecast By Market Taxonomy, 2023 to 2033

        15.2.1. By Country

            15.2.1.1. Australia

            15.2.1.2. New Zealand

        15.2.2. By Material

        15.2.3. By Product

        15.2.4. By Capacity

        15.2.5. By End Use

    15.3. Market Attractiveness Analysis

        15.3.1. By Country

        15.3.2. By Material

        15.3.3. By Product

        15.3.4. By Capacity

        15.3.5. By End Use

    15.4. Key Takeaways

16. MEA Analysis 2018 to 2022 and Forecast 2023 to 2033, By Country

    16.1. Historical Market Size Value (US$ Million) & Volume (Tons) Trend Analysis By Market Taxonomy, 2018 to 2022

    16.2. Market Size Value (US$ Million) & Volume (Tons) Forecast By Market Taxonomy, 2023 to 2033

        16.2.1. By Country

            16.2.1.1. GCC Countries

            16.2.1.2. South Africa

            16.2.1.3. North Africa

            16.2.1.4. Rest of Middle East and Africa(MEA)

        16.2.2. By Material

        16.2.3. By Product

        16.2.4. By Capacity

        16.2.5. By End Use

    16.3. Market Attractiveness Analysis

        16.3.1. By Country

        16.3.2. By Material

        16.3.3. By Product

        16.3.4. By Capacity

        16.3.5. By End Use

    16.4. Key Takeaways

17. Key Countries Analysis

    17.1. USA

        17.1.1. Pricing Analysis

        17.1.2. Market Share Analysis, 2022

            17.1.2.1. By Material

            17.1.2.2. By Product

            17.1.2.3. By Capacity

            17.1.2.4. By End Use

    17.2. Canada

        17.2.1. Pricing Analysis

        17.2.2. Market Share Analysis, 2022

            17.2.2.1. By Material

            17.2.2.2. By Product

            17.2.2.3. By Capacity

            17.2.2.4. By End Use

    17.3. Brazil

        17.3.1. Pricing Analysis

        17.3.2. Market Share Analysis, 2022

            17.3.2.1. By Material

            17.3.2.2. By Product

            17.3.2.3. By Capacity

            17.3.2.4. By End Use

    17.4. Mexico

        17.4.1. Pricing Analysis

        17.4.2. Market Share Analysis, 2022

            17.4.2.1. By Material

            17.4.2.2. By Product

            17.4.2.3. By Capacity

            17.4.2.4. By End Use

    17.5. Germany

        17.5.1. Pricing Analysis

        17.5.2. Market Share Analysis, 2022

            17.5.2.1. By Material

            17.5.2.2. By Product

            17.5.2.3. By Capacity

            17.5.2.4. By End Use

    17.6. Italy

        17.6.1. Pricing Analysis

        17.6.2. Market Share Analysis, 2022

            17.6.2.1. By Material

            17.6.2.2. By Product

            17.6.2.3. By Capacity

            17.6.2.4. By End Use

    17.7. France

        17.7.1. Pricing Analysis

        17.7.2. Market Share Analysis, 2022

            17.7.2.1. By Material

            17.7.2.2. By Product

            17.7.2.3. By Capacity

            17.7.2.4. By End Use

    17.8. Spain

        17.8.1. Pricing Analysis

        17.8.2. Market Share Analysis, 2022

            17.8.2.1. By Material

            17.8.2.2. By Product

            17.8.2.3. By Capacity

            17.8.2.4. By End Use

    17.9. U.K.

        17.9.1. Pricing Analysis

        17.9.2. Market Share Analysis, 2022

            17.9.2.1. By Material

            17.9.2.2. By Product

            17.9.2.3. By Capacity

            17.9.2.4. By End Use

    17.10. Russia

        17.10.1. Pricing Analysis

        17.10.2. Market Share Analysis, 2022

            17.10.2.1. By Material

            17.10.2.2. By Product

            17.10.2.3. By Capacity

            17.10.2.4. By End Use

    17.11. Poland

        17.11.1. Pricing Analysis

        17.11.2. Market Share Analysis, 2022

            17.11.2.1. By Material

            17.11.2.2. By Product

            17.11.2.3. By Capacity

            17.11.2.4. By End Use

    17.12. BENELUX

        17.12.1. Pricing Analysis

        17.12.2. Market Share Analysis, 2022

            17.12.2.1. By Material

            17.12.2.2. By Product

            17.12.2.3. By Capacity

            17.12.2.4. By End Use

    17.13. Nordic Countries

        17.13.1. Pricing Analysis

        17.13.2. Market Share Analysis, 2022

            17.13.2.1. By Material

            17.13.2.2. By Product

            17.13.2.3. By Capacity

            17.13.2.4. By End Use

    17.14. China

        17.14.1. Pricing Analysis

        17.14.2. Market Share Analysis, 2022

            17.14.2.1. By Material

            17.14.2.2. By Product

            17.14.2.3. By Capacity

            17.14.2.4. By End Use

    17.15. Japan

        17.15.1. Pricing Analysis

        17.15.2. Market Share Analysis, 2022

            17.15.2.1. By Material

            17.15.2.2. By Product

            17.15.2.3. By Capacity

            17.15.2.4. By End Use

    17.16. South Korea

        17.16.1. Pricing Analysis

        17.16.2. Market Share Analysis, 2022

            17.16.2.1. By Material

            17.16.2.2. By Product

            17.16.2.3. By Capacity

            17.16.2.4. By End Use

    17.17. India

        17.17.1. Pricing Analysis

        17.17.2. Market Share Analysis, 2022

            17.17.2.1. By Material

            17.17.2.2. By Product

            17.17.2.3. By Capacity

            17.17.2.4. By End Use

    17.18. Thailand

        17.18.1. Pricing Analysis

        17.18.2. Market Share Analysis, 2022

            17.18.2.1. By Material

            17.18.2.2. By Product

            17.18.2.3. By Capacity

            17.18.2.4. By End Use

    17.19. Indonesia

        17.19.1. Pricing Analysis

        17.19.2. Market Share Analysis, 2022

            17.19.2.1. By Material

            17.19.2.2. By Product

            17.19.2.3. By Capacity

            17.19.2.4. By End Use

    17.20. Malaysia

        17.20.1. Pricing Analysis

        17.20.2. Market Share Analysis, 2022

            17.20.2.1. By Material

            17.20.2.2. By Product

            17.20.2.3. By Capacity

            17.20.2.4. By End Use

    17.21. Singapore

        17.21.1. Pricing Analysis

        17.21.2. Market Share Analysis, 2022

            17.21.2.1. By Material

            17.21.2.2. By Product

            17.21.2.3. By Capacity

            17.21.2.4. By End Use

    17.22. Australia

        17.22.1. Pricing Analysis

        17.22.2. Market Share Analysis, 2022

            17.22.2.1. By Material

            17.22.2.2. By Product

            17.22.2.3. By Capacity

            17.22.2.4. By End Use

    17.23. GCC Countries

        17.23.1. Pricing Analysis

        17.23.2. Market Share Analysis, 2022

            17.23.2.1. By Material

            17.23.2.2. By Product

            17.23.2.3. By Capacity

            17.23.2.4. By End Use

    17.24. South Africa

        17.24.1. Pricing Analysis

        17.24.2. Market Share Analysis, 2022

            17.24.2.1. By Material

            17.24.2.2. By Product

            17.24.2.3. By Capacity

            17.24.2.4. By End Use

    17.25. North Africa

        17.25.1. Pricing Analysis

        17.25.2. Market Share Analysis, 2022

            17.25.2.1. By Material

            17.25.2.2. By Product

            17.25.2.3. By Capacity

            17.25.2.4. By End Use

18. Market Structure Analysis

    18.1. Competition Dashboard

    18.2. Competition Benchmarking

    18.3. Market Share Analysis of Top Players

        18.3.1. By Regional

        18.3.2. By Material

        18.3.3. By Product

        18.3.4. By Capacity

        18.3.5. By End Use

19. Competition Analysis

    19.1. Competition Deep Dive

        19.1.1. POLYE MATERIALS CO., LTD

            19.1.1.1. Overview

            19.1.1.2. Product Portfolio

            19.1.1.3. Profitability by Market Segments (Product/Age /Sales Channel/Region)

            19.1.1.4. Sales Footprint

            19.1.1.5. Strategy Overview

                19.1.1.5.1. Marketing Strategy

                19.1.1.5.2. Product Strategy

                19.1.1.5.3. Channel Strategy

        19.1.2. Chromogreen

            19.1.2.1. Overview

            19.1.2.2. Product Portfolio

            19.1.2.3. Profitability by Market Segments (Product/Age /Sales Channel/Region)

            19.1.2.4. Sales Footprint

            19.1.2.5. Strategy Overview

                19.1.2.5.1. Marketing Strategy

                19.1.2.5.2. Product Strategy

                19.1.2.5.3. Channel Strategy

        19.1.3. ESCARRÉ AUTOMATIZACIÓN Y SERVICIOS, S.L

            19.1.3.1. Overview

            19.1.3.2. Product Portfolio

            19.1.3.3. Profitability by Market Segments (Product/Age /Sales Channel/Region)

            19.1.3.4. Sales Footprint

            19.1.3.5. Strategy Overview

                19.1.3.5.1. Marketing Strategy

                19.1.3.5.2. Product Strategy

                19.1.3.5.3. Channel Strategy

        19.1.4. Acedag Limited

            19.1.4.1. Overview

            19.1.4.2. Product Portfolio

            19.1.4.3. Profitability by Market Segments (Product/Age /Sales Channel/Region)

            19.1.4.4. Sales Footprint

            19.1.4.5. Strategy Overview

                19.1.4.5.1. Marketing Strategy

                19.1.4.5.2. Product Strategy

                19.1.4.5.3. Channel Strategy

        19.1.5. Extra Packaging Corporation

            19.1.5.1. Overview

            19.1.5.2. Product Portfolio

            19.1.5.3. Profitability by Market Segments (Product/Age /Sales Channel/Region)

            19.1.5.4. Sales Footprint

            19.1.5.5. Strategy Overview

                19.1.5.5.1. Marketing Strategy

                19.1.5.5.2. Product Strategy

                19.1.5.5.3. Channel Strategy

        19.1.6. TREVOR OWEN LIMITED

            19.1.6.1. Overview

            19.1.6.2. Product Portfolio

            19.1.6.3. Profitability by Market Segments (Product/Age /Sales Channel/Region)

            19.1.6.4. Sales Footprint

            19.1.6.5. Strategy Overview

                19.1.6.5.1. Marketing Strategy

                19.1.6.5.2. Product Strategy

                19.1.6.5.3. Channel Strategy

        19.1.7. EOS Plast Srl

            19.1.7.1. Overview

            19.1.7.2. Product Portfolio

            19.1.7.3. Profitability by Market Segments (Product/Age /Sales Channel/Region)

            19.1.7.4. Sales Footprint

            19.1.7.5. Strategy Overview

                19.1.7.5.1. Marketing Strategy

                19.1.7.5.2. Product Strategy

                19.1.7.5.3. Channel Strategy

        19.1.8. DESCO INDIA

            19.1.8.1. Overview

            19.1.8.2. Product Portfolio

            19.1.8.3. Profitability by Market Segments (Product/Age /Sales Channel/Region)

            19.1.8.4. Sales Footprint

            19.1.8.5. Strategy Overview

                19.1.8.5.1. Marketing Strategy

                19.1.8.5.2. Product Strategy

                19.1.8.5.3. Channel Strategy

        19.1.9. Rovi Packaging, S.A.

            19.1.9.1. Overview

            19.1.9.2. Product Portfolio

            19.1.9.3. Profitability by Market Segments (Product/Age /Sales Channel/Region)

            19.1.9.4. Sales Footprint

            19.1.9.5. Strategy Overview

                19.1.9.5.1. Marketing Strategy

                19.1.9.5.2. Product Strategy

                19.1.9.5.3. Channel Strategy

        19.1.10. Adventpac

            19.1.10.1. Overview

            19.1.10.2. Product Portfolio

            19.1.10.3. Profitability by Market Segments (Product/Age /Sales Channel/Region)

            19.1.10.4. Sales Footprint

            19.1.10.5. Strategy Overview

                19.1.10.5.1. Marketing Strategy

                19.1.10.5.2. Product Strategy

                19.1.10.5.3. Channel Strategy

        19.1.11. Green Tech Bio Products

            19.1.11.1. Overview

            19.1.11.2. Product Portfolio

            19.1.11.3. Profitability by Market Segments (Product/Age /Sales Channel/Region)

            19.1.11.4. Sales Footprint

            19.1.11.5. Strategy Overview

                19.1.11.5.1. Marketing Strategy

                19.1.11.5.2. Product Strategy

                19.1.11.5.3. Channel Strategy

        19.1.12. Shanghai Yifu Packaging Products Co., Ltd

            19.1.12.1. Overview

            19.1.12.2. Product Portfolio

            19.1.12.3. Profitability by Market Segments (Product/Age /Sales Channel/Region)

            19.1.12.4. Sales Footprint

            19.1.12.5. Strategy Overview

                19.1.12.5.1. Marketing Strategy

                19.1.12.5.2. Product Strategy

                19.1.12.5.3. Channel Strategy

        19.1.13. Aquapak

            19.1.13.1. Overview

            19.1.13.2. Product Portfolio

            19.1.13.3. Profitability by Market Segments (Product/Age /Sales Channel/Region)

            19.1.13.4. Sales Footprint

            19.1.13.5. Strategy Overview

                19.1.13.5.1. Marketing Strategy

                19.1.13.5.2. Product Strategy

                19.1.13.5.3. Channel Strategy

        19.1.14. Value (US$ Million) & Volume (Tons)ed States Plastic Corporation

            19.1.14.1. Overview

            19.1.14.2. Product Portfolio

            19.1.14.3. Profitability by Market Segments (Product/Age /Sales Channel/Region)

            19.1.14.4. Sales Footprint

            19.1.14.5. Strategy Overview

                19.1.14.5.1. Marketing Strategy

                19.1.14.5.2. Product Strategy

                19.1.14.5.3. Channel Strategy

        19.1.15. FOSHAN POLYVA MATERIALS CO., LTD

            19.1.15.1. Overview

            19.1.15.2. Product Portfolio

            19.1.15.3. Profitability by Market Segments (Product/Age /Sales Channel/Region)

            19.1.15.4. Sales Footprint

            19.1.15.5. Strategy Overview

                19.1.15.5.1. Marketing Strategy

                19.1.15.5.2. Product Strategy

                19.1.15.5.3. Channel Strategy

20. Assumptions & Acronyms Used

21. Research Methodology

List of Tables

Table 1: Global Value (US$ Million) Forecast by Region, 2018 to 2033

Table 2: Global Volume (Tons) Forecast by Region, 2018 to 2033

Table 3: Global Value (US$ Million) Forecast by Material, 2018 to 2033

Table 4: Global Volume (Tons) Forecast by Material, 2018 to 2033

Table 5: Global Value (US$ Million) Forecast by Product, 2018 to 2033

Table 6: Global Volume (Tons) Forecast by Product, 2018 to 2033

Table 7: Global Value (US$ Million) Forecast by Capacity, 2018 to 2033

Table 8: Global Volume (Tons) Forecast by Capacity, 2018 to 2033

Table 9: Global Value (US$ Million) Forecast by End Use, 2018 to 2033

Table 10: Global Volume (Tons) Forecast by End Use, 2018 to 2033

Table 11: North America Value (US$ Million) Forecast by Country, 2018 to 2033

Table 12: North America Volume (Tons) Forecast by Country, 2018 to 2033

Table 13: North America Value (US$ Million) Forecast by Material, 2018 to 2033

Table 14: North America Volume (Tons) Forecast by Material, 2018 to 2033

Table 15: North America Value (US$ Million) Forecast by Product, 2018 to 2033

Table 16: North America Volume (Tons) Forecast by Product, 2018 to 2033

Table 17: North America Value (US$ Million) Forecast by Capacity, 2018 to 2033

Table 18: North America Volume (Tons) Forecast by Capacity, 2018 to 2033

Table 19: North America Value (US$ Million) Forecast by End Use, 2018 to 2033

Table 20: North America Volume (Tons) Forecast by End Use, 2018 to 2033

Table 21: Latin America Value (US$ Million) Forecast by Country, 2018 to 2033

Table 22: Latin America Volume (Tons) Forecast by Country, 2018 to 2033

Table 23: Latin America Value (US$ Million) Forecast by Material, 2018 to 2033

Table 24: Latin America Volume (Tons) Forecast by Material, 2018 to 2033

Table 25: Latin America Value (US$ Million) Forecast by Product, 2018 to 2033

Table 26: Latin America Volume (Tons) Forecast by Product, 2018 to 2033

Table 27: Latin America Value (US$ Million) Forecast by Capacity, 2018 to 2033

Table 28: Latin America Volume (Tons) Forecast by Capacity, 2018 to 2033

Table 29: Latin America Value (US$ Million) Forecast by End Use, 2018 to 2033

Table 30: Latin America Volume (Tons) Forecast by End Use, 2018 to 2033

Table 31: Europe Value (US$ Million) Forecast by Country, 2018 to 2033

Table 32: Europe Volume (Tons) Forecast by Country, 2018 to 2033

Table 33: Europe Value (US$ Million) Forecast by Material, 2018 to 2033

Table 34: Europe Volume (Tons) Forecast by Material, 2018 to 2033

Table 35: Europe Value (US$ Million) Forecast by Product, 2018 to 2033

Table 36: Europe Volume (Tons) Forecast by Product, 2018 to 2033

Table 37: Europe Value (US$ Million) Forecast by Capacity, 2018 to 2033

Table 38: Europe Volume (Tons) Forecast by Capacity, 2018 to 2033

Table 39: Europe Value (US$ Million) Forecast by End Use, 2018 to 2033

Table 40: Europe Volume (Tons) Forecast by End Use, 2018 to 2033

Table 41: East Asia Value (US$ Million) Forecast by Country, 2018 to 2033

Table 42: East Asia Volume (Tons) Forecast by Country, 2018 to 2033

Table 43: East Asia Value (US$ Million) Forecast by Material, 2018 to 2033

Table 44: East Asia Volume (Tons) Forecast by Material, 2018 to 2033

Table 45: East Asia Value (US$ Million) Forecast by Product, 2018 to 2033

Table 46: East Asia Volume (Tons) Forecast by Product, 2018 to 2033

Table 47: East Asia Value (US$ Million) Forecast by Capacity, 2018 to 2033

Table 48: East Asia Volume (Tons) Forecast by Capacity, 2018 to 2033

Table 49: East Asia Value (US$ Million) Forecast by End Use, 2018 to 2033

Table 50: East Asia Volume (Tons) Forecast by End Use, 2018 to 2033

Table 51: South Asia Value (US$ Million) Forecast by Country, 2018 to 2033

Table 52: South Asia Volume (Tons) Forecast by Country, 2018 to 2033

Table 53: South Asia Value (US$ Million) Forecast by Material, 2018 to 2033

Table 54: South Asia Volume (Tons) Forecast by Material, 2018 to 2033

Table 55: South Asia Value (US$ Million) Forecast by Product, 2018 to 2033

Table 56: South Asia Volume (Tons) Forecast by Product, 2018 to 2033

Table 57: South Asia Value (US$ Million) Forecast by Capacity, 2018 to 2033

Table 58: South Asia Volume (Tons) Forecast by Capacity, 2018 to 2033

Table 59: South Asia Value (US$ Million) Forecast by End Use, 2018 to 2033

Table 60: South Asia Volume (Tons) Forecast by End Use, 2018 to 2033

Table 61: Oceania Value (US$ Million) Forecast by Country, 2018 to 2033

Table 62: Oceania Volume (Tons) Forecast by Country, 2018 to 2033

Table 63: Oceania Value (US$ Million) Forecast by Material, 2018 to 2033

Table 64: Oceania Volume (Tons) Forecast by Material, 2018 to 2033

Table 65: Oceania Value (US$ Million) Forecast by Product, 2018 to 2033

Table 66: Oceania Volume (Tons) Forecast by Product, 2018 to 2033

Table 67: Oceania Value (US$ Million) Forecast by Capacity, 2018 to 2033

Table 68: Oceania Volume (Tons) Forecast by Capacity, 2018 to 2033

Table 69: Oceania Value (US$ Million) Forecast by End Use, 2018 to 2033

Table 70: Oceania Volume (Tons) Forecast by End Use, 2018 to 2033

Table 71: MEA Value (US$ Million) Forecast by Country, 2018 to 2033

Table 72: MEA Volume (Tons) Forecast by Country, 2018 to 2033

Table 73: MEA Value (US$ Million) Forecast by Material, 2018 to 2033

Table 74: MEA Volume (Tons) Forecast by Material, 2018 to 2033

Table 75: MEA Value (US$ Million) Forecast by Product, 2018 to 2033

Table 76: MEA Volume (Tons) Forecast by Product, 2018 to 2033

Table 77: MEA Value (US$ Million) Forecast by Capacity, 2018 to 2033

Table 78: MEA Volume (Tons) Forecast by Capacity, 2018 to 2033

Table 79: MEA Value (US$ Million) Forecast by End Use, 2018 to 2033

Table 80: MEA Volume (Tons) Forecast by End Use, 2018 to 2033

List of Charts

Figure 1: Global Value (US$ Million) by Material, 2023 to 2033

Figure 2: Global Value (US$ Million) by Product, 2023 to 2033

Figure 3: Global Value (US$ Million) by Capacity, 2023 to 2033

Figure 4: Global Value (US$ Million) by End Use, 2023 to 2033

Figure 5: Global Value (US$ Million) by Region, 2023 to 2033

Figure 6: Global Value (US$ Million) Analysis by Region, 2018 to 2033

Figure 7: Global Volume (Tons) Analysis by Region, 2018 to 2033

Figure 8: Global Value Share (%) and BPS Analysis by Region, 2023 to 2033

Figure 9: Global Y-o-Y Growth (%) Projections by Region, 2023 to 2033

Figure 10: Global Value (US$ Million) Analysis by Material, 2018 to 2033

Figure 11: Global Volume (Tons) Analysis by Material, 2018 to 2033

Figure 12: Global Value Share (%) and BPS Analysis by Material, 2023 to 2033

Figure 13: Global Y-o-Y Growth (%) Projections by Material, 2023 to 2033

Figure 14: Global Value (US$ Million) Analysis by Product, 2018 to 2033

Figure 15: Global Volume (Tons) Analysis by Product, 2018 to 2033

Figure 16: Global Value Share (%) and BPS Analysis by Product, 2023 to 2033

Figure 17: Global Y-o-Y Growth (%) Projections by Product, 2023 to 2033

Figure 18: Global Value (US$ Million) Analysis by Capacity, 2018 to 2033

Figure 19: Global Volume (Tons) Analysis by Capacity, 2018 to 2033

Figure 20: Global Value Share (%) and BPS Analysis by Capacity, 2023 to 2033

Figure 21: Global Y-o-Y Growth (%) Projections by Capacity, 2023 to 2033

Figure 22: Global Value (US$ Million) Analysis by End Use, 2018 to 2033

Figure 23: Global Volume (Tons) Analysis by End Use, 2018 to 2033

Figure 24: Global Value Share (%) and BPS Analysis by End Use, 2023 to 2033

Figure 25: Global Y-o-Y Growth (%) Projections by End Use, 2023 to 2033

Figure 26: Global Attractiveness by Material, 2023 to 2033

Figure 27: Global Attractiveness by Product, 2023 to 2033

Figure 28: Global Attractiveness by Capacity, 2023 to 2033

Figure 29: Global Attractiveness by End Use, 2023 to 2033

Figure 30: Global Attractiveness by Region, 2023 to 2033

Figure 31: North America Value (US$ Million) by Material, 2023 to 2033

Figure 32: North America Value (US$ Million) by Product, 2023 to 2033

Figure 33: North America Value (US$ Million) by Capacity, 2023 to 2033

Figure 34: North America Value (US$ Million) by End Use, 2023 to 2033

Figure 35: North America Value (US$ Million) by Country, 2023 to 2033

Figure 36: North America Value (US$ Million) Analysis by Country, 2018 to 2033

Figure 37: North America Volume (Tons) Analysis by Country, 2018 to 2033

Figure 38: North America Value Share (%) and BPS Analysis by Country, 2023 to 2033

Figure 39: North America Y-o-Y Growth (%) Projections by Country, 2023 to 2033

Figure 40: North America Value (US$ Million) Analysis by Material, 2018 to 2033

Figure 41: North America Volume (Tons) Analysis by Material, 2018 to 2033

Figure 42: North America Value Share (%) and BPS Analysis by Material, 2023 to 2033

Figure 43: North America Y-o-Y Growth (%) Projections by Material, 2023 to 2033

Figure 44: North America Value (US$ Million) Analysis by Product, 2018 to 2033

Figure 45: North America Volume (Tons) Analysis by Product, 2018 to 2033

Figure 46: North America Value Share (%) and BPS Analysis by Product, 2023 to 2033

Figure 47: North America Y-o-Y Growth (%) Projections by Product, 2023 to 2033

Figure 48: North America Value (US$ Million) Analysis by Capacity, 2018 to 2033

Figure 49: North America Volume (Tons) Analysis by Capacity, 2018 to 2033

Figure 50: North America Value Share (%) and BPS Analysis by Capacity, 2023 to 2033

Figure 51: North America Y-o-Y Growth (%) Projections by Capacity, 2023 to 2033

Figure 52: North America Value (US$ Million) Analysis by End Use, 2018 to 2033

Figure 53: North America Volume (Tons) Analysis by End Use, 2018 to 2033

Figure 54: North America Value Share (%) and BPS Analysis by End Use, 2023 to 2033

Figure 55: North America Y-o-Y Growth (%) Projections by End Use, 2023 to 2033

Figure 56: North America Attractiveness by Material, 2023 to 2033

Figure 57: North America Attractiveness by Product, 2023 to 2033

Figure 58: North America Attractiveness by Capacity, 2023 to 2033

Figure 59: North America Attractiveness by End Use, 2023 to 2033

Figure 60: North America Attractiveness by Country, 2023 to 2033

Figure 61: Latin America Value (US$ Million) by Material, 2023 to 2033

Figure 62: Latin America Value (US$ Million) by Product, 2023 to 2033

Figure 63: Latin America Value (US$ Million) by Capacity, 2023 to 2033

Figure 64: Latin America Value (US$ Million) by End Use, 2023 to 2033

Figure 65: Latin America Value (US$ Million) by Country, 2023 to 2033

Figure 66: Latin America Value (US$ Million) Analysis by Country, 2018 to 2033

Figure 67: Latin America Volume (Tons) Analysis by Country, 2018 to 2033

Figure 68: Latin America Value Share (%) and BPS Analysis by Country, 2023 to 2033

Figure 69: Latin America Y-o-Y Growth (%) Projections by Country, 2023 to 2033

Figure 70: Latin America Value (US$ Million) Analysis by Material, 2018 to 2033

Figure 71: Latin America Volume (Tons) Analysis by Material, 2018 to 2033

Figure 72: Latin America Value Share (%) and BPS Analysis by Material, 2023 to 2033

Figure 73: Latin America Y-o-Y Growth (%) Projections by Material, 2023 to 2033

Figure 74: Latin America Value (US$ Million) Analysis by Product, 2018 to 2033

Figure 75: Latin America Volume (Tons) Analysis by Product, 2018 to 2033

Figure 76: Latin America Value Share (%) and BPS Analysis by Product, 2023 to 2033

Figure 77: Latin America Y-o-Y Growth (%) Projections by Product, 2023 to 2033

Figure 78: Latin America Value (US$ Million) Analysis by Capacity, 2018 to 2033

Figure 79: Latin America Volume (Tons) Analysis by Capacity, 2018 to 2033

Figure 80: Latin America Value Share (%) and BPS Analysis by Capacity, 2023 to 2033

Figure 81: Latin America Y-o-Y Growth (%) Projections by Capacity, 2023 to 2033

Figure 82: Latin America Value (US$ Million) Analysis by End Use, 2018 to 2033

Figure 83: Latin America Volume (Tons) Analysis by End Use, 2018 to 2033

Figure 84: Latin America Value Share (%) and BPS Analysis by End Use, 2023 to 2033

Figure 85: Latin America Y-o-Y Growth (%) Projections by End Use, 2023 to 2033

Figure 86: Latin America Attractiveness by Material, 2023 to 2033

Figure 87: Latin America Attractiveness by Product, 2023 to 2033

Figure 88: Latin America Attractiveness by Capacity, 2023 to 2033

Figure 89: Latin America Attractiveness by End Use, 2023 to 2033

Figure 90: Latin America Attractiveness by Country, 2023 to 2033

Figure 91: Europe Value (US$ Million) by Material, 2023 to 2033

Figure 92: Europe Value (US$ Million) by Product, 2023 to 2033

Figure 93: Europe Value (US$ Million) by Capacity, 2023 to 2033

Figure 94: Europe Value (US$ Million) by End Use, 2023 to 2033

Figure 95: Europe Value (US$ Million) by Country, 2023 to 2033

Figure 96: Europe Value (US$ Million) Analysis by Country, 2018 to 2033

Figure 97: Europe Volume (Tons) Analysis by Country, 2018 to 2033

Figure 98: Europe Value Share (%) and BPS Analysis by Country, 2023 to 2033

Figure 99: Europe Y-o-Y Growth (%) Projections by Country, 2023 to 2033

Figure 100: Europe Value (US$ Million) Analysis by Material, 2018 to 2033

Figure 101: Europe Volume (Tons) Analysis by Material, 2018 to 2033

Figure 102: Europe Value Share (%) and BPS Analysis by Material, 2023 to 2033

Figure 103: Europe Y-o-Y Growth (%) Projections by Material, 2023 to 2033

Figure 104: Europe Value (US$ Million) Analysis by Product, 2018 to 2033

Figure 105: Europe Volume (Tons) Analysis by Product, 2018 to 2033

Figure 106: Europe Value Share (%) and BPS Analysis by Product, 2023 to 2033

Figure 107: Europe Y-o-Y Growth (%) Projections by Product, 2023 to 2033

Figure 108: Europe Value (US$ Million) Analysis by Capacity, 2018 to 2033

Figure 109: Europe Volume (Tons) Analysis by Capacity, 2018 to 2033

Figure 110: Europe Value Share (%) and BPS Analysis by Capacity, 2023 to 2033

Figure 111: Europe Y-o-Y Growth (%) Projections by Capacity, 2023 to 2033

Figure 112: Europe Value (US$ Million) Analysis by End Use, 2018 to 2033

Figure 113: Europe Volume (Tons) Analysis by End Use, 2018 to 2033

Figure 114: Europe Value Share (%) and BPS Analysis by End Use, 2023 to 2033

Figure 115: Europe Y-o-Y Growth (%) Projections by End Use, 2023 to 2033

Figure 116: Europe Attractiveness by Material, 2023 to 2033

Figure 117: Europe Attractiveness by Product, 2023 to 2033

Figure 118: Europe Attractiveness by Capacity, 2023 to 2033

Figure 119: Europe Attractiveness by End Use, 2023 to 2033

Figure 120: Europe Attractiveness by Country, 2023 to 2033

Figure 121: East Asia Value (US$ Million) by Material, 2023 to 2033

Figure 122: East Asia Value (US$ Million) by Product, 2023 to 2033

Figure 123: East Asia Value (US$ Million) by Capacity, 2023 to 2033

Figure 124: East Asia Value (US$ Million) by End Use, 2023 to 2033

Figure 125: East Asia Value (US$ Million) by Country, 2023 to 2033

Figure 126: East Asia Value (US$ Million) Analysis by Country, 2018 to 2033

Figure 127: East Asia Volume (Tons) Analysis by Country, 2018 to 2033

Figure 128: East Asia Value Share (%) and BPS Analysis by Country, 2023 to 2033

Figure 129: East Asia Y-o-Y Growth (%) Projections by Country, 2023 to 2033

Figure 130: East Asia Value (US$ Million) Analysis by Material, 2018 to 2033

Figure 131: East Asia Volume (Tons) Analysis by Material, 2018 to 2033

Figure 132: East Asia Value Share (%) and BPS Analysis by Material, 2023 to 2033

Figure 133: East Asia Y-o-Y Growth (%) Projections by Material, 2023 to 2033

Figure 134: East Asia Value (US$ Million) Analysis by Product, 2018 to 2033

Figure 135: East Asia Volume (Tons) Analysis by Product, 2018 to 2033

Figure 136: East Asia Value Share (%) and BPS Analysis by Product, 2023 to 2033

Figure 137: East Asia Y-o-Y Growth (%) Projections by Product, 2023 to 2033

Figure 138: East Asia Value (US$ Million) Analysis by Capacity, 2018 to 2033

Figure 139: East Asia Volume (Tons) Analysis by Capacity, 2018 to 2033

Figure 140: East Asia Value Share (%) and BPS Analysis by Capacity, 2023 to 2033

Figure 141: East Asia Y-o-Y Growth (%) Projections by Capacity, 2023 to 2033

Figure 142: East Asia Value (US$ Million) Analysis by End Use, 2018 to 2033

Figure 143: East Asia Volume (Tons) Analysis by End Use, 2018 to 2033

Figure 144: East Asia Value Share (%) and BPS Analysis by End Use, 2023 to 2033

Figure 145: East Asia Y-o-Y Growth (%) Projections by End Use, 2023 to 2033

Figure 146: East Asia Attractiveness by Material, 2023 to 2033

Figure 147: East Asia Attractiveness by Product, 2023 to 2033

Figure 148: East Asia Attractiveness by Capacity, 2023 to 2033

Figure 149: East Asia Attractiveness by End Use, 2023 to 2033

Figure 150: East Asia Attractiveness by Country, 2023 to 2033

Figure 151: South Asia Value (US$ Million) by Material, 2023 to 2033

Figure 152: South Asia Value (US$ Million) by Product, 2023 to 2033

Figure 153: South Asia Value (US$ Million) by Capacity, 2023 to 2033

Figure 154: South Asia Value (US$ Million) by End Use, 2023 to 2033

Figure 155: South Asia Value (US$ Million) by Country, 2023 to 2033

Figure 156: South Asia Value (US$ Million) Analysis by Country, 2018 to 2033

Figure 157: South Asia Volume (Tons) Analysis by Country, 2018 to 2033

Figure 158: South Asia Value Share (%) and BPS Analysis by Country, 2023 to 2033

Figure 159: South Asia Y-o-Y Growth (%) Projections by Country, 2023 to 2033

Figure 160: South Asia Value (US$ Million) Analysis by Material, 2018 to 2033

Figure 161: South Asia Volume (Tons) Analysis by Material, 2018 to 2033

Figure 162: South Asia Value Share (%) and BPS Analysis by Material, 2023 to 2033

Figure 163: South Asia Y-o-Y Growth (%) Projections by Material, 2023 to 2033

Figure 164: South Asia Value (US$ Million) Analysis by Product, 2018 to 2033

Figure 165: South Asia Volume (Tons) Analysis by Product, 2018 to 2033

Figure 166: South Asia Value Share (%) and BPS Analysis by Product, 2023 to 2033

Figure 167: South Asia Y-o-Y Growth (%) Projections by Product, 2023 to 2033

Figure 168: South Asia Value (US$ Million) Analysis by Capacity, 2018 to 2033

Figure 169: South Asia Volume (Tons) Analysis by Capacity, 2018 to 2033

Figure 170: South Asia Value Share (%) and BPS Analysis by Capacity, 2023 to 2033

Figure 171: South Asia Y-o-Y Growth (%) Projections by Capacity, 2023 to 2033

Figure 172: South Asia Value (US$ Million) Analysis by End Use, 2018 to 2033

Figure 173: South Asia Volume (Tons) Analysis by End Use, 2018 to 2033

Figure 174: South Asia Value Share (%) and BPS Analysis by End Use, 2023 to 2033

Figure 175: South Asia Y-o-Y Growth (%) Projections by End Use, 2023 to 2033

Figure 176: South Asia Attractiveness by Material, 2023 to 2033

Figure 177: South Asia Attractiveness by Product, 2023 to 2033

Figure 178: South Asia Attractiveness by Capacity, 2023 to 2033

Figure 179: South Asia Attractiveness by End Use, 2023 to 2033

Figure 180: South Asia Attractiveness by Country, 2023 to 2033

Figure 181: Oceania Value (US$ Million) by Material, 2023 to 2033

Figure 182: Oceania Value (US$ Million) by Product, 2023 to 2033

Figure 183: Oceania Value (US$ Million) by Capacity, 2023 to 2033

Figure 184: Oceania Value (US$ Million) by End Use, 2023 to 2033

Figure 185: Oceania Value (US$ Million) by Country, 2023 to 2033

Figure 186: Oceania Value (US$ Million) Analysis by Country, 2018 to 2033

Figure 187: Oceania Volume (Tons) Analysis by Country, 2018 to 2033

Figure 188: Oceania Value Share (%) and BPS Analysis by Country, 2023 to 2033

Figure 189: Oceania Y-o-Y Growth (%) Projections by Country, 2023 to 2033

Figure 190: Oceania Value (US$ Million) Analysis by Material, 2018 to 2033

Figure 191: Oceania Volume (Tons) Analysis by Material, 2018 to 2033

Figure 192: Oceania Value Share (%) and BPS Analysis by Material, 2023 to 2033

Figure 193: Oceania Y-o-Y Growth (%) Projections by Material, 2023 to 2033

Figure 194: Oceania Value (US$ Million) Analysis by Product, 2018 to 2033

Figure 195: Oceania Volume (Tons) Analysis by Product, 2018 to 2033

Figure 196: Oceania Value Share (%) and BPS Analysis by Product, 2023 to 2033

Figure 197: Oceania Y-o-Y Growth (%) Projections by Product, 2023 to 2033

Figure 198: Oceania Value (US$ Million) Analysis by Capacity, 2018 to 2033

Figure 199: Oceania Volume (Tons) Analysis by Capacity, 2018 to 2033

Figure 200: Oceania Value Share (%) and BPS Analysis by Capacity, 2023 to 2033

Figure 201: Oceania Y-o-Y Growth (%) Projections by Capacity, 2023 to 2033

Figure 202: Oceania Value (US$ Million) Analysis by End Use, 2018 to 2033

Figure 203: Oceania Volume (Tons) Analysis by End Use, 2018 to 2033

Figure 204: Oceania Value Share (%) and BPS Analysis by End Use, 2023 to 2033

Figure 205: Oceania Y-o-Y Growth (%) Projections by End Use, 2023 to 2033

Figure 206: Oceania Attractiveness by Material, 2023 to 2033

Figure 207: Oceania Attractiveness by Product, 2023 to 2033

Figure 208: Oceania Attractiveness by Capacity, 2023 to 2033

Figure 209: Oceania Attractiveness by End Use, 2023 to 2033

Figure 210: Oceania Attractiveness by Country, 2023 to 2033

Figure 211: MEA Value (US$ Million) by Material, 2023 to 2033

Figure 212: MEA Value (US$ Million) by Product, 2023 to 2033

Figure 213: MEA Value (US$ Million) by Capacity, 2023 to 2033

Figure 214: MEA Value (US$ Million) by End Use, 2023 to 2033

Figure 215: MEA Value (US$ Million) by Country, 2023 to 2033

Figure 216: MEA Value (US$ Million) Analysis by Country, 2018 to 2033

Figure 217: MEA Volume (Tons) Analysis by Country, 2018 to 2033

Figure 218: MEA Value Share (%) and BPS Analysis by Country, 2023 to 2033

Figure 219: MEA Y-o-Y Growth (%) Projections by Country, 2023 to 2033

Figure 220: MEA Value (US$ Million) Analysis by Material, 2018 to 2033

Figure 221: MEA Volume (Tons) Analysis by Material, 2018 to 2033

Figure 222: MEA Value Share (%) and BPS Analysis by Material, 2023 to 2033

Figure 223: MEA Y-o-Y Growth (%) Projections by Material, 2023 to 2033

Figure 224: MEA Value (US$ Million) Analysis by Product, 2018 to 2033

Figure 225: MEA Volume (Tons) Analysis by Product, 2018 to 2033

Figure 226: MEA Value Share (%) and BPS Analysis by Product, 2023 to 2033

Figure 227: MEA Y-o-Y Growth (%) Projections by Product, 2023 to 2033

Figure 228: MEA Value (US$ Million) Analysis by Capacity, 2018 to 2033

Figure 229: MEA Volume (Tons) Analysis by Capacity, 2018 to 2033

Figure 230: MEA Value Share (%) and BPS Analysis by Capacity, 2023 to 2033

Figure 231: MEA Y-o-Y Growth (%) Projections by Capacity, 2023 to 2033

Figure 232: MEA Value (US$ Million) Analysis by End Use, 2018 to 2033

Figure 233: MEA Volume (Tons) Analysis by End Use, 2018 to 2033

Figure 234: MEA Value Share (%) and BPS Analysis by End Use, 2023 to 2033

Figure 235: MEA Y-o-Y Growth (%) Projections by End Use, 2023 to 2033

Figure 236: MEA Attractiveness by Material, 2023 to 2033

Figure 237: MEA Attractiveness by Product, 2023 to 2033

Figure 238: MEA Attractiveness by Capacity, 2023 to 2033

Figure 239: MEA Attractiveness by End Use, 2023 to 2033

Figure 240: MEA Attractiveness by Country, 2023 to 2033

Recommendations

Packaging

Zero-waste Packaging Market

Published : July 2023

Packaging

Biodegradable Packaging Market

Published : September 2022

Explore Packaging Insights

View Reports

Water-soluble Packaging Market