Waterless Cosmetics Powders Market Size and Share Forecast Outlook 2025 to 2035

The Waterless Cosmetics Powders Market is anticipated to reach a valuation of USD 1,752.3 million in 2025 and is projected to touch USD 5,210.3 million by 2035. This expansion reflects an absolute gain of USD 3,458 million, marking an increase of nearly 197% over the decade. The growth trajectory corresponds to a robust CAGR of 11.5%, indicating that the market is poised to more than double its size within the forecast horizon.
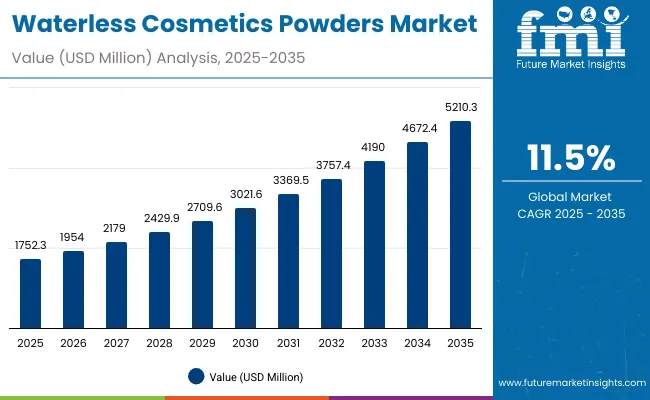
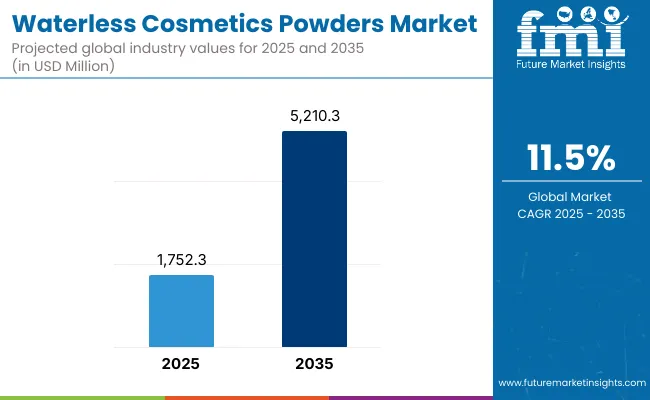
Waterless Cosmetics Powders Market Value Analysis

Quick Stats for Waterless Cosmetics Powders Market

  • Waterless Cosmetics Powders Market Value (2025): USD 1,752.3 million
  • Waterless Cosmetics Powders Market Forecast Value (2035): USD 5,210.3 million
  • Waterless Cosmetics Powders Market Forecast CAGR: 11.5%
  • Leading Segment in the Waterless Cosmetics Powders Market in 2025: E-commerce (51.5%)
  • Key Growth Regions in the Waterless Cosmetics Powders Market: Asia-Pacific (India 24.1% CAGR, China 23.3% CAGR, Japan 17.3% CAGR), Europe (UK 13.9% CAGR, Germany 10.4% CAGR), North America (USA 9.2% CAGR)
  • Top Key Players in the Waterless Cosmetics Powders Market: Unilever, L’Oréal, Shiseido, Procter & Gamble, Colgate-Palmolive, Kaia Naturals, Klorane, By Humankind, Deciem (The Ordinary), Anastasia Beverly Hills, DSM-Firmenich

Waterless Cosmetics Powders Market

Waterless Cosmetics Powders Market Key Takeaways

Metric Value
Waterless Cosmetics Powders Market Estimated Value in (2025E) USD 1,752.3 million
Waterless Cosmetics Powders Market Forecast Value in (2035F) USD 5,210.3 million
Forecast CAGR (2025 to 2035) 11.5%

In the first half of the forecast period, between 2025 and 2030, the market value is expected to climb from USD 1,752.3 million to USD 3,021.6 million, adding nearly USD 1,269.3 million. This phase represents about 36.7% of the total decade growth, supported by early adoption of waterless innovations in cleansing powders and shampoo powders.

The rapid shift toward sustainable formats and strong penetration of e-commerce platforms is expected to accelerate visibility and consumer acceptance. E-commerce is likely to dominate with more than 51% market share by 2025, highlighting the digital-first evolution of this category.

From 2030 to 2035, growth is forecasted to accelerate further as the market expands from USD 3,021.6 million to USD 5,210.3 million, adding approximately USD 2,188.7 million, equal to 63.3% of the overall decade gain. This surge will be reinforced by advanced formulations featuring botanical extracts and multifunctional properties, supported by strong consumer demand for clean-label solutions. Botanical extracts are projected to command nearly 48.5% share in 2025, while premium functional positioning is set to push brightening and hydration formats into mainstream adoption.

From 2020 to 2024, the Waterless Cosmetics Powders Market steadily advanced as early adoption was concentrated in niche beauty and sustainable skincare categories. By 2025, mainstream entry by global majors positioned the market for scale, with e-commerce ecosystems leading adoption.

Looking ahead, revenue composition is expected to shift further toward multifunctional innovations, clean-label formulations, and service-driven brand engagement. Competitive advantage will increasingly be defined by sustainability credentials, ingredient transparency, and digital-first distribution strategies rather than scale alone.

Why the Waterless Cosmetics Powders Market is growing?

Growth in the Waterless Cosmetics Powders Market is being driven by rising consumer awareness of sustainability and the need to reduce water consumption in beauty routines. Strong preference for eco-friendly formulations has been encouraged by increasing concerns over environmental conservation and resource scarcity.

The appeal of concentrated, lightweight, and travel-friendly products has been reinforced by urban lifestyles and frequent mobility, creating stronger adoption across demographics. Demand is further being stimulated by e-commerce platforms that enable seamless access and education about innovative formats. Ingredient innovation, particularly in botanical extracts and vitamin-enriched powders, has enhanced consumer trust while addressing functional skincare needs such as cleansing, brightening, and hydration.

The market is also being accelerated by premiumization trends, with consumers seeking multifunctional, high-performance solutions that align with clean-label standards. Continuous investment by leading global brands and startups is expected to amplify product visibility, while technological advances in formulation science will further expand product applications.

Segmental Analysis

The Waterless Cosmetics Powders Market has been segmented across multiple dimensions to capture evolving consumer demand and product innovation. Segmentation by channel highlights the distribution dynamics, where e-commerce and offline formats collectively shape accessibility. Ingredient base segmentation reflects consumer preferences for natural botanical extracts versus advanced formulations offering functional benefits.

Functional segmentation further emphasizes the growing role of cleansing powders alongside multifunctional products designed for hydration, brightening, and exfoliation. These categories provide a comprehensive view of how demand is being directed by sustainability, convenience, and efficacy. Each segment is expected to exhibit distinct growth patterns, with digital platforms, ingredient innovation, and multifunctional performance emerging as critical drivers of market expansion during the forecast horizon.
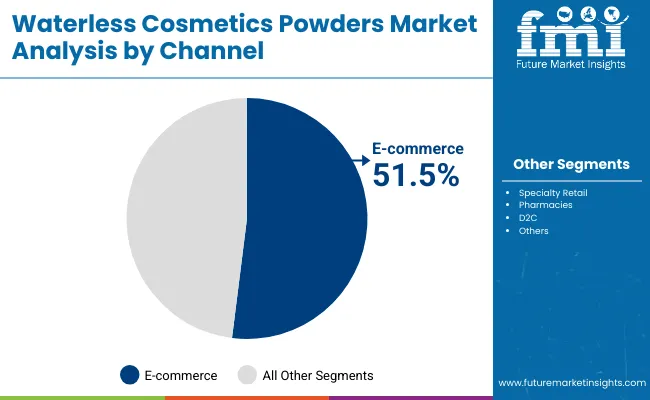
Insights into the Channel Segment with E-commerce Leading in Market Share

Waterless Cosmetics Powders Market By Channel

Segment Market Value Share, 2025
E-commerce 51.5%
Others 48.5%

E-commerce is projected to capture 51.5% share ,This dominance is expected to be reinforced by rising consumer preference for digital platforms that provide convenience, product variety, and access to innovative brands. Direct-to-consumer models are anticipated to thrive, offering tailored experiences and transparent product positioning.

Although offline formats will maintain a presence through specialty retail and pharmacies, their share is forecasted to remain secondary to e-commerce. Strong digital penetration, social commerce, and influencer-led marketing are expected to accelerate online adoption, ensuring e-commerce retains its leadership role throughout the forecast horizon.
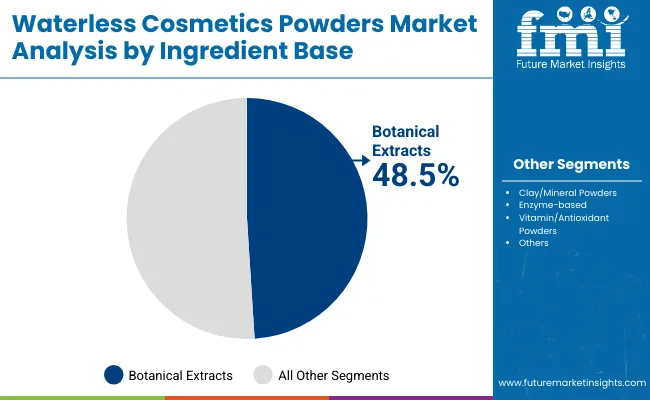
Insights into the Ingredient Base Segment with Others Dominating in Market Value

Waterless Cosmetics Powders Market By Ingredient Type

Segment Market Value Share, 2025
Botanical extracts 48.5%
Others 51.5%

The ingredient base segment in 2025 is expected to be led by others with 51.5% share. This near-equal distribution reflects growing consumer demand for both natural and advanced formulations. Botanical extracts are projected to resonate strongly with clean-label preferences, attracting consumers seeking safety and familiarity.

At the same time, advanced ingredients, including enzyme-based and antioxidant-rich powders, are forecasted to capture functional demand for visible skincare benefits. The balance of consumer interest highlights a dual growth trajectory: trust in botanicals alongside innovation in performance-driven ingredients. This equilibrium is expected to expand further as scientific validation of formulations strengthens brand credibility.
Insights into the Technology Segment with Focus on Laser Triangulation

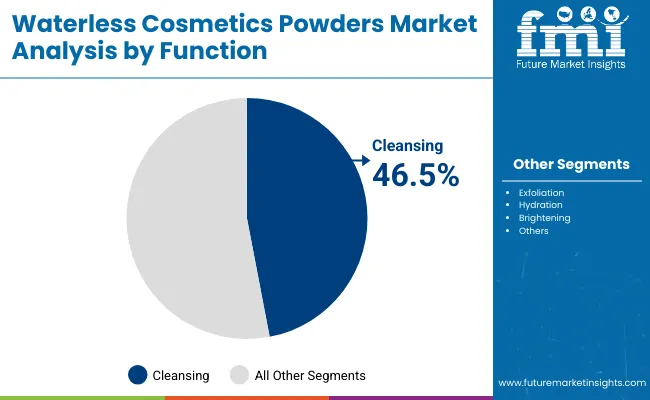
Waterless Cosmetics Powders Market Analysis By Function

Segment Market Value Share, 2025
Cleansing 46.5%
Others 53.5%

In 2025, the function segment will be led by cleansing powders contributing 46.5% This leadership by multifunctional formats is expected to be fueled by increasing consumer demand for hydration, brightening, and exfoliation solutions bundled into single products. Cleansing powders, while retaining strong adoption, are anticipated to serve as the foundational category for market entry.

Growth in the “others” category reflects shifting preferences among younger, time-conscious consumers who favor multifunctional, premium-positioned offerings. This trend is projected to be reinforced by continuous product launches and innovations that blur boundaries between skincare and cosmetics, ensuring multifunctional powders remain the fastest-expanding functional category over the coming decade.

What are the Drivers, Restraints, and Key Trends of the Waterless Cosmetics Powders Market?

The Waterless Cosmetics Powders Market is being shaped by advanced formulation science, shifting consumer awareness, and evolving retail ecosystems, even as challenges persist in scaling innovation and balancing sustainability with performance in highly competitive global beauty landscapes.

Innovation in Multifunctional Formulations

Market expansion is being enabled by a growing emphasis on multifunctional powders that merge skincare and cosmetic benefits. Instead of single-purpose cleansing or hydration formats, advanced powders are being engineered to deliver combined exfoliating, brightening, and moisturizing results. This multifunctionality is expected to appeal to time-conscious urban consumers while reducing product clutter and aligning with minimalist lifestyle trends.

Global beauty leaders are anticipated to invest heavily in R&D pipelines to validate efficacy and differentiate offerings. The long-term growth potential of this driver lies in how multifunctional innovations increase repeat purchase rates and open premium price tiers, ensuring that the waterless powders category evolves from niche adoption into mainstream consumption across key international markets.

Integration of Waterless Beauty in Sustainability Narratives

A critical trend is the embedding of waterless powders within broader sustainability narratives adopted by beauty companies. Unlike early positioning as novelty formats, powders are now being positioned as integral to corporate ESG commitments, particularly in reducing water usage and plastic packaging. Transparent communication of lifecycle benefits is expected to shape consumer trust and brand loyalty.

Strategic partnerships with ingredient suppliers and packaging innovators are anticipated to reinforce this trend, making waterless cosmetics a proof point of authentic sustainability. This integration is likely to redefine marketing frameworks, transforming powders into symbolic products that signal a brand’s environmental responsibility. By aligning innovation with measurable ecological outcomes, this trend is projected to reshape competitive advantage in the decade ahead.
Analysis of Waterless Cosmetics Powders Market By Key Countries

Waterless Cosmetics Powders Market Country Wise Analysis

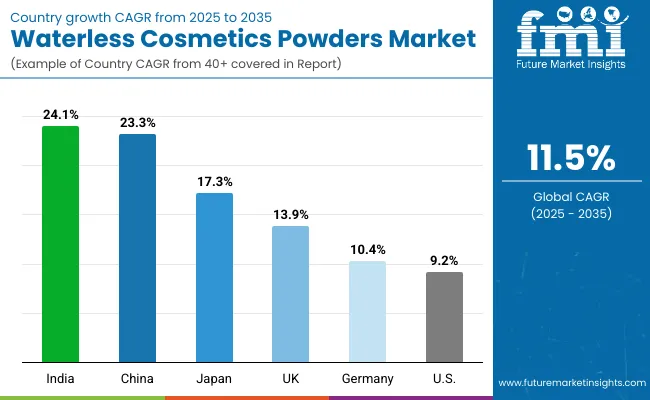
Country CAGR
China 23.3%
USA 9.2%
India 24.1%
UK 13.9%
Germany 10.4%
Japan 17.3%

The global Waterless Cosmetics Powders Market is forecasted to display significant country-level variations in growth momentum, shaped by demographic shifts, digital retail penetration, and evolving consumer awareness of sustainable beauty. Asia-Pacific is projected to remain the fastest-expanding region, anchored by India at 24.1% CAGR and China at 23.3% CAGR. Growth in these markets is expected to be supported by younger populations, rising disposable incomes, and aggressive digital-first adoption, making them hubs of innovation and scale.

Japan, with an estimated 17.3% CAGR, is anticipated to gain traction from a combination of high per-capita spending on beauty and strong demand for multifunctional, premium-positioned powders. In Europe, the UK and Germany are projected to expand at 13.9% and 10.4% CAGR respectively, driven by stringent sustainability expectations and strong retail integration. Both countries are likely to act as trendsetters for clean-label formulations and eco-packaging.

The USA, with a comparatively moderate 9.2% CAGR, is forecasted to exhibit steady adoption, reinforced by premium consumer segments and increasing acceptance of minimalist, waterless routines. While growth rates differ, all key markets are expected to be unified by consumer education, digital ecosystems, and brand innovation, ensuring long-term global expansion of waterless powders.
Sales Outlook for Waterless Cosmetics Powders in the United States

Usa Waterless Cosmetics Powders Market

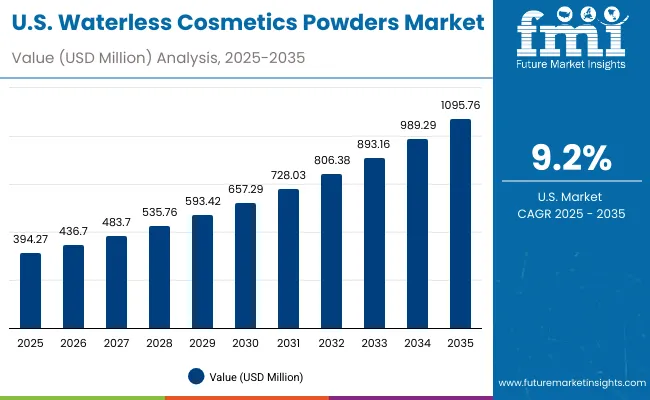
Year USA Waterless Cosmetics Powders Market (USD Million)
2025 394.27
2026 436.70
2027 483.70
2028 535.76
2029 593.42
2030 657.29
2031 728.03
2032 806.38
2033 893.16
2034 989.29
2035 1,095.76

The USA Waterless Cosmetics Powders Market is projected to grow at a CAGR of 9.2% during 2025 to 2035, supported by steady adoption of sustainable beauty formats and increasing integration of digital-first retail ecosystems. Market performance is expected to be guided by consumer awareness of clean-label solutions and the premiumization of multifunctional powders.

From 2025 to 2030, adoption is anticipated to expand gradually as niche innovators and premium brands strengthen consumer education and visibility. This phase will set the foundation for growth by positioning waterless powders as eco-conscious, performance-driven solutions. From 2030 to 2035, growth is forecasted to accelerate, driven by stronger product penetration across mainstream channels, multifunctional innovations, and endorsement by dermatology-focused brands. The role of e-commerce and direct-to-consumer strategies will remain central in shaping the sales outlook.

  • Multifunctional powders offering cleansing, hydration, and brightening benefits are expected to gain prominence across premium and mass segments.
  • Digital-first strategies, including e-commerce and influencer-led engagement, are projected to reinforce adoption among millennials and Gen Z consumers.
  • Dermatology-backed product launches and eco-conscious packaging formats are anticipated to strengthen brand credibility and long-term loyalty.

Growth and Expansion Outlook for Waterless Cosmetics Powders Market in the United Kingdom

The UK Waterless Cosmetics Powders Market is projected to grow at a CAGR of 13.9% during 2025 to 2035, supported by strong clean-label demand and regulatory emphasis on sustainability. Growth is expected to be shaped by consumer preference for eco-conscious formulations and premium-positioned multifunctional products.

Between 2025 and 2030, adoption is anticipated to accelerate through specialty retail and e-commerce platforms, particularly as brands highlight water conservation benefits and plastic-free packaging. The latter half of the decade is expected to record faster momentum as mainstream brands expand affordable offerings, creating wider consumer access. Functional powders that deliver brightening and hydration benefits are forecasted to capture urban consumer interest.

  • Clean-label positioning is expected to remain central to UK consumer adoption.
  • Premium multifunctional powders will gain traction in urban markets.
  • Regulatory frameworks on packaging sustainability will reinforce product acceptance.
  • E-commerce platforms are projected to dominate distribution channels.

Growth and Expansion Outlook for Waterless Cosmetics Powders Market in India

The India Waterless Cosmetics Powders Market is projected to expand at the fastest CAGR of 24.1% during 2025 to 2035, driven by younger demographics, rising disposable incomes, and rapid digital penetration. Market performance is expected to be shaped by affordable innovation and aspirational consumption.

From 2025 to 2030, growth is anticipated to be led by early adoption in metro cities, where digital-first brands will focus on clean-label education. The second half of the decade is forecasted to expand into tier-2 and tier-3 cities as affordability and awareness increase, strengthening mass-market penetration. Multifunctional powders offering cleansing and brightening benefits are expected to become popular in diverse consumer segments.

  • India is forecasted to be the fastest-growing market globally for waterless powders.
  • Digital-first adoption will define product awareness and engagement.
  • Urban-rural penetration is expected to drive scale beyond 2030.
  • Localized formulations are anticipated to attract culturally diverse consumers.

Sales Outlook for Waterless Cosmetics Powders in China

The China Waterless Cosmetics Powders Market is projected to grow at a CAGR of 23.3% during 2025 to 2035, reinforced by strong e-commerce ecosystems and rapid consumer adoption of sustainable beauty innovations. Growth is expected to be shaped by both premium and mass-market dynamics.

Between 2025 and 2030, urban consumers are anticipated to drive demand for multifunctional powders aligned with clean-label preferences. The second half of the forecast is projected to record accelerated growth as domestic brands expand into rural areas through social commerce and livestreaming platforms. The integration of traditional botanical extracts with advanced formulations is expected to strengthen consumer trust and drive market competitiveness.
  • E-commerce and social commerce are forecasted to dominate distribution channels.
  • Multifunctional innovations will shape premium and mass consumer appeal.
  • Domestic brands are anticipated to challenge global players through affordability.
  • Blended use of botanicals and advanced ingredients will reinforce market differentiation.

In-depth Analysis of Waterless Cosmetics Powders in Germany

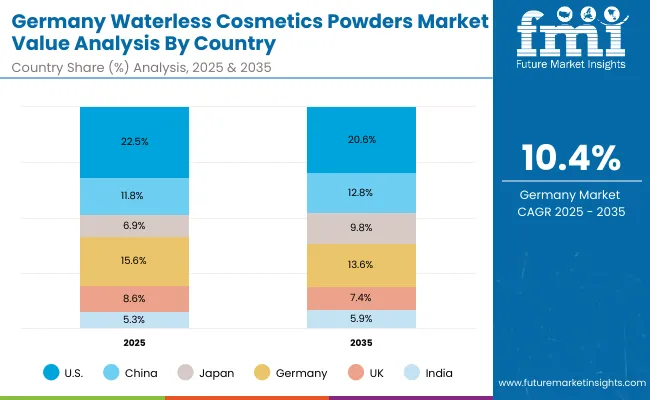
Germany Waterless Cosmetics Powders Market

Country 2025
USA 22.5%
China 11.8%
Japan 6.9%
Germany 15.6%
UK 8.6%
India 5.3%
Country 2035
USA 20.6%
China 12.8%
Japan 9.8%
Germany 13.6%
UK 7.4%
India 5.9%

The Germany Waterless Cosmetics Powders Market is projected to grow at a CAGR of 10.4% during 2025 to 2035, supported by strong sustainability awareness and regulatory frameworks. Market adoption is expected to be guided by consumer trust in certified, clean-label beauty products.

From 2025 to 2030, market momentum is anticipated to be moderate, reinforced by premium positioning and pharmacy-led adoption. In the second half of the decade, broader acceptance is forecasted through e-commerce platforms and increased investment by multinational brands. Innovation in multifunctional and dermatology-backed powders is expected to appeal strongly to German consumers who prioritize safety, transparency, and eco-consciousness.

  • Sustainability certification will remain a key purchase driver in Germany.
  • Pharmacy and specialty retail are forecasted to play strong roles in adoption.
  • Dermatology-backed formulations will reinforce consumer trust.
  • Growth acceleration after 2030 will be driven by broader e-commerce penetration.

Growth Outlook for Waterless Cosmetics Powders Market in Japan

Component Segment Market Value Share, 2025
Cleansing 49.10%
Others 50.90%

The Waterless Cosmetics Powders Market in Japan is projected at USD 120.9 million in 2025. Functional segmentation highlights a near balance, with cleansing contributing 49.1% while multifunctional formats under “others” command 50.9%, indicating a slight preference for versatile beauty routines. This marginal lead reflects the rising Japanese consumer inclination toward hybrid formats that deliver hydration, brightening, and exfoliation in one product, aligning with time-conscious lifestyles.

Cleansing powders are expected to remain highly relevant due to deep-rooted skincare traditions emphasizing purity and minimalism. However, multifunctional innovations are projected to accelerate growth as urban consumers increasingly prioritize convenience and premium positioning. Japanese brands are also expected to leverage botanicals fused with advanced formulations, strengthening consumer trust. As multifunctional adoption expands, this balance is forecasted to tilt further, positioning Japan as a premium-driven market where product innovation and tradition converge.

  • Market in Japan represents 6.9% of global share in 2025
  • “Others” lead slightly with 50.9% vs 49.1% for cleansing
  • Growth reinforced by multifunctional innovation in urban consumer bases
  • Tradition-driven demand for cleansing powders ensures long-term stability

Opportunity Analysis of South Korea Waterless Cosmetics Powders Market

Range Segment Market Value Share, 2025
Cleansing 48.00%
Others 52.00%

The Waterless Cosmetics Powders Market in South Korea is projected at USD 87.6 million in 2025. Functional segmentation shows a slight dominance of “others” at 52%, reflecting demand for multifunctional solutions that align with the country’s globally recognized K-beauty innovation ecosystem. Cleansing powders are forecasted to retain strong adoption, supported by cultural emphasis on skincare purity and layering routines.

Growth is expected to be accelerated by the export-driven influence of K-beauty trends, where powders are positioned as eco-friendly, travel-ready, and technologically advanced. E-commerce and cross-border online retail are anticipated to play a central role in extending reach to international consumers. Continuous innovation in multifunctional brightening and hydrating formats is projected to reinforce South Korea’s position as a global trendsetter in waterless beauty solutions.
  • Market in South Korea represents ~5% of global share in 2025
  • “Others” lead with 52% vs 48% for cleansing powders
  • K-beauty innovation and multifunctional positioning drive adoption
  • Export-driven online retail is expected to accelerate market penetration

Competitive Landscape of Waterless Cosmetics Powders Market

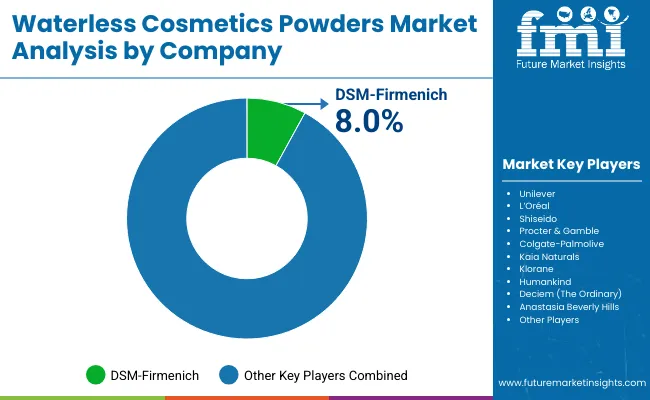
Waterless Cosmetics Powders Market By Company

Company Global Value Share 2025
DSM-Firmenich 8.0%
Others 92.0%

The Waterless Cosmetics Powders Market is moderately fragmented, with global leaders, mid-sized innovators, and niche-focused specialists shaping its competitive outlook. Global players such as Unilever, L’Oréal, Procter & Gamble, Shiseido, and Colgate-Palmolive are expected to dominate through scale, distribution strength, and continuous investment in R&D pipelines. These companies are anticipated to leverage their broad brand portfolios to position waterless powders as premium sustainable alternatives, aligning with consumer awareness of clean-label beauty.

Mid-sized innovators, including Deciem (The Ordinary), By Humankind, Kaia Naturals, and Klorane, are projected to play a key role by offering differentiated, eco-conscious solutions tailored to niche audiences. Their agility in product innovation and digital-first strategies is likely to resonate strongly with millennial and Gen Z consumers, strengthening their market relevance.

Specialist brands such as Anastasia Beverly Hills are anticipated to focus on targeted segments like luxury beauty, where powder-based innovations will support portfolio diversification. Competitive differentiation is forecasted to shift toward multifunctional performance, eco-friendly packaging, and omnichannel integration, with e-commerce becoming the dominant sales platform.

According to 2025 estimates, DSM-Firmenich holds an 8% global value share, while the remaining 92% is fragmented among beauty majors and emerging players. DSM-Firmenich is expected to have maintained a similar share in 2024, consolidating its position as the leading ingredient supplier for this market.

Key Developments in Waterless Cosmetics Powders Market

  • In July 2025, Procter & Gamble introduced Gemz, a water-activated, hexagonal dissolvable shampoo and conditioner format. Each unit was engineered to dissolve rapidly into a creamy formulation, delivering eight times more active ingredients compared to conventional liquids-marking a significant innovation in sustainable, travel-friendly beauty formats.
  • Throughout 2025, South Korean beauty brands continued to pioneer the development of waterless powdered cleansers, masks, and serums, reinforcing the country’s leadership in clean, compact, and high-performance beauty solutions designed for global sustainability and efficacy.

Scope of the Report

Item Value
Market Size 2025 USD 1,752.3 million
Market Size 2035 USD 5,210.3 million
Absolute Growth 2025 to 2035 USD 3,458.0 million
CAGR 2025 to 2035 11.5%
Leading Channel (2025) E-commerce 51.5% (USD 902.0 million); Others 48.5% (USD 849.60 million)
Ingredient Base Split (2025) Others 51.5% (USD 902.70 million); Botanical extracts 48.5% (USD 848.5 million)
Functional Split (2025) Others 53.5% (USD 938.10 million); Cleansing 46.5% (USD 813.1 million)
USA Market (2025 → 2035) USD 394.27 million → USD 1,095.76 million
High-Growth Countries (CAGR 2025 to 2035) India 24.1%; China 23.3%; Japan 17.3%; UK 13.9%; Germany 10.4%; USA 9.2%
Packaging Types Considered Sachets, Sticks, Refillable jars, Capsules
Regions Covered North America, Europe, East Asia, South Asia, Latin America, Middle East & Africa
Countries Covered United States, Canada, Germany, France, United Kingdom, China, Japan, India, Brazil, South Africa
Key Companies Profiled Unilever; L’Oréal; Shiseido; Procter & Gamble; Colgate-Palmolive; Kaia Naturals; Klorane; By Humankind; Deciem (The Ordinary); Anastasia Beverly Hills; DSM-Firmenich (ingredients)
Additional Attributes Sustainability and water-saving positioning; e-commerce leadership; multifunctional powder innovation (brightening/hydration/exfoliation); clean-label and botanical claims; refillable/low-plastic packaging; premiumization; country-specific CAGRs; 2025 segment shares for channel, ingredient base, and function included above.

Key Segments

By Product Type:

  • Cleansing powders
  • Shampoo powders
  • Powdered masks
  • Powder-to-cream moisturizers

By Ingredient Base:

  • Botanical extracts
  • Clay/mineral powders
  • Enzyme-based
  • Vitamin/antioxidant powders

By Function:

  • Cleansing
  • Exfoliation
  • Hydration
  • Brightening

By Channel:

  • E-commerce
  • Specialty retail
  • Pharmacies
  • D2C

By Packaging:

  • Sachets
  • Sticks
  • Refillable jars
  • Capsules

By Region:

  • North America
  • Latin America
  • Europe
  • East Asia
  • South Asia & Pacific
  • Middle East and Africa

Table of Content

  1. Executive Summary
    • Global Market Outlook
    • Demand-side Trends
    • Supply-side Trends
    • Technology Roadmap Analysis
    • Analysis and Recommendations
  2. Market Overview
    • Market Coverage / Taxonomy
    • Market Definition / Scope / Limitations
  3. Market Background
    • Market Dynamics
      • Drivers
      • Restraints
      • Opportunity
      • Trends
    • Scenario Forecast
      • Demand in Optimistic Scenario
      • Demand in Likely Scenario
      • Demand in Conservative Scenario
    • Opportunity Map Analysis
    • Product Life Cycle Analysis
    • Supply Chain Analysis
      • Supply Side Participants and their Roles
        • Producers
        • Mid-Level Participants (Traders/ Agents/ Brokers)
        • Wholesalers and Distributors
      • Value Added and Value Created at Node in the Supply Chain
      • List of Raw Material Suppliers
      • List of Existing and Potential Buyer’s
    • Investment Feasibility Matrix
    • Value Chain Analysis
      • Profit Margin Analysis
      • Wholesalers and Distributors
      • Retailers
    • PESTLE and Porter’s Analysis
    • Regulatory Landscape
      • By Key Regions
      • By Key Countries
    • Regional Parent Market Outlook
    • Production and Consumption Statistics
    • Import and Export Statistics
  4. Global Market Analysis 2020 to 2024 and Forecast, 2025 to 2035
    • Historical Market Size Value (USD Million) & Volume (Units) Analysis, 2020 to 2024
    • Current and Future Market Size Value (USD Million) & Volume (Units) Projections, 2025 to 2035
      • Y-o-Y Growth Trend Analysis
      • Absolute $ Opportunity Analysis
  5. Global Market Analysis 2020 to 2024 and Forecast 2025 to 2035, By Product Type
    • Introduction / Key Findings
    • Historical Market Size Value (USD Million) & Volume (Units) Analysis By Product Type, 2020 to 2024
    • Current and Future Market Size Value (USD Million) & Volume (Units) Analysis and Forecast By Product Type, 2025 to 2035
      • Cleansing powders
      • Shampoo powders
      • Powdered masks
      • Powder-to-cream moisturizers
    • Y-o-Y Growth Trend Analysis By Product Type, 2020 to 2024
    • Absolute $ Opportunity Analysis By Product Type, 2025 to 2035
  6. Global Market Analysis 2020 to 2024 and Forecast 2025 to 2035, By Ingredient Base
    • Introduction / Key Findings
    • Historical Market Size Value (USD Million) & Volume (Units) Analysis By Ingredient Base, 2020 to 2024
    • Current and Future Market Size Value (USD Million) & Volume (Units) Analysis and Forecast By Ingredient Base, 2025 to 2035
      • Botanical extracts
      • Clay/mineral powders
      • Enzyme-based
      • Vitamin/antioxidant powders
    • Y-o-Y Growth Trend Analysis By Ingredient Base, 2020 to 2024
    • Absolute $ Opportunity Analysis By Ingredient Base, 2025 to 2035
  7. Global Market Analysis 2020 to 2024 and Forecast 2025 to 2035, By Function
    • Introduction / Key Findings
    • Historical Market Size Value (USD Million) & Volume (Units) Analysis By Function, 2020 to 2024
    • Current and Future Market Size Value (USD Million) & Volume (Units) Analysis and Forecast By Function, 2025 to 2035
      • Cleansing
      • Exfoliation
      • Hydration
      • Brightening
    • Y-o-Y Growth Trend Analysis By Function, 2020 to 2024
    • Absolute $ Opportunity Analysis By Function, 2025 to 2035
  8. Global Market Analysis 2020 to 2024 and Forecast 2025 to 2035, By Channel
    • Introduction / Key Findings
    • Historical Market Size Value (USD Million) & Volume (Units) Analysis By Channel, 2020 to 2024
    • Current and Future Market Size Value (USD Million) & Volume (Units) Analysis and Forecast By Channel, 2025 to 2035
      • E-commerce
      • Specialty retail
      • Pharmacies
      • D2C
    • Y-o-Y Growth Trend Analysis By Channel, 2020 to 2024
    • Absolute $ Opportunity Analysis By Channel, 2025 to 2035
  9. Global Market Analysis 2020 to 2024 and Forecast 2025 to 2035, By Packaging
    • Introduction / Key Findings
    • Historical Market Size Value (USD Million) & Volume (Units) Analysis By Packaging, 2020 to 2024
    • Current and Future Market Size Value (USD Million) & Volume (Units) Analysis and Forecast By Packaging, 2025 to 2035
      • Sachets
      • Sticks
      • Refillable jars
      • Capsules
    • Y-o-Y Growth Trend Analysis By Packaging, 2020 to 2024
    • Absolute $ Opportunity Analysis By Packaging, 2025 to 2035
  10. Global Market Analysis 2020 to 2024 and Forecast 2025 to 2035, By Region
    • Introduction
    • Historical Market Size Value (USD Million) & Volume (Units) Analysis By Region, 2020 to 2024
    • Current Market Size Value (USD Million) & Volume (Units) Analysis and Forecast By Region, 2025 to 2035
      • North America
      • Latin America
      • Europe
      • East Asia
      • South Asia & Pacific
      • Middle East and Africa
    • Market Attractiveness Analysis By Region
  11. North America Market Analysis 2020 to 2024 and Forecast 2025 to 2035, By Country
    • Historical Market Size Value (USD Million) & Volume (Units) Trend Analysis By Market Taxonomy, 2020 to 2024
    • Market Size Value (USD Million) & Volume (Units) Forecast By Market Taxonomy, 2025 to 2035
      • By Country
        • USA
        • Canada
      • By Product Type
      • By Ingredient Base
      • By Function
      • By Channel
      • By Packaging
    • Market Attractiveness Analysis
      • By Country
      • By Product Type
      • By Ingredient Base
      • By Function
      • By Channel
      • By Packaging
    • Key Takeaways
  12. Latin America Market Analysis 2020 to 2024 and Forecast 2025 to 2035, By Country
    • Historical Market Size Value (USD Million) & Volume (Units) Trend Analysis By Market Taxonomy, 2020 to 2024
    • Market Size Value (USD Million) & Volume (Units) Forecast By Market Taxonomy, 2025 to 2035
      • By Country
        • Brazil
        • Mexico
        • Colombia
        • Rest of Latin America
      • By Product Type
      • By Ingredient Base
      • By Function
      • By Channel
      • By Packaging
    • Market Attractiveness Analysis
      • By Country
      • By Product Type
      • By Ingredient Base
      • By Function
      • By Channel
      • By Packaging
    • Key Takeaways
  13. Europe Market Analysis 2020 to 2024 and Forecast 2025 to 2035, By Country
    • Historical Market Size Value (USD Million) & Volume (Units) Trend Analysis By Market Taxonomy, 2020 to 2024
    • Market Size Value (USD Million) & Volume (Units) Forecast By Market Taxonomy, 2025 to 2035
      • By Country
        • Germany
        • UK
        • France
        • Italy
        • Spain
        • Belgium
        • Netherlands
        • Nordic
        • Switzerland
        • Russia
        • Poland
        • Rest of Europe
      • By Product Type
      • By Ingredient Base
      • By Function
      • By Channel
      • By Packaging
    • Market Attractiveness Analysis
      • By Country
      • By Product Type
      • By Ingredient Base
      • By Function
      • By Channel
      • By Packaging
    • Key Takeaways
  14. East Asia Market Analysis 2020 to 2024 and Forecast 2025 to 2035, By Country
    • Historical Market Size Value (USD Million) & Volume (Units) Trend Analysis By Market Taxonomy, 2020 to 2024
    • Market Size Value (USD Million) & Volume (Units) Forecast By Market Taxonomy, 2025 to 2035
      • By Country
        • China
        • Japan
        • South Korea
      • By Product Type
      • By Ingredient Base
      • By Function
      • By Channel
      • By Packaging
    • Market Attractiveness Analysis
      • By Country
      • By Product Type
      • By Ingredient Base
      • By Function
      • By Channel
      • By Packaging
    • Key Takeaways
  15. South Asia & Pacific Market Analysis 2020 to 2024 and Forecast 2025 to 2035, By Country
    • Historical Market Size Value (USD Million) & Volume (Units) Trend Analysis By Market Taxonomy, 2020 to 2024
    • Market Size Value (USD Million) & Volume (Units) Forecast By Market Taxonomy, 2025 to 2035
      • By Country
        • India
        • Thailand
        • Malaysia
        • Indonesia
        • Singapore
        • Vietnam
        • Australia
        • New Zealand
        • Rest of South Asia
      • By Product Type
      • By Ingredient Base
      • By Function
      • By Channel
      • By Packaging
    • Market Attractiveness Analysis
      • By Country
      • By Product Type
      • By Ingredient Base
      • By Function
      • By Channel
      • By Packaging
    • Key Takeaways
  16. Middle East and Africa Market Analysis 2020 to 2024 and Forecast 2025 to 2035, By Country
    • Historical Market Size Value (USD Million) & Volume (Units) Trend Analysis By Market Taxonomy, 2020 to 2024
    • Market Size Value (USD Million) & Volume (Units) Forecast By Market Taxonomy, 2025 to 2035
      • By Country
        • Turkey
        • UAE
        • Saudi Arabia
        • Israel
        • Other GCC Countries
        • North Africa
        • South Africa
      • By Product Type
      • By Ingredient Base
      • By Function
      • By Channel
      • By Packaging
    • Market Attractiveness Analysis
      • By Country
      • By Product Type
      • By Ingredient Base
      • By Function
      • By Channel
      • By Packaging
    • Key Takeaways
  17. Key Countries Market Analysis
    • USA
      • Pricing Analysis
      • Market Share Analysis, 2024
        • By Product Type
        • By Ingredient Base
        • By Function
        • By Channel
        • By Packaging
    • Canada
      • Pricing Analysis
      • Market Share Analysis, 2024
        • By Product Type
        • By Ingredient Base
        • By Function
        • By Channel
        • By Packaging
    • Brazil
      • Pricing Analysis
      • Market Share Analysis, 2024
        • By Product Type
        • By Ingredient Base
        • By Function
        • By Channel
        • By Packaging
    • Mexico
      • Pricing Analysis
      • Market Share Analysis, 2024
        • By Product Type
        • By Ingredient Base
        • By Function
        • By Channel
        • By Packaging
    • Colombia
      • Pricing Analysis
      • Market Share Analysis, 2024
        • By Product Type
        • By Ingredient Base
        • By Function
        • By Channel
        • By Packaging
    • Germany
      • Pricing Analysis
      • Market Share Analysis, 2024
        • By Product Type
        • By Ingredient Base
        • By Function
        • By Channel
        • By Packaging
    • UK
      • Pricing Analysis
      • Market Share Analysis, 2024
        • By Product Type
        • By Ingredient Base
        • By Function
        • By Channel
        • By Packaging
    • France
      • Pricing Analysis
      • Market Share Analysis, 2024
        • By Product Type
        • By Ingredient Base
        • By Function
        • By Channel
        • By Packaging
    • Italy
      • Pricing Analysis
      • Market Share Analysis, 2024
        • By Product Type
        • By Ingredient Base
        • By Function
        • By Channel
        • By Packaging
    • Spain
      • Pricing Analysis
      • Market Share Analysis, 2024
        • By Product Type
        • By Ingredient Base
        • By Function
        • By Channel
        • By Packaging
    • Belgium
      • Pricing Analysis
      • Market Share Analysis, 2024
        • By Product Type
        • By Ingredient Base
        • By Function
        • By Channel
        • By Packaging
    • Netherlands
      • Pricing Analysis
      • Market Share Analysis, 2024
        • By Product Type
        • By Ingredient Base
        • By Function
        • By Channel
        • By Packaging
    • Nordic
      • Pricing Analysis
      • Market Share Analysis, 2024
        • By Product Type
        • By Ingredient Base
        • By Function
        • By Channel
        • By Packaging
    • Switzerland
      • Pricing Analysis
      • Market Share Analysis, 2024
        • By Product Type
        • By Ingredient Base
        • By Function
        • By Channel
        • By Packaging
    • Russia
      • Pricing Analysis
      • Market Share Analysis, 2024
        • By Product Type
        • By Ingredient Base
        • By Function
        • By Channel
        • By Packaging
    • Poland
      • Pricing Analysis
      • Market Share Analysis, 2024
        • By Product Type
        • By Ingredient Base
        • By Function
        • By Channel
        • By Packaging
    • China
      • Pricing Analysis
      • Market Share Analysis, 2024
        • By Product Type
        • By Ingredient Base
        • By Function
        • By Channel
        • By Packaging
    • Japan
      • Pricing Analysis
      • Market Share Analysis, 2024
        • By Product Type
        • By Ingredient Base
        • By Function
        • By Channel
        • By Packaging
    • South Korea
      • Pricing Analysis
      • Market Share Analysis, 2024
        • By Product Type
        • By Ingredient Base
        • By Function
        • By Channel
        • By Packaging
    • India
      • Pricing Analysis
      • Market Share Analysis, 2024
        • By Product Type
        • By Ingredient Base
        • By Function
        • By Channel
        • By Packaging
    • Thailand
      • Pricing Analysis
      • Market Share Analysis, 2024
        • By Product Type
        • By Ingredient Base
        • By Function
        • By Channel
        • By Packaging
    • Indonesia
      • Pricing Analysis
      • Market Share Analysis, 2024
        • By Product Type
        • By Ingredient Base
        • By Function
        • By Channel
        • By Packaging
    • Australia
      • Pricing Analysis
      • Market Share Analysis, 2024
        • By Product Type
        • By Ingredient Base
        • By Function
        • By Channel
        • By Packaging
    • New Zealand
      • Pricing Analysis
      • Market Share Analysis, 2024
        • By Product Type
        • By Ingredient Base
        • By Function
        • By Channel
        • By Packaging
    • Turkey
      • Pricing Analysis
      • Market Share Analysis, 2024
        • By Product Type
        • By Ingredient Base
        • By Function
        • By Channel
        • By Packaging
    • UAE
      • Pricing Analysis
      • Market Share Analysis, 2024
        • By Product Type
        • By Ingredient Base
        • By Function
        • By Channel
        • By Packaging
    • Saudi Arabia
      • Pricing Analysis
      • Market Share Analysis, 2024
        • By Product Type
        • By Ingredient Base
        • By Function
        • By Channel
        • By Packaging
    • Israel
      • Pricing Analysis
      • Market Share Analysis, 2024
        • By Product Type
        • By Ingredient Base
        • By Function
        • By Channel
        • By Packaging
    • North Africa
      • Pricing Analysis
      • Market Share Analysis, 2024
        • By Product Type
        • By Ingredient Base
        • By Function
        • By Channel
        • By Packaging
    • South Africa
      • Pricing Analysis
      • Market Share Analysis, 2024
        • By Product Type
        • By Ingredient Base
        • By Function
        • By Channel
        • By Packaging
  18. Market Structure Analysis
    • Competition Dashboard
    • Competition Benchmarking
    • Market Share Analysis of Top Players
      • By Regional
      • By Product Type
      • By Ingredient Base
      • By Function
      • By Channel
      • By Packaging
  19. Competition Analysis
    • Competition Deep Dive
      • Unilever
        • Overview
        • Product Portfolio
        • Profitability by Market Segments (Product/Age /Sales Channel/Region)
        • Sales Footprint
        • Strategy Overview
          • Marketing Strategy
          • Product Strategy
          • Channel Strategy
      • L’Oréal
        • Overview
        • Product Portfolio
        • Profitability by Market Segments (Product/Age /Sales Channel/Region)
        • Sales Footprint
        • Strategy Overview
          • Marketing Strategy
          • Product Strategy
          • Channel Strategy
      • Shiseido
        • Overview
        • Product Portfolio
        • Profitability by Market Segments (Product/Age /Sales Channel/Region)
        • Sales Footprint
        • Strategy Overview
          • Marketing Strategy
          • Product Strategy
          • Channel Strategy
      • Procter & Gamble
        • Overview
        • Product Portfolio
        • Profitability by Market Segments (Product/Age /Sales Channel/Region)
        • Sales Footprint
        • Strategy Overview
          • Marketing Strategy
          • Product Strategy
          • Channel Strategy
      • Colgate-Palmolive
        • Overview
        • Product Portfolio
        • Profitability by Market Segments (Product/Age /Sales Channel/Region)
        • Sales Footprint
        • Strategy Overview
          • Marketing Strategy
          • Product Strategy
          • Channel Strategy
      • Kaia Naturals
        • Overview
        • Product Portfolio
        • Profitability by Market Segments (Product/Age /Sales Channel/Region)
        • Sales Footprint
        • Strategy Overview
          • Marketing Strategy
          • Product Strategy
          • Channel Strategy
      • Klorane
        • Overview
        • Product Portfolio
        • Profitability by Market Segments (Product/Age /Sales Channel/Region)
        • Sales Footprint
        • Strategy Overview
          • Marketing Strategy
          • Product Strategy
          • Channel Strategy
      • Humankind
        • Overview
        • Product Portfolio
        • Profitability by Market Segments (Product/Age /Sales Channel/Region)
        • Sales Footprint
        • Strategy Overview
          • Marketing Strategy
          • Product Strategy
          • Channel Strategy
      • Deciem (The Ordinary)
        • Overview
        • Product Portfolio
        • Profitability by Market Segments (Product/Age /Sales Channel/Region)
        • Sales Footprint
        • Strategy Overview
          • Marketing Strategy
          • Product Strategy
          • Channel Strategy
      • Anastasia Beverly Hills
        • Overview
        • Product Portfolio
        • Profitability by Market Segments (Product/Age /Sales Channel/Region)
        • Sales Footprint
        • Strategy Overview
          • Marketing Strategy
          • Product Strategy
          • Channel Strategy
      • Others
        • Overview
        • Product Portfolio
        • Profitability by Market Segments (Product/Age /Sales Channel/Region)
        • Sales Footprint
        • Strategy Overview
          • Marketing Strategy
          • Product Strategy
          • Channel Strategy
  20. Assumptions & Acronyms Used
  21. Research Methodology

List of Tables

  • Table 1: Global Market Value (USD Million) Forecast by Region, 2020-2035
  • Table 2: Global Market Volume (Units) Forecast by Region, 2020-2035
  • Table 3: Global Market Value (USD Million) Forecast by Product Type, 2020-2035
  • Table 4: Global Market Volume (Units) Forecast by Product Type, 2020-2035
  • Table 5: Global Market Value (USD Million) Forecast by Ingredient Base, 2020-2035
  • Table 6: Global Market Volume (Units) Forecast by Ingredient Base, 2020-2035
  • Table 7: Global Market Value (USD Million) Forecast by Function, 2020-2035
  • Table 8: Global Market Volume (Units) Forecast by Function, 2020-2035
  • Table 9: Global Market Value (USD Million) Forecast by Channel, 2020-2035
  • Table 10: Global Market Volume (Units) Forecast by Channel, 2020-2035
  • Table 11: Global Market Value (USD Million) Forecast by Packaging, 2020-2035
  • Table 12: Global Market Volume (Units) Forecast by Packaging, 2020-2035
  • Table 13: North America Market Value (USD Million) Forecast by Country, 2020-2035
  • Table 14: North America Market Volume (Units) Forecast by Country, 2020-2035
  • Table 15: North America Market Value (USD Million) Forecast by Product Type, 2020-2035
  • Table 16: North America Market Volume (Units) Forecast by Product Type, 2020-2035
  • Table 17: North America Market Value (USD Million) Forecast by Ingredient Base, 2020-2035
  • Table 18: North America Market Volume (Units) Forecast by Ingredient Base, 2020-2035
  • Table 19: North America Market Value (USD Million) Forecast by Function, 2020-2035
  • Table 20: North America Market Volume (Units) Forecast by Function, 2020-2035
  • Table 21: North America Market Value (USD Million) Forecast by Channel, 2020-2035
  • Table 22: North America Market Volume (Units) Forecast by Channel, 2020-2035
  • Table 23: North America Market Value (USD Million) Forecast by Packaging, 2020-2035
  • Table 24: North America Market Volume (Units) Forecast by Packaging, 2020-2035
  • Table 25: Latin America Market Value (USD Million) Forecast by Country, 2020-2035
  • Table 26: Latin America Market Volume (Units) Forecast by Country, 2020-2035
  • Table 27: Latin America Market Value (USD Million) Forecast by Product Type, 2020-2035
  • Table 28: Latin America Market Volume (Units) Forecast by Product Type, 2020-2035
  • Table 29: Latin America Market Value (USD Million) Forecast by Ingredient Base, 2020-2035
  • Table 30: Latin America Market Volume (Units) Forecast by Ingredient Base, 2020-2035
  • Table 31: Latin America Market Value (USD Million) Forecast by Function, 2020-2035
  • Table 32: Latin America Market Volume (Units) Forecast by Function, 2020-2035
  • Table 33: Latin America Market Value (USD Million) Forecast by Channel, 2020-2035
  • Table 34: Latin America Market Volume (Units) Forecast by Channel, 2020-2035
  • Table 35: Latin America Market Value (USD Million) Forecast by Packaging, 2020-2035
  • Table 36: Latin America Market Volume (Units) Forecast by Packaging, 2020-2035
  • Table 37: Europe Market Value (USD Million) Forecast by Country, 2020-2035
  • Table 38: Europe Market Volume (Units) Forecast by Country, 2020-2035
  • Table 39: Europe Market Value (USD Million) Forecast by Product Type, 2020-2035
  • Table 40: Europe Market Volume (Units) Forecast by Product Type, 2020-2035
  • Table 41: Europe Market Value (USD Million) Forecast by Ingredient Base, 2020-2035
  • Table 42: Europe Market Volume (Units) Forecast by Ingredient Base, 2020-2035
  • Table 43: Europe Market Value (USD Million) Forecast by Function, 2020-2035
  • Table 44: Europe Market Volume (Units) Forecast by Function, 2020-2035
  • Table 45: Europe Market Value (USD Million) Forecast by Channel, 2020-2035
  • Table 46: Europe Market Volume (Units) Forecast by Channel, 2020-2035
  • Table 47: Europe Market Value (USD Million) Forecast by Packaging, 2020-2035
  • Table 48: Europe Market Volume (Units) Forecast by Packaging, 2020-2035
  • Table 49: East Asia Market Value (USD Million) Forecast by Country, 2020-2035
  • Table 50: East Asia Market Volume (Units) Forecast by Country, 2020-2035
  • Table 51: East Asia Market Value (USD Million) Forecast by Product Type, 2020-2035
  • Table 52: East Asia Market Volume (Units) Forecast by Product Type, 2020-2035
  • Table 53: East Asia Market Value (USD Million) Forecast by Ingredient Base, 2020-2035
  • Table 54: East Asia Market Volume (Units) Forecast by Ingredient Base, 2020-2035
  • Table 55: East Asia Market Value (USD Million) Forecast by Function, 2020-2035
  • Table 56: East Asia Market Volume (Units) Forecast by Function, 2020-2035
  • Table 57: East Asia Market Value (USD Million) Forecast by Channel, 2020-2035
  • Table 58: East Asia Market Volume (Units) Forecast by Channel, 2020-2035
  • Table 59: East Asia Market Value (USD Million) Forecast by Packaging, 2020-2035
  • Table 60: East Asia Market Volume (Units) Forecast by Packaging, 2020-2035
  • Table 61: South Asia & Pacific Market Value (USD Million) Forecast by Country, 2020-2035
  • Table 62: South Asia & Pacific Market Volume (Units) Forecast by Country, 2020-2035
  • Table 63: South Asia & Pacific Market Value (USD Million) Forecast by Product Type, 2020-2035
  • Table 64: South Asia & Pacific Market Volume (Units) Forecast by Product Type, 2020-2035
  • Table 65: South Asia & Pacific Market Value (USD Million) Forecast by Ingredient Base, 2020-2035
  • Table 66: South Asia & Pacific Market Volume (Units) Forecast by Ingredient Base, 2020-2035
  • Table 67: South Asia & Pacific Market Value (USD Million) Forecast by Function, 2020-2035
  • Table 68: South Asia & Pacific Market Volume (Units) Forecast by Function, 2020-2035
  • Table 69: South Asia & Pacific Market Value (USD Million) Forecast by Channel, 2020-2035
  • Table 70: South Asia & Pacific Market Volume (Units) Forecast by Channel, 2020-2035
  • Table 71: South Asia & Pacific Market Value (USD Million) Forecast by Packaging, 2020-2035
  • Table 72: South Asia & Pacific Market Volume (Units) Forecast by Packaging, 2020-2035
  • Table 73: Middle East and Africa Market Value (USD Million) Forecast by Country, 2020-2035
  • Table 74: Middle East and Africa Market Volume (Units) Forecast by Country, 2020-2035
  • Table 75: Middle East and Africa Market Value (USD Million) Forecast by Product Type, 2020-2035
  • Table 76: Middle East and Africa Market Volume (Units) Forecast by Product Type, 2020-2035
  • Table 77: Middle East and Africa Market Value (USD Million) Forecast by Ingredient Base, 2020-2035
  • Table 78: Middle East and Africa Market Volume (Units) Forecast by Ingredient Base, 2020-2035
  • Table 79: Middle East and Africa Market Value (USD Million) Forecast by Function, 2020-2035
  • Table 80: Middle East and Africa Market Volume (Units) Forecast by Function, 2020-2035
  • Table 81: Middle East and Africa Market Value (USD Million) Forecast by Channel, 2020-2035
  • Table 82: Middle East and Africa Market Volume (Units) Forecast by Channel, 2020-2035
  • Table 83: Middle East and Africa Market Value (USD Million) Forecast by Packaging, 2020-2035
  • Table 84: Middle East and Africa Market Volume (Units) Forecast by Packaging, 2020-2035

List of Figures

  • Figure 1: Global Market Value (USD Million) by Product Type, 2025-2035
  • Figure 2: Global Market Value (USD Million) by Ingredient Base, 2025-2035
  • Figure 3: Global Market Value (USD Million) by Function, 2025-2035
  • Figure 4: Global Market Value (USD Million) by Channel, 2025-2035
  • Figure 5: Global Market Value (USD Million) by Packaging, 2025-2035
  • Figure 6: Global Market Value (USD Million) by Region, 2025-2035
  • Figure 7: Global Market Value (USD Million) Analysis by Region, 2020-2035
  • Figure 8: Global Market Volume (Units) Analysis by Region, 2020-2035
  • Figure 9: Global Market Value Share (%) and BPS Analysis by Region, 2025-2035
  • Figure 10: Global Market Y-o-Y Growth (%) Projections by Region, 2025-2035
  • Figure 11: Global Market Value (USD Million) Analysis by Product Type, 2020-2035
  • Figure 12: Global Market Volume (Units) Analysis by Product Type, 2020-2035
  • Figure 13: Global Market Value Share (%) and BPS Analysis by Product Type, 2025-2035
  • Figure 14: Global Market Y-o-Y Growth (%) Projections by Product Type, 2025-2035
  • Figure 15: Global Market Value (USD Million) Analysis by Ingredient Base, 2020-2035
  • Figure 16: Global Market Volume (Units) Analysis by Ingredient Base, 2020-2035
  • Figure 17: Global Market Value Share (%) and BPS Analysis by Ingredient Base, 2025-2035
  • Figure 18: Global Market Y-o-Y Growth (%) Projections by Ingredient Base, 2025-2035
  • Figure 19: Global Market Value (USD Million) Analysis by Function, 2020-2035
  • Figure 20: Global Market Volume (Units) Analysis by Function, 2020-2035
  • Figure 21: Global Market Value Share (%) and BPS Analysis by Function, 2025-2035
  • Figure 22: Global Market Y-o-Y Growth (%) Projections by Function, 2025-2035
  • Figure 23: Global Market Value (USD Million) Analysis by Channel, 2020-2035
  • Figure 24: Global Market Volume (Units) Analysis by Channel, 2020-2035
  • Figure 25: Global Market Value Share (%) and BPS Analysis by Channel, 2025-2035
  • Figure 26: Global Market Y-o-Y Growth (%) Projections by Channel, 2025-2035
  • Figure 27: Global Market Value (USD Million) Analysis by Packaging, 2020-2035
  • Figure 28: Global Market Volume (Units) Analysis by Packaging, 2020-2035
  • Figure 29: Global Market Value Share (%) and BPS Analysis by Packaging, 2025-2035
  • Figure 30: Global Market Y-o-Y Growth (%) Projections by Packaging, 2025-2035
  • Figure 31: Global Market Attractiveness by Product Type, 2025-2035
  • Figure 32: Global Market Attractiveness by Ingredient Base, 2025-2035
  • Figure 33: Global Market Attractiveness by Function, 2025-2035
  • Figure 34: Global Market Attractiveness by Channel, 2025-2035
  • Figure 35: Global Market Attractiveness by Packaging, 2025-2035
  • Figure 36: Global Market Attractiveness by Region, 2025-2035
  • Figure 37: North America Market Value (USD Million) by Product Type, 2025-2035
  • Figure 38: North America Market Value (USD Million) by Ingredient Base, 2025-2035
  • Figure 39: North America Market Value (USD Million) by Function, 2025-2035
  • Figure 40: North America Market Value (USD Million) by Channel, 2025-2035
  • Figure 41: North America Market Value (USD Million) by Packaging, 2025-2035
  • Figure 42: North America Market Value (USD Million) by Country, 2025-2035
  • Figure 43: North America Market Value (USD Million) Analysis by Country, 2020-2035
  • Figure 44: North America Market Volume (Units) Analysis by Country, 2020-2035
  • Figure 45: North America Market Value Share (%) and BPS Analysis by Country, 2025-2035
  • Figure 46: North America Market Y-o-Y Growth (%) Projections by Country, 2025-2035
  • Figure 47: North America Market Value (USD Million) Analysis by Product Type, 2020-2035
  • Figure 48: North America Market Volume (Units) Analysis by Product Type, 2020-2035
  • Figure 49: North America Market Value Share (%) and BPS Analysis by Product Type, 2025-2035
  • Figure 50: North America Market Y-o-Y Growth (%) Projections by Product Type, 2025-2035
  • Figure 51: North America Market Value (USD Million) Analysis by Ingredient Base, 2020-2035
  • Figure 52: North America Market Volume (Units) Analysis by Ingredient Base, 2020-2035
  • Figure 53: North America Market Value Share (%) and BPS Analysis by Ingredient Base, 2025-2035
  • Figure 54: North America Market Y-o-Y Growth (%) Projections by Ingredient Base, 2025-2035
  • Figure 55: North America Market Value (USD Million) Analysis by Function, 2020-2035
  • Figure 56: North America Market Volume (Units) Analysis by Function, 2020-2035
  • Figure 57: North America Market Value Share (%) and BPS Analysis by Function, 2025-2035
  • Figure 58: North America Market Y-o-Y Growth (%) Projections by Function, 2025-2035
  • Figure 59: North America Market Value (USD Million) Analysis by Channel, 2020-2035
  • Figure 60: North America Market Volume (Units) Analysis by Channel, 2020-2035
  • Figure 61: North America Market Value Share (%) and BPS Analysis by Channel, 2025-2035
  • Figure 62: North America Market Y-o-Y Growth (%) Projections by Channel, 2025-2035
  • Figure 63: North America Market Value (USD Million) Analysis by Packaging, 2020-2035
  • Figure 64: North America Market Volume (Units) Analysis by Packaging, 2020-2035
  • Figure 65: North America Market Value Share (%) and BPS Analysis by Packaging, 2025-2035
  • Figure 66: North America Market Y-o-Y Growth (%) Projections by Packaging, 2025-2035
  • Figure 67: North America Market Attractiveness by Product Type, 2025-2035
  • Figure 68: North America Market Attractiveness by Ingredient Base, 2025-2035
  • Figure 69: North America Market Attractiveness by Function, 2025-2035
  • Figure 70: North America Market Attractiveness by Channel, 2025-2035
  • Figure 71: North America Market Attractiveness by Packaging, 2025-2035
  • Figure 72: North America Market Attractiveness by Country, 2025-2035
  • Figure 73: Latin America Market Value (USD Million) by Product Type, 2025-2035
  • Figure 74: Latin America Market Value (USD Million) by Ingredient Base, 2025-2035
  • Figure 75: Latin America Market Value (USD Million) by Function, 2025-2035
  • Figure 76: Latin America Market Value (USD Million) by Channel, 2025-2035
  • Figure 77: Latin America Market Value (USD Million) by Packaging, 2025-2035
  • Figure 78: Latin America Market Value (USD Million) by Country, 2025-2035
  • Figure 79: Latin America Market Value (USD Million) Analysis by Country, 2020-2035
  • Figure 80: Latin America Market Volume (Units) Analysis by Country, 2020-2035
  • Figure 81: Latin America Market Value Share (%) and BPS Analysis by Country, 2025-2035
  • Figure 82: Latin America Market Y-o-Y Growth (%) Projections by Country, 2025-2035
  • Figure 83: Latin America Market Value (USD Million) Analysis by Product Type, 2020-2035
  • Figure 84: Latin America Market Volume (Units) Analysis by Product Type, 2020-2035
  • Figure 85: Latin America Market Value Share (%) and BPS Analysis by Product Type, 2025-2035
  • Figure 86: Latin America Market Y-o-Y Growth (%) Projections by Product Type, 2025-2035
  • Figure 87: Latin America Market Value (USD Million) Analysis by Ingredient Base, 2020-2035
  • Figure 88: Latin America Market Volume (Units) Analysis by Ingredient Base, 2020-2035
  • Figure 89: Latin America Market Value Share (%) and BPS Analysis by Ingredient Base, 2025-2035
  • Figure 90: Latin America Market Y-o-Y Growth (%) Projections by Ingredient Base, 2025-2035
  • Figure 91: Latin America Market Value (USD Million) Analysis by Function, 2020-2035
  • Figure 92: Latin America Market Volume (Units) Analysis by Function, 2020-2035
  • Figure 93: Latin America Market Value Share (%) and BPS Analysis by Function, 2025-2035
  • Figure 94: Latin America Market Y-o-Y Growth (%) Projections by Function, 2025-2035
  • Figure 95: Latin America Market Value (USD Million) Analysis by Channel, 2020-2035
  • Figure 96: Latin America Market Volume (Units) Analysis by Channel, 2020-2035
  • Figure 97: Latin America Market Value Share (%) and BPS Analysis by Channel, 2025-2035
  • Figure 98: Latin America Market Y-o-Y Growth (%) Projections by Channel, 2025-2035
  • Figure 99: Latin America Market Value (USD Million) Analysis by Packaging, 2020-2035
  • Figure 100: Latin America Market Volume (Units) Analysis by Packaging, 2020-2035
  • Figure 101: Latin America Market Value Share (%) and BPS Analysis by Packaging, 2025-2035
  • Figure 102: Latin America Market Y-o-Y Growth (%) Projections by Packaging, 2025-2035
  • Figure 103: Latin America Market Attractiveness by Product Type, 2025-2035
  • Figure 104: Latin America Market Attractiveness by Ingredient Base, 2025-2035
  • Figure 105: Latin America Market Attractiveness by Function, 2025-2035
  • Figure 106: Latin America Market Attractiveness by Channel, 2025-2035
  • Figure 107: Latin America Market Attractiveness by Packaging, 2025-2035
  • Figure 108: Latin America Market Attractiveness by Country, 2025-2035
  • Figure 109: Europe Market Value (USD Million) by Product Type, 2025-2035
  • Figure 110: Europe Market Value (USD Million) by Ingredient Base, 2025-2035
  • Figure 111: Europe Market Value (USD Million) by Function, 2025-2035
  • Figure 112: Europe Market Value (USD Million) by Channel, 2025-2035
  • Figure 113: Europe Market Value (USD Million) by Packaging, 2025-2035
  • Figure 114: Europe Market Value (USD Million) by Country, 2025-2035
  • Figure 115: Europe Market Value (USD Million) Analysis by Country, 2020-2035
  • Figure 116: Europe Market Volume (Units) Analysis by Country, 2020-2035
  • Figure 117: Europe Market Value Share (%) and BPS Analysis by Country, 2025-2035
  • Figure 118: Europe Market Y-o-Y Growth (%) Projections by Country, 2025-2035
  • Figure 119: Europe Market Value (USD Million) Analysis by Product Type, 2020-2035
  • Figure 120: Europe Market Volume (Units) Analysis by Product Type, 2020-2035
  • Figure 121: Europe Market Value Share (%) and BPS Analysis by Product Type, 2025-2035
  • Figure 122: Europe Market Y-o-Y Growth (%) Projections by Product Type, 2025-2035
  • Figure 123: Europe Market Value (USD Million) Analysis by Ingredient Base, 2020-2035
  • Figure 124: Europe Market Volume (Units) Analysis by Ingredient Base, 2020-2035
  • Figure 125: Europe Market Value Share (%) and BPS Analysis by Ingredient Base, 2025-2035
  • Figure 126: Europe Market Y-o-Y Growth (%) Projections by Ingredient Base, 2025-2035
  • Figure 127: Europe Market Value (USD Million) Analysis by Function, 2020-2035
  • Figure 128: Europe Market Volume (Units) Analysis by Function, 2020-2035
  • Figure 129: Europe Market Value Share (%) and BPS Analysis by Function, 2025-2035
  • Figure 130: Europe Market Y-o-Y Growth (%) Projections by Function, 2025-2035
  • Figure 131: Europe Market Value (USD Million) Analysis by Channel, 2020-2035
  • Figure 132: Europe Market Volume (Units) Analysis by Channel, 2020-2035
  • Figure 133: Europe Market Value Share (%) and BPS Analysis by Channel, 2025-2035
  • Figure 134: Europe Market Y-o-Y Growth (%) Projections by Channel, 2025-2035
  • Figure 135: Europe Market Value (USD Million) Analysis by Packaging, 2020-2035
  • Figure 136: Europe Market Volume (Units) Analysis by Packaging, 2020-2035
  • Figure 137: Europe Market Value Share (%) and BPS Analysis by Packaging, 2025-2035
  • Figure 138: Europe Market Y-o-Y Growth (%) Projections by Packaging, 2025-2035
  • Figure 139: Europe Market Attractiveness by Product Type, 2025-2035
  • Figure 140: Europe Market Attractiveness by Ingredient Base, 2025-2035
  • Figure 141: Europe Market Attractiveness by Function, 2025-2035
  • Figure 142: Europe Market Attractiveness by Channel, 2025-2035
  • Figure 143: Europe Market Attractiveness by Packaging, 2025-2035
  • Figure 144: Europe Market Attractiveness by Country, 2025-2035
  • Figure 145: East Asia Market Value (USD Million) by Product Type, 2025-2035
  • Figure 146: East Asia Market Value (USD Million) by Ingredient Base, 2025-2035
  • Figure 147: East Asia Market Value (USD Million) by Function, 2025-2035
  • Figure 148: East Asia Market Value (USD Million) by Channel, 2025-2035
  • Figure 149: East Asia Market Value (USD Million) by Packaging, 2025-2035
  • Figure 150: East Asia Market Value (USD Million) by Country, 2025-2035
  • Figure 151: East Asia Market Value (USD Million) Analysis by Country, 2020-2035
  • Figure 152: East Asia Market Volume (Units) Analysis by Country, 2020-2035
  • Figure 153: East Asia Market Value Share (%) and BPS Analysis by Country, 2025-2035
  • Figure 154: East Asia Market Y-o-Y Growth (%) Projections by Country, 2025-2035
  • Figure 155: East Asia Market Value (USD Million) Analysis by Product Type, 2020-2035
  • Figure 156: East Asia Market Volume (Units) Analysis by Product Type, 2020-2035
  • Figure 157: East Asia Market Value Share (%) and BPS Analysis by Product Type, 2025-2035
  • Figure 158: East Asia Market Y-o-Y Growth (%) Projections by Product Type, 2025-2035
  • Figure 159: East Asia Market Value (USD Million) Analysis by Ingredient Base, 2020-2035
  • Figure 160: East Asia Market Volume (Units) Analysis by Ingredient Base, 2020-2035
  • Figure 161: East Asia Market Value Share (%) and BPS Analysis by Ingredient Base, 2025-2035
  • Figure 162: East Asia Market Y-o-Y Growth (%) Projections by Ingredient Base, 2025-2035
  • Figure 163: East Asia Market Value (USD Million) Analysis by Function, 2020-2035
  • Figure 164: East Asia Market Volume (Units) Analysis by Function, 2020-2035
  • Figure 165: East Asia Market Value Share (%) and BPS Analysis by Function, 2025-2035
  • Figure 166: East Asia Market Y-o-Y Growth (%) Projections by Function, 2025-2035
  • Figure 167: East Asia Market Value (USD Million) Analysis by Channel, 2020-2035
  • Figure 168: East Asia Market Volume (Units) Analysis by Channel, 2020-2035
  • Figure 169: East Asia Market Value Share (%) and BPS Analysis by Channel, 2025-2035
  • Figure 170: East Asia Market Y-o-Y Growth (%) Projections by Channel, 2025-2035
  • Figure 171: East Asia Market Value (USD Million) Analysis by Packaging, 2020-2035
  • Figure 172: East Asia Market Volume (Units) Analysis by Packaging, 2020-2035
  • Figure 173: East Asia Market Value Share (%) and BPS Analysis by Packaging, 2025-2035
  • Figure 174: East Asia Market Y-o-Y Growth (%) Projections by Packaging, 2025-2035
  • Figure 175: East Asia Market Attractiveness by Product Type, 2025-2035
  • Figure 176: East Asia Market Attractiveness by Ingredient Base, 2025-2035
  • Figure 177: East Asia Market Attractiveness by Function, 2025-2035
  • Figure 178: East Asia Market Attractiveness by Channel, 2025-2035
  • Figure 179: East Asia Market Attractiveness by Packaging, 2025-2035
  • Figure 180: East Asia Market Attractiveness by Country, 2025-2035
  • Figure 181: South Asia & Pacific Market Value (USD Million) by Product Type, 2025-2035
  • Figure 182: South Asia & Pacific Market Value (USD Million) by Ingredient Base, 2025-2035
  • Figure 183: South Asia & Pacific Market Value (USD Million) by Function, 2025-2035
  • Figure 184: South Asia & Pacific Market Value (USD Million) by Channel, 2025-2035
  • Figure 185: South Asia & Pacific Market Value (USD Million) by Packaging, 2025-2035
  • Figure 186: South Asia & Pacific Market Value (USD Million) by Country, 2025-2035
  • Figure 187: South Asia & Pacific Market Value (USD Million) Analysis by Country, 2020-2035
  • Figure 188: South Asia & Pacific Market Volume (Units) Analysis by Country, 2020-2035
  • Figure 189: South Asia & Pacific Market Value Share (%) and BPS Analysis by Country, 2025-2035
  • Figure 190: South Asia & Pacific Market Y-o-Y Growth (%) Projections by Country, 2025-2035
  • Figure 191: South Asia & Pacific Market Value (USD Million) Analysis by Product Type, 2020-2035
  • Figure 192: South Asia & Pacific Market Volume (Units) Analysis by Product Type, 2020-2035
  • Figure 193: South Asia & Pacific Market Value Share (%) and BPS Analysis by Product Type, 2025-2035
  • Figure 194: South Asia & Pacific Market Y-o-Y Growth (%) Projections by Product Type, 2025-2035
  • Figure 195: South Asia & Pacific Market Value (USD Million) Analysis by Ingredient Base, 2020-2035
  • Figure 196: South Asia & Pacific Market Volume (Units) Analysis by Ingredient Base, 2020-2035
  • Figure 197: South Asia & Pacific Market Value Share (%) and BPS Analysis by Ingredient Base, 2025-2035
  • Figure 198: South Asia & Pacific Market Y-o-Y Growth (%) Projections by Ingredient Base, 2025-2035
  • Figure 199: South Asia & Pacific Market Value (USD Million) Analysis by Function, 2020-2035
  • Figure 200: South Asia & Pacific Market Volume (Units) Analysis by Function, 2020-2035
  • Figure 201: South Asia & Pacific Market Value Share (%) and BPS Analysis by Function, 2025-2035
  • Figure 202: South Asia & Pacific Market Y-o-Y Growth (%) Projections by Function, 2025-2035
  • Figure 203: South Asia & Pacific Market Value (USD Million) Analysis by Channel, 2020-2035
  • Figure 204: South Asia & Pacific Market Volume (Units) Analysis by Channel, 2020-2035
  • Figure 205: South Asia & Pacific Market Value Share (%) and BPS Analysis by Channel, 2025-2035
  • Figure 206: South Asia & Pacific Market Y-o-Y Growth (%) Projections by Channel, 2025-2035
  • Figure 207: South Asia & Pacific Market Value (USD Million) Analysis by Packaging, 2020-2035
  • Figure 208: South Asia & Pacific Market Volume (Units) Analysis by Packaging, 2020-2035
  • Figure 209: South Asia & Pacific Market Value Share (%) and BPS Analysis by Packaging, 2025-2035
  • Figure 210: South Asia & Pacific Market Y-o-Y Growth (%) Projections by Packaging, 2025-2035
  • Figure 211: South Asia & Pacific Market Attractiveness by Product Type, 2025-2035
  • Figure 212: South Asia & Pacific Market Attractiveness by Ingredient Base, 2025-2035
  • Figure 213: South Asia & Pacific Market Attractiveness by Function, 2025-2035
  • Figure 214: South Asia & Pacific Market Attractiveness by Channel, 2025-2035
  • Figure 215: South Asia & Pacific Market Attractiveness by Packaging, 2025-2035
  • Figure 216: South Asia & Pacific Market Attractiveness by Country, 2025-2035
  • Figure 217: Middle East and Africa Market Value (USD Million) by Product Type, 2025-2035
  • Figure 218: Middle East and Africa Market Value (USD Million) by Ingredient Base, 2025-2035
  • Figure 219: Middle East and Africa Market Value (USD Million) by Function, 2025-2035
  • Figure 220: Middle East and Africa Market Value (USD Million) by Channel, 2025-2035
  • Figure 221: Middle East and Africa Market Value (USD Million) by Packaging, 2025-2035
  • Figure 222: Middle East and Africa Market Value (USD Million) by Country, 2025-2035
  • Figure 223: Middle East and Africa Market Value (USD Million) Analysis by Country, 2020-2035
  • Figure 224: Middle East and Africa Market Volume (Units) Analysis by Country, 2020-2035
  • Figure 225: Middle East and Africa Market Value Share (%) and BPS Analysis by Country, 2025-2035
  • Figure 226: Middle East and Africa Market Y-o-Y Growth (%) Projections by Country, 2025-2035
  • Figure 227: Middle East and Africa Market Value (USD Million) Analysis by Product Type, 2020-2035
  • Figure 228: Middle East and Africa Market Volume (Units) Analysis by Product Type, 2020-2035
  • Figure 229: Middle East and Africa Market Value Share (%) and BPS Analysis by Product Type, 2025-2035
  • Figure 230: Middle East and Africa Market Y-o-Y Growth (%) Projections by Product Type, 2025-2035
  • Figure 231: Middle East and Africa Market Value (USD Million) Analysis by Ingredient Base, 2020-2035
  • Figure 232: Middle East and Africa Market Volume (Units) Analysis by Ingredient Base, 2020-2035
  • Figure 233: Middle East and Africa Market Value Share (%) and BPS Analysis by Ingredient Base, 2025-2035
  • Figure 234: Middle East and Africa Market Y-o-Y Growth (%) Projections by Ingredient Base, 2025-2035
  • Figure 235: Middle East and Africa Market Value (USD Million) Analysis by Function, 2020-2035
  • Figure 236: Middle East and Africa Market Volume (Units) Analysis by Function, 2020-2035
  • Figure 237: Middle East and Africa Market Value Share (%) and BPS Analysis by Function, 2025-2035
  • Figure 238: Middle East and Africa Market Y-o-Y Growth (%) Projections by Function, 2025-2035
  • Figure 239: Middle East and Africa Market Value (USD Million) Analysis by Channel, 2020-2035
  • Figure 240: Middle East and Africa Market Volume (Units) Analysis by Channel, 2020-2035
  • Figure 241: Middle East and Africa Market Value Share (%) and BPS Analysis by Channel, 2025-2035
  • Figure 242: Middle East and Africa Market Y-o-Y Growth (%) Projections by Channel, 2025-2035
  • Figure 243: Middle East and Africa Market Value (USD Million) Analysis by Packaging, 2020-2035
  • Figure 244: Middle East and Africa Market Volume (Units) Analysis by Packaging, 2020-2035
  • Figure 245: Middle East and Africa Market Value Share (%) and BPS Analysis by Packaging, 2025-2035
  • Figure 246: Middle East and Africa Market Y-o-Y Growth (%) Projections by Packaging, 2025-2035
  • Figure 247: Middle East and Africa Market Attractiveness by Product Type, 2025-2035
  • Figure 248: Middle East and Africa Market Attractiveness by Ingredient Base, 2025-2035
  • Figure 249: Middle East and Africa Market Attractiveness by Function, 2025-2035
  • Figure 250: Middle East and Africa Market Attractiveness by Channel, 2025-2035
  • Figure 251: Middle East and Africa Market Attractiveness by Packaging, 2025-2035
  • Figure 252: Middle East and Africa Market Attractiveness by Country, 2025-2035

Frequently Asked Questions

How big is the Waterless Cosmetics Powders Market in 2025?

The global Waterless Cosmetics Powders Market is estimated to be valued at USD 1,752.3 million in 2025, supported by strong demand for sustainable, travel-friendly, and multifunctional beauty formats.

What will be the size of the Waterless Cosmetics Powders Market in 2035?

The market size for the Waterless Cosmetics Powders Market is projected to reach USD 5,210.3 million by 2035, indicating a strong long-term expansion trajectory.

How much will be the Waterless Cosmetics Powders Market growth between 2025 and 2035?

The Waterless Cosmetics Powders Market is expected to grow at a CAGR of 11.5% between 2025 and 2035, more than doubling its overall size.

What are the key product types in the Waterless Cosmetics Powders Market?

The key product types in the Waterless Cosmetics Powders Market include cleansing powders, shampoo powders, powdered masks, and powder-to-cream moisturizers.

Which channel segment will contribute significant share in the Waterless Cosmetics Powders Market in 2025?

In terms of distribution, the e-commerce channel is projected to command a 51.5% share of the Waterless Cosmetics Powders Market in 2025.

Explore Similar Insights

Future Market Insights

Waterless Cosmetics Powders Market

Chat With

MaRIA

Hi There, I am MaRIA, Your Market Research Intelligence Assistant. How may I help you?