Tinted Cosmetics Market
Tinted Cosmetics: Perfect Solution for Minimalistic Approach to Skin Care Making Waves in the Fashion and Cosmetics Industries Across the U.S., Japan, Korea, the U.K., and 30+Countries! Find Out More With FMI
Tinted Cosmetics Market by Product Type, Application, Consumer Orientation, Nature of Product, Distribution Channel & Region - Forecast 2022 - 2032
Tinted Cosmetics Market Outlook 2022-2032
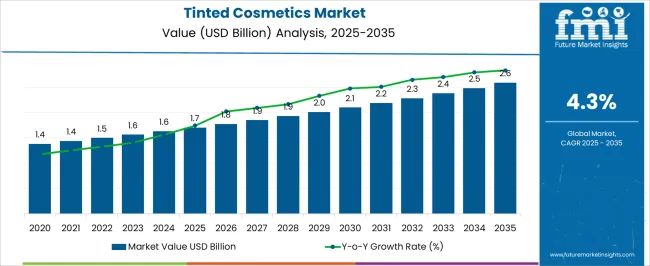
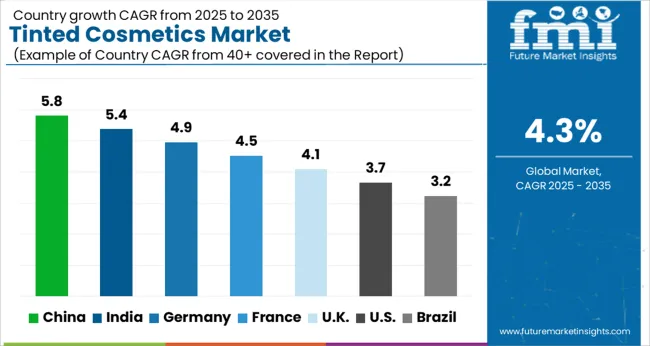
The global tinted cosmetics market size is expected to grow from US$ 1,500.0 Mn in 2022 and to US$ 2,290.0 Mn by the end of 2032, with overall sales accelerating at a moderate CAGR of ~4.3% during the forecast period. Rising consumer spending on cosmetics across the world is a key factor expected to boost sales of tinted cosmetic during the forecast period.
Tinted cosmetics are commonly used by people all over the world to cover up the blemishes, uneven skin tone, and pores on the skin. These cosmetic products are gaining popularity, as they help in achieving a natural and makeup free look. They are lighter than other makeup and cosmetic products and do not affect skin health, as they have simple pigments without any chemical compounds.
Growing focus on getting a natural and makeup free look coupled with rising consumer awareness about the benefits of tinted cosmetics is expected to drive the global market swiftly during the forecast period.
Similarly, increasing usage of cosmetics in urban areas and growing focus towards environmentally sustainable products will boost sales of tinted cosmetics over the next ten years.
Cosmetics and makeup products are observing increasing demand day by day. Cosmetics are commonly used by the urban population on a daily to enhance appearance and give a self-esteem boost. Personal style and social expression are considered important in urban areas and the corporate sector, making them lucrative markets for cosmetics and tinted cosmetics manufacturers.
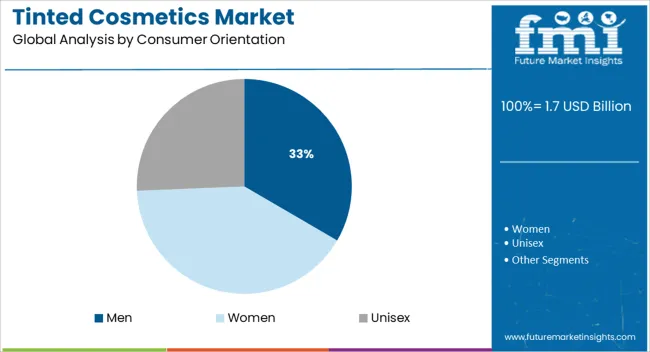
Men, like women, are interested in and use cosmetic items on a regular basis. As people's lifestyles change, males are becoming more concerned about hygiene and healthcare. Tinted cosmetics are becoming more popular among males because they are not flashy and only cover up blemishes and dark spots, with no added glow or pigmentation. Men’s tinted face products have high demand, with ~40% market share along with other tinted cosmetic products.
Manufacturers are also focusing on introducing environmentally friendly and sustainable cosmetic goods. Customers are aware of the negative consequences of chemical substances and carbon emissions. They are becoming interested in organic, vegan cosmetics and the pigments derived from natural ingredients, in addition to 'green products.'
Attribute |
Key Insights |
Tinted Cosmetics Market Estimated Value (2022) |
~US$ 1,500.0 Mn |
Projected Market Value (2032) |
~US$ 2,290.0 Mn |
Value-based CAGR Market CAGR (2022-2032) |
~4.3% |
Let us know your requirement to get
100% FREE customization
2017-2021 Tinted Cosmetics Market Outlook Compared to 2022-2032 Forecast
As per FMI, global sales of tinted cosmetics grew at a sluggish pace during the historical period from 2017 to 2021. However, with growing trend of Skinimalism and increasing consumer awareness about the benefits of using these tinted cosmetics, the overall market is set to accelerate at a steady pace of 4.3% CAGR between 2022 and 2032.
Tinted cosmetics are a subset of cosmetic products that incorporate pigments. These pigments can be used to enhance the skin's complexion or to conceal dark patches and uneven skin tone. Some tinted cosmetics are designed to provide extra advantages, such as making the skin shine and keeping it moisturized.
Consumers choose tinted cosmetic products because they mimic the natural skin tone and provide a make-up-free, natural glow to the complexion. These cosmetics are not just utilized by women but men are also increasingly requesting tinted moisturizers and serums as skincare products become more popular.
Manufacturers are also focused on tinted cosmetic product improvements. Many major manufacturers have produced products that possess multipurpose properties. People are selecting items derived from natural materials as they become more conscious of the usage of chemical substances in cosmetic and make-up products. Manufacturers are beginning to offer cosmetic products manufactured with natural chemicals in response to rising demand.
Comparative Analysis of Tinted Cosmetics Markets
Tinted Cosmetics Market:
Differentiating Aspects | Tinted Cosmetics Market |
CAGR in 2022-2032 | 4.3% |
Current Valuation in 2022 | US$ 1,500.0 Mn |
Projected Valuation in 2032 | US$ 2,290.0 Mn |
Demand Drivers |
|
Tinted Sunscreen Market:
Differentiating Aspects | Tinted Sunscreen Market |
CAGR in 2022-2032 | 4.5% |
Current Valuation in 2022 | US$ 980 Mn |
Projected Valuation in 2032 | US$ 1.67 Bn |
Demand Drivers |
|
Colour Cosmetics Market:
Differentiating Aspects | Colour Cosmetics Market |
CAGR in 2022-2032 | 5% |
Current Valuation in 2022 | US$ 52.5 Bn |
Projected Valuation in 2032 | US$ 85.52 Bn |
Demand Drivers |
|
Find your sweet spots for generating winning opportunities in this market.
Talk to AnalystWhat are the Trends Responsible for Increased Use of Tinted Cosmetics?
“Rising Trend of Skinimalism and Availability of Multifunctional Cosmetics Boosting Sales”
Tinted cosmetics are used to impart a glow to natural skin and to achieve a makeup-free look. Skinimalism and minimal cosmetics are becoming new trends in fashion industry globally.
Women are making every effort to appear as natural as possible. Tinted cosmetics are commonly used to accomplish this look because they are suitable for all skin tones and improve appearance without the use of heavy makeup. Increased skin colour awareness is also increasing demand for and sales of tinted cosmetics.
There are cosmetic products with only certain benefits. However, multifunctional goods are becoming increasingly popular because they can handle numerous tasks at once. Many tinted cosmetics are multipurpose items that provide a glow to the complexion while also moisturizing and protecting the skin from impurities such as dirt and particle matter and also acting as a sunblock and antibacterial ingredient that aid in acne prevention.
What Factors are Affecting the Tinted Cosmetics Industry?
“Penetration of Fake Products and Regulations on Chemical Compounds Badly Impacting Market”
The tinted cosmetics business is hampered by a variety of factors, the most significant of which are counterfeit products, prohibitions on the use of chemical compounds, and fierce competition among the leading manufacturers.
Local manufacturers counterfeit top brands, and these products are of poor quality. There may be some hazards to skin by using these products. Such items can harm the reputation of well-known businesses and reduce sales of genuine products.
Several reputable brands manufacture tinted cosmetics with various functions and benefits. These brands are constantly competing to gain an advantage and dominate the market. The high number of manufacturing companies, new entrants into the industry, and their competitiveness are also influencing the market to some extent.
Cosmetics contain several chemical ingredients that may be prohibited or limited for usage by the regional authorities. Tinted cosmetic goods face limited sales as a result of such limitations, affecting market expansion.
A unified Market Research Subscription Platform, built for today's disparate research needs.
Country Insights
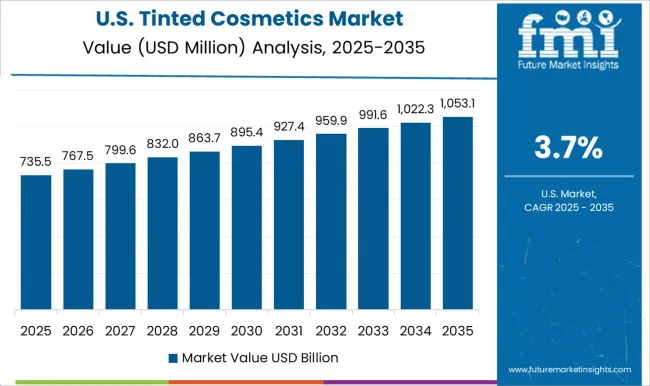
Which Factors are Generating High Demand for Tinted Cosmetics Across the U.S.?
“Growing Trend of Skinimalism Boosting Sales in the U.S.”
According to Future Market Insights, the U.S. tinted cosmetics industry is projected to expand at a steady pace during the forecast period owing to the rising trend of skinimalism, increasing spending on cosmetics by American women, and heavy presence of leading tinted cosmetic manufacturers.
Skinimalism is a growing trend around the world, and it has a significant impact on the female population in the United States. It simply means using minimum cosmetics for skin maintenance and maintaining a natural appearance at all times.
Throughout the world, American women used the most skin care products and cosmetics, and on average American people spend US$250 to U$ 320 on cosmetic products every month. Many people developed skin problems because of overuse of heavy makeup and cosmetic goods.
In order to address this issue as well as to enhance their looks, American women shifted their focus towards tinted cosmetics. This is expected to generate high demand for tinted cosmetics like foundation and moisturizers in the U.S. during the forecast period.
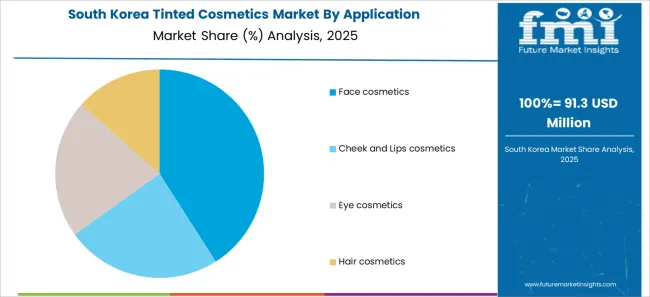
How is the Market for Tinted Cosmetics Performing in South Korea?
“Focus on Getting a Light and No Makeup Look Pushing Demand for Tinted Cosmetics in Korea”
Demand for tinted cosmetics across South Korea is expected to grow at a moderate CAGR during the next ten years owing to the rising consumer preference to get a light and no makeup look.
South Korea is one of the biggest manufacturers and consumers of cosmetic products. Import of cosmetic products from South Korea in 2021 was about US$ 560 million and this number is likely to further rise during the upcoming years due to the influence of social media. The prominence of K-Pop and K-Drama in the Korean entertainment industry has spurred female and male experimentation with diverse looks and haircuts.
Both Korean men and women often use skin tints and tinted blushes to enhance the skin complexion and achieve a no-makeup look. All these factors are increasing the sales of tinted cosmetics in Korea.
Category-wise Insights
Which is the Most Lucrative Application for Tinted Cosmetics?
“Face Cosmetics to Create Maximum Profit for Tinted Cosmetics Manufacturers”
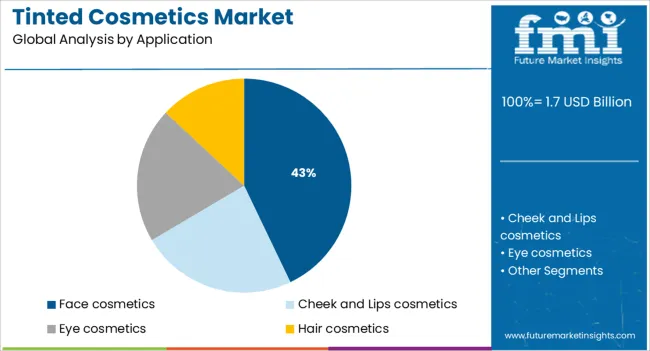
Based on application, face cosmetics category holds over 42% share of the global tinted cosmetics industry and it is expected to grow at a higher CAGR over the next ten years. This can be attributed to the rising consumption of tinted face cosmetics such as sunscreens, moisturizers, foundation, and lip tints.
Face tinted cosmetics are the most commonly used products by people throughout the world These products include moisturisers, serums, and foundations. Men and women use these products for protecting their faces as well as to get a natural glow.
Competitive Landscape
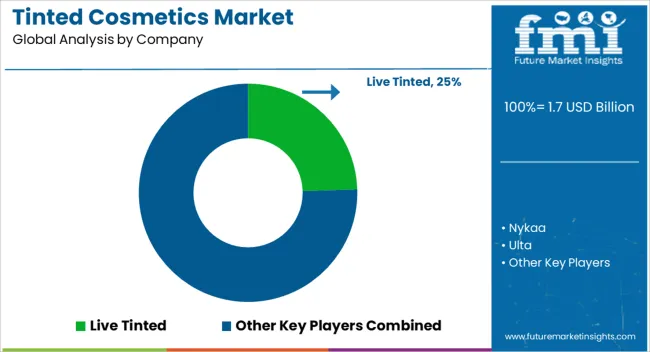
Key players in the tinted cosmetics industry are Live Tinted, Nykaa, Ulta, Tint Cosmetics, e.l.f., Lab Series, Maybelline, Lakmé, Rare Beauty, Oriflame, Nivea, Bobbi Brown, BareMinerals, Kosas and others. These players are continuously upgrading their product portfolios through new product launches. Furthermore, they are partnering and collaborating with other brands or celebrities to expand their customer base. For instance,
- Live Tinted, a cosmetics brand, and Phenomenal, a media and merchandise organization collaborated in 2021 to give customers a gift set, including hue sticks, eye masks, orange colored hoodie, and a handcrafted Diya. The cosmetic brand also collaborated with Mattel, to launch limited edition Barbie line and Huestick products.
- Rare Beauty, a vegan cosmetics brand, launched a tinted moisturizer in mid-2022. This moisturizer also acts as sun protection from mild sun rays. It contained vitamin E, helping in keeping the skin hydrated, and SPF 20, protecting from sun rays.
Scope of Report
Attribute |
Details |
Estimated Market Size (2022) |
~US$ 1,500.0 Mn |
Projected Market Size (2032) |
~US$ 2,290.0 Mn |
Anticipated Growth Rate (2022-2032) |
~4.3% CAGR |
Historical Data Available for |
2017-2021 |
Forecast Period |
2022-2032 |
Quantitative units |
Revenue in US$ Million, volume in Units, and CAGR from 2022 to 2032 |
Segments Covered |
Application, Product Type, Consumer Orientation, Nature of Product, Distribution Channel, and Region |
Key Regions Covered |
North America, Latin America, Europe, East Asia, South Asia, Middle East and Africa, and Oceania |
Key Countries Covered |
U.S, Canada, Mexico, Germany, U.K., France, Italy, Spain, Russia, India, Thailand, China, India, Japan, Australia, Brazil, Argentina, Colombia, Saudi Arabia, UAE, South Africa |
Key Companies Profiled |
|
Report Coverage |
Revenue forecast, volume forecast, company ranking, competitive landscape, growth factors, and trends, pricing analysis |
Tinted Cosmetics Category Analysis Segments
By Product Type:
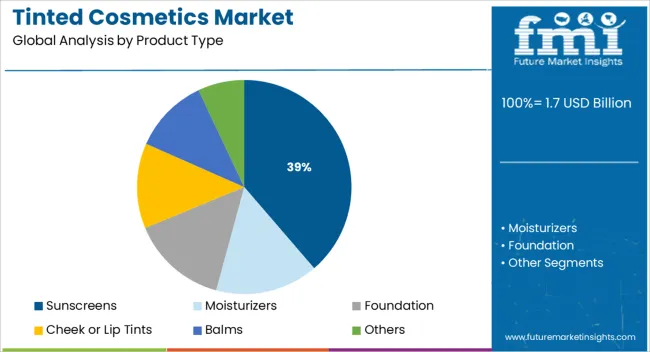
- Sunscreens
- Moisturizers
- Foundation
- Cheek or Lip Tints
- Balms
- Others
By Application:
- Face cosmetics
- Cheek and Lips cosmetics
- Eye cosmetics
- Hair cosmetics
By Consumer Orientation:
- Men
- Women
- Unisex
By Nature of Product:
- Conventional
- Natural
By Distribution Channel:
- Hypermarket/Supermarket
- Specialty Stores
- Pharmacies
- Independent Stores
- Online Store
By Region:
- North America
- Latin America
- Europe
- East Asia
- South Asia
- Oceania
- Middle East and Africa
Frequently Asked Questions
The tinted cosmetics market size is expected to reach a valuation of ~US$ 1,500.0 Mn in 2022.
Demand for tinted cosmetics is anticipated to increase at 4.3% CAGR between 2022 and 2032.
The global tinted cosmetics industry is expected to reach US$ 2,290.0 Mn by 2032.
Increased use of skincare products due to increasing awareness about health and self-care, growing trend of Skinimalism, and adverse effect of heavy makeup products on skin are driving the market for tinted cosmetics.
Leading players operating in tinted cosmetics industry are Live Tinted, Nykaa, Ulta, Tint Cosmetics, e.l.f., Lab Series, Maybelline, Lakmé, Oriflame, Nivea, Bobbi Brown, BareMinerals, Kosas, and Rare Beauty among others.
Table of Content
1. Executive Summary
1.1. Global Market Outlook
1.2. Summary of Key Findings
1.3. Summary of Key statistics
1.4. FMI Analysis and Recommendations
2. Market Overview
2.1. Market Taxonomy
2.2. Market Definition
3. Key Market Trends
3.1. Key Trends Impacting the Market
3.2. Product Innovation Trends
4. Global Market Demand Analysis 2017-2021 and Forecast, 2022-2032
4.1. Historical Market Volume (Units) Analysis, 2017-2021
4.2. Current and Future Market Volume (Units) Projections, 2022-2032
4.3. Y-o-Y Growth Trend Analysis
5. Global Market - Pricing Analysis
5.1. Regional Pricing Analysis By Product Type
5.2. Pricing Break-up
5.2.1. Manufacturer Level Pricing
5.2.2. Distributor Level Pricing
5.3. Average Pricing Analysis Benchmark
6. Global Market Demand (in Value or in US$ Mn) Analysis 2017-2021 and Forecast, 2022-2032
6.1. Historical Market Value (US$ Mn) Analysis, 2017-2021
6.2. Current and Future Market Value (US$ Mn) Projections, 2022-2032
6.2.1. Y-o-Y Growth Trend Analysis
6.2.2. Absolute $ Opportunity Analysis
7. Market Background
7.1. Macro-Economic Factors
7.1.1. Global GDP Growth Outlook
7.1.2. Global Consumer Spending Outlook
7.1.3. Retail Sector GVA and Growth
7.1.4. Per Capita Disposable Income
7.1.5. Global Urbanization Outlook
7.1.6. Global Working Population Statistics
7.1.7. E-commerce Penetration Overview
7.2. Forecast Factors - Relevance & Impact
7.2.1. Top Company’s Historical Growth
7.2.2. Per Capita Disposable Income
7.2.3. Global Consumer Goods Industry Analysis
7.2.4. Global Urbanization Growth outlook
7.2.5. World internet User Statistics
7.3. Industry Value and Supply Chain Analysis
7.4. Market Dynamics
7.4.1. Drivers
7.4.2. Restraints
7.4.3. Opportunity Analysis
7.5. PESTLE Analysis of Market
7.6. Investment Feasibility Matrix
7.7. Porter’s Five Force
8. Global Market Analysis 2017-2021 and Forecast 2022-2032, by Product Type
8.1. Introduction / Key Findings
8.2. Historical Market Size (US$ Mn) and Volume Analysis By Product Type, 2017-2021
8.3. Current and Future Market Size (US$ Mn) and Volume Analysis and Forecast By Product Type, 2022-2032
8.3.1. Sunscreen
8.3.2. Moisturisers
8.3.3. Foundation
8.3.4. Cheek or Lip Tint
8.3.5. Balms
8.3.6. Others
8.4. Market Attractiveness Analysis By Product Type
9. Global Market Analysis 2017-2021 and Forecast 2022-2032, by Consumer Orientation
9.1. Introduction / Key Findings
9.2. Historical Market Size (US$ Mn) and Volume Analysis By Price Range, 2017-2021
9.3. Current and Future Market Size (US$ Mn) and Volume Analysis and Forecast By Consumer Orientation, 2022-2032
9.3.1. Men
9.3.2. Women
9.3.3. Unisex
9.4. Market Attractiveness Analysis By Consumer Orientation
10. Global Market Analysis 2017-2021 and Forecast 2022-2032, by Nature of Product
10.1. Introduction / Key Findings
10.2. Historical Market Size (US$ Mn) and Volume Analysis By Sales Channel, 2017-2021
10.3. Current and Future Market Size (US$ Mn) and Volume Analysis and Forecast By Nature of Product, 2022-2032
10.3.1. Conventional
10.3.2. Natural
10.4. Market Attractiveness Analysis By Nature of Product
11. Global Market Analysis 2017-2021 and Forecast 2022-2032, by Distribution Channel
11.1. Introduction / Key Findings
11.2. Historical Market Size (US$ Mn) and Volume Analysis By Closure Type, 2017-2021
11.3. Current and Future Market Size (US$ Mn) and Volume Analysis and Forecast By Distribution Channel, 2022-2032
11.3.1. Hypermarket/Supermarket
11.3.2. Specialty Stores
11.3.3. Pharmacies
11.3.4. Independent Stores
11.3.5. Online Store
11.4. Market Attractiveness Analysis By Distribution Channel
12. Global Market Analysis 2017-2021 and Forecast 2022-2032, by Region
12.1. Introduction
12.2. Historical Market Size (US$ Mn) and Volume Analysis By Region, 2017-2021
12.3. Current Market Size (US$ Mn) and Volume Analysis and Forecast By Region, 2022-2032
12.3.1. North America
12.3.2. Latin America
12.3.3. Europe
12.3.4. East Asia
12.3.5. South Asia
12.3.6. Oceania
12.3.7. MEA
12.4. Market Attractiveness Analysis By Region
13. North America Market Analysis 2017-2021 and Forecast 2022-2032
13.1. Introduction
13.2. Pricing Analysis
13.3. Historical Market Size (US$ Mn) and Volume Trend Analysis By Market Taxonomy, 2017-2021
13.4. Market Size (US$ Mn) and Volume Forecast By Market Taxonomy, 2022-2032
13.4.1. By Country
13.4.1.1. US
13.4.1.2. Canada
13.4.2. By Product Type
13.4.3. By Consumer Orientation
13.4.4. By Nature of Product
13.4.5. By Distribution Channel
13.5. Market Attractiveness Analysis
13.5.1. By Country
13.5.2. By Product Type
13.5.3. By Consumer Orientation
13.5.4. By Nature of Product
13.5.5. By Distribution Channel
14. Latin America Market Analysis 2017-2021 and Forecast 2022-2032
14.1. Introduction
14.2. Pricing Analysis
14.3. Historical Market Size (US$ Mn) and Volume Trend Analysis By Market Taxonomy, 2017-2021
14.4. Market Size (US$ Mn) and Volume Forecast By Market Taxonomy, 2022-2032
14.4.1. By Country
14.4.1.1. Brazil
14.4.1.2. Mexico
14.4.1.3. Rest of Latin America
14.4.2. By Product Type
14.4.3. By Consumer Orientation
14.4.4. By Nature of Product
14.4.5. By Distribution Channel
14.5. Market Attractiveness Analysis
14.5.1. By Country
14.5.2. By Product Type
14.5.3. By Consumer Orientation
14.5.4. By Nature of Product
14.5.5. By Distribution Channel
15. Europe Market Analysis 2017-2021 and Forecast 2022-2032
15.1. Introduction
15.2. Pricing Analysis
15.3. Historical Market Size (US$ Mn) and Volume Trend Analysis By Market Taxonomy, 2017-2021
15.4. Market Size (US$ Mn) and Volume Forecast By Market Taxonomy, 2022-2032
15.4.1. By Country
15.4.1.1. UK
15.4.1.2. Germany
15.4.1.3. Italy
15.4.1.4. Spain
15.4.1.5. France
15.4.1.6. Russia
15.4.1.7. Rest of Europe
15.4.2. By Product Type
15.4.3. By Consumer Orientation
15.4.4. By Nature of Product
15.4.5. By Distribution Channel
15.5. Market Attractiveness Analysis
15.5.1. By Country
15.5.2. By Product Type
15.5.3. By Consumer Orientation
15.5.4. By Nature of Product
15.5.5. By Distribution Channel
16. East Asia Market Analysis 2017-2021 and Forecast 2022-2032
16.1. Introduction
16.2. Pricing Analysis
16.3. Historical Market Size (US$ Mn) and Volume Trend Analysis By Market Taxonomy, 2017-2021
16.4. Market Size (US$ Mn) and Volume Forecast By Market Taxonomy, 2022-2032
16.4.1. By Country
16.4.1.1. China
16.4.1.2. Japan
16.4.1.3. South Korea
16.4.2. By Product Type
16.4.3. By Consumer Orientation
16.4.4. By Nature of Product
16.4.5. By Distribution Channel
16.5. Market Attractiveness Analysis
16.5.1. By Country
16.5.2. By Product Type
16.5.3. By Consumer Orientation
16.5.4. By Nature of Product
16.5.5. By Distribution Channel
17. South Asia Market Analysis 2017-2021 and Forecast 2022-2032
17.1. Introduction
17.2. Pricing Analysis
17.3. Historical Market Size (US$ Mn) and Volume Trend Analysis By Market Taxonomy, 2017-2021
17.4. Market Size (US$ Mn) and Volume Forecast By Market Taxonomy, 2022-2032
17.4.1. By Country
17.4.1.1. India
17.4.1.2. Thailand
17.4.1.3. Malaysia
17.4.1.4. Indonesia
17.4.1.5. Rest of South Asia
17.4.2. By Product Type
17.4.3. By Consumer Orientation
17.4.4. By Nature of Product
17.4.5. By Distribution Channel
17.5. Market Attractiveness Analysis
17.5.1. By Country
17.5.2. By Product Type
17.5.3. By Consumer Orientation
17.5.4. By Nature of Product
17.5.5. By Distribution Channel
18. Oceania Market Analysis 2017-2021 and Forecast 2022-2032
18.1. Introduction
18.2. Pricing Analysis
18.3. Historical Market Size (US$ Mn) and Volume Trend Analysis By Market Taxonomy, 2017-2021
18.4. Market Size (US$ Mn) and Volume Forecast By Market Taxonomy, 2022-2032
18.4.1. By Country
18.4.1.1. Australia
18.4.1.2. New Zealand
18.4.2. By Product Type
18.4.3. By Consumer Orientation
18.4.4. By Nature of Product
18.4.5. By Distribution Channel
18.5. Market Attractiveness Analysis
18.5.1. By Country
18.5.2. By Product Type
18.5.3. By Consumer Orientation
18.5.4. By Nature of Product
18.5.5. By Distribution Channel
19. MEA Market Analysis 2017-2021 and Forecast 2022-2032
19.1. Introduction
19.2. Pricing Analysis
19.3. Historical Market Size (US$ Mn) and Volume Trend Analysis By Market Taxonomy, 2017-2021
19.4. Market Size (US$ Mn) and Volume Forecast By Market Taxonomy, 2022-2032
19.4.1. By Country
19.4.1.1. GCC Countries
19.4.1.2. South Africa
19.4.1.3. Rest of MEA
19.4.2. By Product Type
19.4.3. By Consumer Orientation
19.4.4. By Nature of Product
19.4.5. By Distribution Channel
19.5. Market Attractiveness Analysis
19.5.1. By Country
19.5.2. By Product Type
19.5.3. By Consumer Orientation
19.5.4. By Nature of Product
19.5.5. By Distribution Channel
20. Market Structure Analysis
20.1. Market Analysis by Tier of Companies
20.2. Market Concentration
20.3. Market Share Analysis of Top Players
20.4. Market Presence Analysis
20.4.1. By Regional footprint of Players
20.4.2. Product foot print by Players
20.4.3. Channel Foot Print by Players
21. Competition Analysis
21.1. Competition Dashboard
21.2. Pricing Analysis by Competition
21.3. Competition Benchmarking
21.4. Competition Deep Dive
21.4.1. Live Tinted
21.4.1.1. Overview
21.4.1.2. Product Portfolio
21.4.1.3. Profitability by Market Segments (Product Type/Consumer Orientation/Nature of Product/Distribution Channel/Region)
21.4.1.4. Distribution Footprint
21.4.1.5. Strategy Overview
21.4.2. Nykaa
21.4.2.1. Overview
21.4.2.2. Product Portfolio
21.4.2.3. Profitability by Market Segments (Product Type/Consumer Orientation/Nature of Product/Distribution Channel/Region)
21.4.2.4. Distribution Footprint
21.4.2.5. Strategy Overview
21.4.3. Ulta
21.4.3.1. Overview
21.4.3.2. Product Portfolio
21.4.3.3. Profitability by Market Segments (Product Type/Consumer Orientation/Nature of Product/Distribution Channel/Region)
21.4.3.4. Distribution Footprint
21.4.3.5. Strategy Overview
21.4.4. Tint Cosmetics
21.4.4.1. Overview
21.4.4.2. Product Portfolio
21.4.4.3. Profitability by Market Segments (Product Type/Consumer Orientation/Nature of Product/Distribution Channel/Region)
21.4.4.4. Distribution Footprint
21.4.4.5. Strategy Overview
21.4.5. e.l.f.
21.4.5.1. Overview
21.4.5.2. Product Portfolio
21.4.5.3. Profitability by Market Segments (Product Type/Consumer Orientation/Nature of Product/Distribution Channel/Region)
21.4.5.4. Distribution Footprint
21.4.5.5. Strategy Overview
21.4.6. Lab Series
21.4.6.1. Overview
21.4.6.2. Product Portfolio
21.4.6.3. Profitability by Market Segments (Product Type/Consumer Orientation/Nature of Product/Distribution Channel/Region)
21.4.6.4. Distribution Footprint
21.4.6.5. Strategy Overview
21.4.7. Maybelline
21.4.7.1. Overview
21.4.7.2. Product Portfolio
21.4.7.3. Profitability by Market Segments (Product Type/Consumer Orientation/Nature of Product/Distribution Channel/Region)
21.4.7.4. Distribution Footprint
21.4.7.5. Strategy Overview
21.4.8. Lakmé
21.4.8.1. Overview
21.4.8.2. Product Portfolio
21.4.8.3. Profitability by Market Segments (Product Type/Consumer Orientation/Nature of Product/Distribution Channel/Region)
21.4.8.4. Distribution Footprint
21.4.8.5. Strategy Overview
21.4.9. Rare Beauty
21.4.9.1. Overview
21.4.9.2. Product Portfolio
21.4.9.3. Profitability by Market Segments (Product Type/Consumer Orientation/Nature of Product/Distribution Channel/Region)
21.4.9.4. Distribution Footprint
21.4.9.5. Strategy Overview
21.4.10. Oriflame
21.4.10.1. Overview
21.4.10.2. Product Portfolio
21.4.10.3. Profitability by Market Segments (Product Type/Consumer Orientation/Nature of Product/Distribution Channel/Region)
21.4.10.4. Distribution Footprint
21.4.10.5. Strategy Overview
21.4.11. Nivea
21.4.11.1. Overview
21.4.11.2. Product Portfolio
21.4.11.3. Profitability by Market Segments (Product Type/Consumer Orientation/Nature of Product/Distribution Channel/Region)
21.4.11.4. Distribution Footprint
21.4.11.5. Strategy Overview
21.4.12. Bobbi Brown
21.4.12.1. Overview
21.4.12.2. Product Portfolio
21.4.12.3. Profitability by Market Segments (Product Type/Consumer Orientation/Nature of Product/Distribution Channel/Region)
21.4.12.4. Distribution Footprint
21.4.12.5. Strategy Overview
21.4.13. BareMinerals
21.4.13.1. Overview
21.4.13.2. Product Portfolio
21.4.13.3. Profitability by Market Segments (Product Type/Consumer Orientation/Nature of Product/Distribution Channel/Region)
21.4.13.4. Distribution Footprint
21.4.13.5. Strategy Overview
21.4.14. Kosas
21.4.14.1. Overview
21.4.14.2. Product Portfolio
21.4.14.3. Profitability by Market Segments (Product Type/Consumer Orientation/Nature of Product/Distribution Channel/Region)
21.4.14.4. Distribution Footprint
21.4.14.5. Strategy Overview
21.4.15. Others
21.4.15.1. Overview
21.4.15.2. Product Portfolio
21.4.15.3. Profitability by Market Segments (Product Type/Consumer Orientation/Nature of Product/Distribution Channel/Region)
21.4.15.4. Distribution Footprint
21.4.15.5. Strategy Overview
22. Assumptions and Acronyms Used
23. Research Methodology
Let us know your requirement to get
100% FREE customization
List of Tables
Table 1: Global Market Value (US$ Mn) Forecast, By Product Type, 2017-2032
Table 2: Global Market Volume (Units) Forecast, By Product Type, 2017-2032
Table 3: Global Market Value (US$ Mn) Forecast, By Nature of Product, 2017-2032
Table 4: Global Market Volume (Units) Forecast, By Nature of Product, 2017-2032
Table 5: Global Market Value (US$ Mn) Forecast, By Consumer Orientation, 2017-2032
Table 6: Global Market Volume (Units) Forecast, By Consumer Orientation, 2017-2032
Table 7: Global Market Value (US$ Mn) Forecast, By Distribution Channel 2017-2032
Table 8: Global Market Volume (Units) Forecast, By Distribution Channel 2017-2032
Table 9: Global Market Value (US$ Mn) Forecast, By Region, 2017-2032
Table 10: Global Market Volume (Units) Forecast, By Region, 2017-2032
Table 11: North America Market Value (US$ Mn) Forecast, By Country, 2017-2032
Table 12: North America Market Volume (Units) Forecast, By Country, 2017-2032
Table 13: North America Market Value (US$ Mn) Forecast, By Product Type, 2017-2032
Table 14: North America Market Volume (Units) Forecast, By Product Type, 2017-2032
Table 15: North America Market Value (US$ Mn) Forecast, By Nature of Product, 2017-2032
Table 16: North America Market Volume (Units) Forecast, By Nature of Product, 2017-2032
Table 17: North America Market Value (US$ Mn) Forecast, By Consumer Orientation, 2017-2032
Table 18: North America Market Volume (Units) Forecast, By Consumer Orientation, 2017-2032
Table 19: North America Market Value (US$ Mn) Forecast, By Distribution Channel 2017-2032
Table 20: North America Market Volume (Units) Forecast, By Distribution Channel 2017-2032
Table 21: Latin America Market Value (US$ Mn) Forecast, By Country, 2017-2032
Table 22: Latin America Market Volume (Units) Forecast, By Country, 2017-2032
Table 23: Latin America Market Value (US$ Mn) Forecast, By Product Type, 2017-2032
Table 24: Latin America Market Volume (Units) Forecast, By Product Type, 2017-2032
Table 25: Latin America Market Value (US$ Mn) Forecast, By Nature of Product, 2017-2032
Table 26: Latin America Market Volume (Units) Forecast, By Nature of Product, 2017-2032
Table 27: Latin America Market Value (US$ Mn) Forecast, By Consumer Orientation, 2017-2032
Table 28: Latin America Market Volume (Units) Forecast, By Consumer Orientation, 2017-2032
Table 29: Latin America Market Value (US$ Mn) Forecast, By Distribution Channel 2017-2032
Table 30: Latin America Market Volume (Units) Forecast, By Distribution Channel 2017-2032
Table 31: Europe Market Value (US$ Mn) Forecast, By Country, 2017-2032
Table 32: Europe Market Volume (Units) Forecast, By Country, 2017-2032
Table 33: Europe Market Value (US$ Mn) Forecast, By Product Type, 2017-2032
Table 34: Europe Market Volume (Units) Forecast, By Product Type, 2017-2032
Table 35: Europe Market Value (US$ Mn) Forecast, By Nature of Product, 2017-2032
Table 36: Europe Market Volume (Units) Forecast, By Nature of Product, 2017-2032
Table 37: Europe Market Value (US$ Mn) Forecast, By Consumer Orientation, 2017-2032
Table 38: Europe Market Volume (Units) Forecast, By Consumer Orientation, 2017-2032
Table 39: Europe Market Value (US$ Mn) Forecast, By Distribution Channel 2017-2032
Table 40: Europe Market Volume (Units) Forecast, By Distribution Channel 2017-2032
Table 41: East Asia Market Value (US$ Mn) Forecast, By Country, 2017-2032
Table 42: East Asia Market Volume (Units) Forecast, By Country, 2017-2032
Table 43: East Asia Market Value (US$ Mn) Forecast, By Product Type, 2017-2032
Table 44: East Asia Market Volume (Units) Forecast, By Product Type, 2017-2032
Table 45: East Asia Market Value (US$ Mn) Forecast, By Nature of Product, 2017-2032
Table 46: East Asia Market Volume (Units) Forecast, By Nature of Product, 2017-2032
Table 47: East Asia Market Value (US$ Mn) Forecast, By Consumer Orientation, 2017-2032
Table 48: East Asia Market Volume (Units) Forecast, By Consumer Orientation, 2017-2032
Table 49: East Asia Market Value (US$ Mn) Forecast, By Distribution Channel 2017-2032
Table 50: East Asia Market Volume (Units) Forecast, By Distribution Channel 2017-2032
Table 51: South Asia Market Value (US$ Mn) Forecast, By Country, 2017-2032
Table 52: South Asia Market Volume (Units) Forecast, By Country, 2017-2032
Table 53: South Asia Market Value (US$ Mn) Forecast, By Product Type, 2017-2032
Table 54: South Asia Market Volume (Units) Forecast, By Product Type, 2017-2032
Table 55: South Asia Market Value (US$ Mn) Forecast, By Nature of Product, 2017-2032
Table 56: South Asia Market Volume (Units) Forecast, By Nature of Product, 2017-2032
Table 57: South Asia Market Value (US$ Mn) Forecast, By Consumer Orientation, 2017-2032
Table 58: South Asia Market Volume (Units) Forecast, By Consumer Orientation, 2017-2032
Table 59: South Asia Market Value (US$ Mn) Forecast, By Distribution Channel 2017-2032
Table 60: South Asia Market Volume (Units) Forecast, By Distribution Channel 2017-2032
Table 61: Oceania Market Value (US$ Mn) Forecast, By Country, 2017-2032
Table 62: Oceania Market Volume (Units) Forecast, By Country, 2017-2032
Table 63: Oceania Market Value (US$ Mn) Forecast, By Product Type, 2017-2032
Table 64: Oceania Market Volume (Units) Forecast, By Product Type, 2017-2032
Table 65: Oceania Market Value (US$ Mn) Forecast, By Nature of Product, 2017-2032
Table 66: Oceania Market Volume (Units) Forecast, By Nature of Product, 2017-2032
Table 67: Oceania Market Value (US$ Mn) Forecast, By Consumer Orientation, 2017-2032
Table 68: Oceania Market Volume (Units) Forecast, By Consumer Orientation, 2017-2032
Table 69: Oceania Market Value (US$ Mn) Forecast, By Distribution Channel 2017-2032
Table 70: Oceania Market Volume (Units) Forecast, By Distribution Channel 2017-2032
Table 71: MEA Market Value (US$ Mn) Forecast, By Country, 2017-2032
Table 72: MEA Market Volume (Units) Forecast, By Country, 2017-2032
Table 73: MEA Market Value (US$ Mn) Forecast, By Product Type, 2017-2032
Table 74: MEA Market Volume (Units) Forecast, By Product Type, 2017-2032
Table 75: MEA Market Value (US$ Mn) Forecast, By Nature of Product, 2017-2032
Table 76: MEA Market Volume (Units) Forecast, By Nature of Product, 2017-2032
Table 77: MEA Market Value (US$ Mn) Forecast, By Consumer Orientation, 2017-2032
Table 78: MEA Market Volume (Units) Forecast, By Consumer Orientation, 2017-2032
Table 79: MEA Market Value (US$ Mn) Forecast, By Distribution Channel 2017-2032
Table 80: MEA Market Volume (Units) Forecast, By Distribution Channel 2017-2032
Find your sweet spots for generating winning opportunities in this market.
Talk to AnalystList of Charts
Figure 01: Global Market Value (US$ Mn) and Volume (Units) Analysis, 2017-2021
Figure 02: Global Market Value (US$ Mn) and Volume (Units) Forecast, 2022-2032
Figure 03: Global Market Value (US$ Mn) Analysis, 2017-2021
Figure 04: Global Market Value (US$ Mn) Forecast, 2022-2032
Figure 05: Global Market Absolute $ Opportunity Value (US$ Mn), 2022-2032
Figure 06: Global Market Value (US$ Mn) Analysis By Product Type, 2017-2032
Figure 07: Global Market Volume (Units) Analysis By Product Type, 2017-2032
Figure 08: Global Market Y-o-Y Growth (%) Projections, By Product Type, 2022-2032
Figure 09: Global Market Attractiveness By Product Type, 2022-2032
Figure 10: Global Market Value (US$ Mn) Analysis By Nature of Product, 2017-2032
Figure 11: Global Market Volume (Units) Analysis By Nature of Product, 2017-2032
Figure 12: Global Market Y-o-Y Growth (%) Projections, By Nature of Product, 2022-2032
Figure 13: Global Market Attractiveness By Nature of Product, 2022-2032
Figure 14: Global Market Value (US$ Mn) Analysis By Consumer Orientation, 2017-2032
Figure 15: Global Market Volume (Units) Analysis By Consumer Orientation, 2017-2032
Figure 16: Global Market Y-o-Y Growth (%) Projections, By Consumer Orientation, 2022-2032
Figure 17: Global Market Attractiveness By Consumer Orientation, 2022-2032
Figure 18: Global Market Value (US$ Mn) Analysis By Distribution Channel, 2017-2032
Figure 19: Global Market Volume (Units) Analysis By Distribution Channel, 2017-2032
Figure 20: Global Market Y-o-Y Growth (%) Projections, By Distribution Channel, 2022-2032
Figure 21: Global Market Attractiveness By Distribution Channel, 2022-2032
Figure 22: Global Market Value (US$ Mn) Analysis By Region, 2017-2032
Figure 23: Global Market Volume (Units) Analysis By Region, 2017-2032
Figure 24: Global Market Y-o-Y Growth (%) Projections, By Region, 2022-2032
Figure 25: Global Market Attractiveness By Region, 2022-2032
Figure 26: North America Market Value (US$ Mn) Analysis By Country, 2017-2032
Figure 27: North America Market Volume (Units) Analysis By Country, 2017-2032
Figure 28: North America Market Y-o-Y Growth (%) Projections, By Country, 2022-2032
Figure 29: North America Market Attractiveness By Country, 2022-2032
Figure 30: North America Market Value (US$ Mn) Analysis By Product Type, 2017-2032
Figure 31: North America Market Volume (Units) Analysis By Product Type, 2017-2032
Figure 32: North America Market Y-o-Y Growth (%) Projections, By Product Type, 2022-2032
Figure 33: North America Market Attractiveness By Product Type, 2022-2032
Figure 34: North America Market Value (US$ Mn) Analysis By Nature of Product, 2017-2032
Figure 35: North America Market Volume (Units) Analysis By Nature of Product, 2017-2032
Figure 36: North America Market Y-o-Y Growth (%) Projections, By Nature of Product, 2022-2032
Figure 37: North America Market Attractiveness By Nature of Product, 2022-2032
Figure 38: North America Market Value (US$ Mn) Analysis By Consumer Orientation, 2017-2032
Figure 39: North America Market Volume (Units) Analysis By Consumer Orientation, 2017-2032
Figure 40: North America Market Y-o-Y Growth (%) Projections, By Consumer Orientation, 2022-2032
Figure 41: North America Market Attractiveness By Consumer Orientation, 2022-2032
Figure 42: North America Market Value (US$ Mn) Analysis By Distribution Channel, 2017-2032
Figure 43: North America Market Volume (Units) Analysis By Distribution Channel, 2017-2032
Figure 44: North America Market Y-o-Y Growth (%) Projections, By Distribution Channel, 2022-2032
Figure 45: North America Market Attractiveness By Distribution Channel, 2022-2032
Figure 46: Latin America Market Value (US$ Mn) Analysis By Country, 2017-2032
Figure 47: Latin America Market Volume (Units) Analysis By Country, 2017-2032
Figure 48: Latin America Market Y-o-Y Growth (%) Projections, By Country, 2022-2032
Figure 49: Latin America Market Attractiveness By Country, 2022-2032
Figure 50: Latin America Market Value (US$ Mn) Analysis By Product Type, 2017-2032
Figure 51: Latin America Market Volume (Units) Analysis By Product Type, 2017-2032
Figure 52: Latin America Market Y-o-Y Growth (%) Projections, By Product Type, 2022-2032
Figure 53: Latin America Market Attractiveness By Product Type, 2022-2032
Figure 54: Latin America Market Value (US$ Mn) Analysis By Nature of Product, 2017-2032
Figure 55: Latin America Market Volume (Units) Analysis By Nature of Product, 2017-2032
Figure 56: Latin America Market Y-o-Y Growth (%) Projections, By Nature of Product, 2022-2032
Figure 57: Latin America Market Attractiveness By Nature of Product, 2022-2032
Figure 58: Latin America Market Value (US$ Mn) Analysis By Consumer Orientation, 2017-2032
Figure 59: Latin America Market Volume (Units) Analysis By Consumer Orientation, 2017-2032
Figure 60: Latin America Market Y-o-Y Growth (%) Projections, By Consumer Orientation, 2022-2032
Figure 61: Latin America Market Attractiveness By Consumer Orientation, 2022-2032
Figure 62: Latin America Market Value (US$ Mn) Analysis By Distribution Channel, 2017-2032
Figure 63: Latin America Market Volume (Units) Analysis By Distribution Channel, 2017-2032
Figure 64: Latin America Market Y-o-Y Growth (%) Projections, By Distribution Channel, 2022-2032
Figure 65: Latin America Market Attractiveness By Distribution Channel, 2022-2032
Figure 66: Europe Market Value (US$ Mn) Analysis By Country, 2017-2032
Figure 67: Europe Market Volume (Units) Analysis By Country, 2017-2032
Figure 68: Europe Market Y-o-Y Growth (%) Projections, By Country, 2022-2032
Figure 69: Europe Market Attractiveness By Country, 2022-2032
Figure 70: Europe Market Value (US$ Mn) Analysis By Product Type, 2017-2032
Figure 71: Europe Market Volume (Units) Analysis By Product Type, 2017-2032
Figure 72: Europe Market Y-o-Y Growth (%) Projections, By Product Type, 2022-2032
Figure 73: Europe Market Attractiveness By Product Type, 2022-2032
Figure 74: Europe Market Value (US$ Mn) Analysis By Nature of Product, 2017-2032
Figure 75: Europe Market Volume (Units) Analysis By Nature of Product, 2017-2032
Figure 76: Europe Market Y-o-Y Growth (%) Projections, By Nature of Product, 2022-2032
Figure 77: Europe Market Attractiveness By Nature of Product, 2022-2032
Figure 78: Europe Market Value (US$ Mn) Analysis By Consumer Orientation, 2017-2032
Figure 79: Europe Market Volume (Units) Analysis By Consumer Orientation, 2017-2032
Figure 80: Europe Market Y-o-Y Growth (%) Projections, By Consumer Orientation, 2022-2032
Figure 81: Europe Market Attractiveness By Consumer Orientation, 2022-2032
Figure 82: Europe Market Value (US$ Mn) Analysis By Distribution Channel, 2017-2032
Figure 83: Europe Market Volume (Units) Analysis By Distribution Channel, 2017-2032
Figure 84: Europe Market Y-o-Y Growth (%) Projections, By Distribution Channel, 2022-2032
Figure 85: Europe Market Attractiveness By Distribution Channel, 2022-2032
Figure 86: East Asia Market Value (US$ Mn) Analysis By Country, 2017-2032
Figure 87: East Asia Market Volume (Units) Analysis By Country, 2017-2032
Figure 88: East Asia Market Y-o-Y Growth (%) Projections, By Country, 2022-2032
Figure 89: East Asia Market Attractiveness By Country, 2022-2032
Figure 90: East Asia Market Value (US$ Mn) Analysis By Product Type, 2017-2032
Figure 91: East Asia Market Volume (Units) Analysis By Product Type, 2017-2032
Figure 92: East Asia Market Y-o-Y Growth (%) Projections, By Product Type, 2022-2032
Figure 93: East Asia Market Attractiveness By Product Type, 2022-2032
Figure 94: East Asia Market Value (US$ Mn) Analysis By Nature of Product, 2017-2032
Figure 95: East Asia Market Volume (Units) Analysis By Nature of Product, 2017-2032
Figure 96: East Asia Market Y-o-Y Growth (%) Projections, By Nature of Product, 2022-2032
Figure 97: East Asia Market Attractiveness By Nature of Product, 2022-2032
Figure 98: East Asia Market Value (US$ Mn) Analysis By Consumer Orientation, 2017-2032
Figure 99: East Asia Market Volume (Units) Analysis By Consumer Orientation, 2017-2032
Figure 100: East Asia Market Y-o-Y Growth (%) Projections, By Consumer Orientation, 2022-2032
Figure 101: East Asia Market Attractiveness By Consumer Orientation, 2022-2032
Figure 102: East Asia Market Value (US$ Mn) Analysis By Distribution Channel, 2017-2032
Figure 103: East Asia Market Volume (Units) Analysis By Distribution Channel, 2017-2032
Figure 104: East Asia Market Y-o-Y Growth (%) Projections, By Distribution Channel, 2022-2032
Figure 105: East Asia Market Attractiveness By Distribution Channel, 2022-2032
Figure 106: South Asia Market Value (US$ Mn) Analysis By Country, 2017-2032
Figure 107: South Asia Market Volume (Units) Analysis By Country, 2017-2032
Figure 108: South Asia Market Y-o-Y Growth (%) Projections, By Country, 2022-2032
Figure 109: South Asia Market Attractiveness By Country, 2022-2032
Figure 110: South Asia Market Value (US$ Mn) Analysis By Product Type, 2017-2032
Figure 111: South Asia Market Volume (Units) Analysis By Product Type, 2017-2032
Figure 112: South Asia Market Y-o-Y Growth (%) Projections, By Product Type, 2022-2032
Figure 113: South Asia Market Attractiveness By Product Type, 2022-2032
Figure 114: South Asia Market Value (US$ Mn) Analysis By Nature of Product, 2017-2032
Figure 115: South Asia Market Volume (Units) Analysis By Nature of Product, 2017-2032
Figure 116: South Asia Market Y-o-Y Growth (%) Projections, By Nature of Product, 2022-2032
Figure 117: South Asia Market Attractiveness By Nature of Product, 2022-2032
Figure 118: South Asia Market Value (US$ Mn) Analysis By Consumer Orientation, 2017-2032
Figure 119: South Asia Market Volume (Units) Analysis By Consumer Orientation, 2017-2032
Figure 120: South Asia Market Y-o-Y Growth (%) Projections, By Consumer Orientation, 2022-2032
Figure 121: South Asia Market Attractiveness By Consumer Orientation, 2022-2032
Figure 122: South Asia Market Value (US$ Mn) Analysis By Distribution Channel, 2017-2032
Figure 123: South Asia Market Volume (Units) Analysis By Distribution Channel, 2017-2032
Figure 124: South Asia Market Y-o-Y Growth (%) Projections, By Distribution Channel, 2022-2032
Figure 125: South Asia Market Attractiveness By Distribution Channel, 2022-2032
Figure 126: Oceania Market Value (US$ Mn) Analysis By Country, 2017-2032
Figure 127: Oceania Market Volume (Units) Analysis By Country, 2017-2032
Figure 128: Oceania Market Y-o-Y Growth (%) Projections, By Country, 2022-2032
Figure 129: Oceania Market Attractiveness By Country, 2022-2032
Figure 130: Oceania Market Value (US$ Mn) Analysis By Product Type, 2017-2032
Figure 131: Oceania Market Volume (Units) Analysis By Product Type, 2017-2032
Figure 132: Oceania Market Y-o-Y Growth (%) Projections, By Product Type, 2022-2032
Figure 133: Oceania Market Attractiveness By Product Type, 2022-2032
Figure 134: Oceania Market Value (US$ Mn) Analysis By Nature of Product, 2017-2032
Figure 135: Oceania Market Volume (Units) Analysis By Nature of Product, 2017-2032
Figure 136: Oceania Market Y-o-Y Growth (%) Projections, By Nature of Product, 2022-2032
Figure 137: Oceania Market Attractiveness By Nature of Product, 2022-2032
Figure 138: Oceania Market Value (US$ Mn) Analysis By Consumer Orientation, 2017-2032
Figure 139: Oceania Market Volume (Units) Analysis By Consumer Orientation, 2017-2032
Figure 140: Oceania Market Y-o-Y Growth (%) Projections, By Consumer Orientation, 2022-2032
Figure 141: Oceania Market Attractiveness By Consumer Orientation, 2022-2032
Figure 142: Oceania Market Value (US$ Mn) Analysis By Distribution Channel, 2017-2032
Figure 143: Oceania Market Volume (Units) Analysis By Distribution Channel, 2017-2032
Figure 144: Oceania Market Y-o-Y Growth (%) Projections, By Distribution Channel, 2022-2032
Figure 145: Oceania Market Attractiveness By Distribution Channel, 2022-2032
Figure 146: MEA Market Value (US$ Mn) Analysis By Country, 2017-2032
Figure 147: MEA Market Volume (Units) Analysis By Country, 2017-2032
Figure 148: MEA Market Y-o-Y Growth (%) Projections, By Country, 2022-2032
Figure 149: MEA Market Attractiveness By Country, 2022-2032
Figure 150: MEA Market Value (US$ Mn) Analysis By Product Type, 2017-2032
Figure 151: MEA Market Volume (Units) Analysis By Product Type, 2017-2032
Figure 152: MEA Market Y-o-Y Growth (%) Projections, By Product Type, 2022-2032
Figure 153: MEA Market Attractiveness By Product Type, 2022-2032
Figure 154: MEA Market Value (US$ Mn) Analysis By Nature of Product, 2017-2032
Figure 155: MEA Market Volume (Units) Analysis By Nature of Product, 2017-2032
Figure 156: MEA Market Y-o-Y Growth (%) Projections, By Nature of Product, 2022-2032
Figure 157: MEA Market Attractiveness By Nature of Product, 2022-2032
Figure 158: MEA Market Value (US$ Mn) Analysis By Consumer Orientation, 2017-2032
Figure 159: MEA Market Volume (Units) Analysis By Consumer Orientation, 2017-2032
Figure 160: MEA Market Y-o-Y Growth (%) Projections, By Consumer Orientation, 2022-2032
Figure 161: MEA Market Attractiveness By Consumer Orientation, 2022-2032
Figure 162: MEA Market Value (US$ Mn) Analysis By Distribution Channel, 2017-2032
Figure 163: MEA Market Volume (Units) Analysis By Distribution Channel, 2017-2032
Figure 164: MEA Market Y-o-Y Growth (%) Projections, By Distribution Channel, 2022-2032
Figure 165: MEA Market Attractiveness By Distribution Channel, 2022-2032
Need specific information?
Request CustomizationExplore Consumer Product Insights
View Reports