Reports

- Global Locations -

Headquarters

Future Market Insights, Inc.

Christiana Corporate, 200
Continental Drive, Suite 401,
Newark, Delaware - 19713,
United States

T: +1-845-579-5705

Americas

Future Market Insights, Inc.

616 Corporate Way, Suite 2-9018,
Valley Cottage, NY 10989, United States

T: +1-347-918-3531

MEA

Future Market Insights

1602-6 Jumeirah Bay X2 Tower, Plot No: JLT-PH2-X2A,
Jumeirah Lakes Towers, Dubai,
United Arab Emirates

Europe

Future Market Insights

3rd Floor, 207 Regent Street,
W1B 3HH London
United Kingdom

T: + 44 (0) 20 8123 9659
D: +44 (0) 20 3287 4268

Asia Pacific

Future Market Insights

IndiaLand Global Tech Park, Unit UG-1, Behind Grand HighStreet, Phase 1, Hinjawadi, MH, Pune – 411057, India

Premium Cosmetics Market Outlook (2023 to 2033)

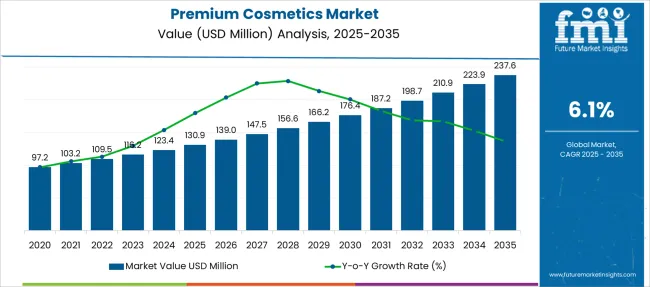
The global premium cosmetics market leads to an estimated CAGR of 6.14% in the global market during the forecast period and registers a revenue valued at US$ 116.23 Billion in 2023 and is expected to cross US$ 210.92 Billion by 2033. The growth in the market is ascribed to the following:

  • The demand for premium cosmetics is increasing owing to the changing fashion trends globally.
  • In recent years, both consumer awareness and the shift from mass-produced to luxury products have increased significantly. The greater accessibility of premium cosmetics helps fuel the market for these products with rising demand as a result of rising disposable income. The increasing digitization and commercialization of premium cosmetics through media, as well as greater online access to research premium cosmetics, have resulted in a growing market rate.
Report Attribute Details
Premium Cosmetics Market Value (2023) US$ 116.23 Billion
Premium Cosmetics Market Anticipated Value (2033) US$ 210.92 Billion
Premium Cosmetics Projected Growth Rate (2033) 6.14%

Don't pay for what you don't need

Customize your report by selecting specific countries or regions and save 30%!

Global Trends & Scopes Transforming the Premium Cosmetics Market

The industry's day-to-day operations, product development, and marketing for the companies with the best-selling prestige cosmetics line are led by key players. These players have developed an art out of knowing their consumer base as early adopters of social media platforms. They offer a bold, self-regulating method for client retention in which items are evaluated and commented on in real-time by millions of enthralled followers who demand top-performing formulations and forward-thinking trends.

Hence, the demand for premium cosmetics is likely to rise as market players emerge as the industry's first line of contact, engaging directly with social media followers and influencers to deliver cutting-edge, industry-defining items to the customer. The lipstick market has long been dominant, and the latest trend of unusual color ranges and finishes has swept the globe by storm. End users are contemplating unusual, one-of-a-kind hues such as blue, black, and neon colors, as well as various finishes such as liquid matte, metallic, glitter, opaque gloss, sheer gloss, and so on.

In recent years, the luxury cosmetics industry's principal purpose has been to highlight diversity which contributes to the global premium cosmetics market growth. This involves creating cosmetic products that are safe for persons with sensitive skin and cater to multiple skin tones and hues. As a result, the global color cosmetics sector has emphasized the importance of shaping consumer culture by balancing fashion and art.

Premium cosmetics that are customizable are also available in the market. These items include custom-blend options, which include a mixing palette and a variety of color selections to create hues based on the consumer's preferences. These are particularly developed to fit different skin tones and have become a new customer favorite. Furthermore, these cosmetics are made using technology that analyses skin tones and combines a product to perfection.

The implementation of this color-matching technology, which also allows end users to match their created colors with their clothing to meet current trends, is predicted to enhance the applications of premium cosmetics, contributing to the rise of the global premium cosmetics market growth. A lot of these premium brands also donate a portion of their revenues to various charities related to animals, children, vulnerable women, old age homes, the LGBTQIA+ community, etc.

Furthermore, luxury cosmetic manufacturers place an emphasis on product packaging. They prefer, for example, to make lipstick bullets with a push-up lid or a magnetic clasp, which provides a robust and luxurious feel and touch. These factors are projected to boost demand for high-end cosmetics. All these factors are anticipated to surge product demand and expand the global premium cosmetics market size.

Rising use of personal care and beauty products for visual appeal by the younger generation, as well as individuals checking and purchasing products online while on the go due to an increase in the usage of smartphones and rising Internet penetration, are expected to spark innovations in the premium cosmetics market trends, during the forecast period.

With many products dedicated to various physical and facial attributes, men's grooming products are dominating the market. Moreover, consumers throughout the world are gravitating toward organic personal care products as the demand for organic ingredients grows, which is likely to fuel market growth.

A Contrast with the Historical Market Scenario

The statistics accumulated by Future Market Insights reveal the global forum of premium cosmetics, which has witnessed an unprecedented surge over the past few years. The key providers in the market are in conjunction with the increasing demand for premium cosmetics. There has been a gradual rise from a CAGR of % registered during the period of 2018 to 2022, and it is likely to expand at a massive 6.14% in the forecast period.

People used to love conventional cosmetic goods like lipstick and eyeliner. However, in recent years, consumers have been more likely to purchase a cosmetic product designed for every facial feature, including the brows, nose, and jawline. The significant increase in the market size can be attributable to the rising customer desire to enhance physical characteristics using various cosmetic items.

Skin aging is increasing in tandem with the world’s aging population. According to the USA Census Bureau, more than 54 Million individuals in the country are 65 or older, accounting for around 16.5% of the total population. Consumer desire for mini-sized cosmetic goods is also increasing. Moreover, the increasing desire for men for cosmetics is also one of the market's primary development factors. Owing to these factors, the premium cosmetics market size is estimated to expand in the forecast period.

Sneha Verghese
Sneha Verghese

Principal Consultant

Talk to Analyst

Find your sweet spots for generating winning opportunities in this market.

Comparative Analysis of Adjacent Markets

Premium Cosmetics Market:

Attributes Premium Cosmetics Market
CAGR (2023 to 2033) 6.14%
Market Value (2033) US$ 210.92 Billion
Growth Factor Increased men's grooming goods, as well as increased use of personal care products by men to improve their appearance, are important factors driving the market growth.
Opportunity Increased research and development, as well as increased investment from market participants, that result in the launch of new goods, is anticipated to boost the industry's growth.
Restraints The rising attractiveness of consumers to various locally based businesses, as well as the desire for low-cost cosmetic items, has resulted in a reduced market for premium cosmetics with a decreased growth rate throughout the projection period.

Colour Cosmetics Market:

Attributes Colour Cosmetics Market
CAGR (2023 to 2033) 5%
Market Value (2033) US$ 89.80 Billion
Growth Factor The desire to maintain the newest fashion trend is predicted to boost colour cosmetics sales and inspire industry innovation.
Opportunity Use of AI-based technologies in multiple platforms and mobile applications to assess desired beauty results.
Restraints Colour cosmetics have a short shelf life, and chemical components in cosmetics can cause skin problems.

Organic Cosmetics Market:

Attributes Organic Cosmetics Market
CAGR (2023 to 2033) 9%
Market Value (2033) US$ 65.07 Billion
Growth Factor The market is expanding due to increased awareness of the benefits of organic goods and increased usage of e-commerce platforms.
Opportunity Changes in consumer behaviour and preferences for purchasing cosmetics via online platforms are expected to create enormous potential and drive industry growth.
Restraints The low shelf life of organic products, as well as the availability of advanced beauty treatments, are anticipated to function as market restraining factors for growth.

Category-wise Insights

Skincare - By Product Type

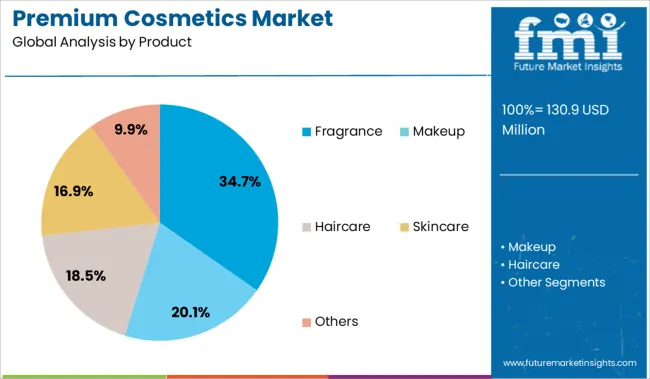
By product type, the market is segmented into fragrance, makeup, haircare, skincare, and others. It has been studied by the analysts at Future Market Insights that the skincare segment is estimated to hold a major market share, through the forecast period.

The pivotal aspects determining the momentum of this segment are:

  • This is owing to ongoing product development, which has resulted in a leadership position with greater effects of premium cosmetics decreased side effects, and reductions of acne, wrinkles, dry skin, scar, pigmentation, and age spots, which serves to drive the premium cosmetics industry.
  • Growing demand for skin-brightening products and increased use of sunscreens and body lotion are likely to contribute to the expansion of the market growth rate throughout the projection period.

Online - By Distribution Channel Type

By distribution channel type, the market is segmented into online and offline. It has been studied by the analysts at Future Market Insights that the online segment is estimated to hold a major market share, through the forecast period.

Get the data you need at a Fraction of the cost

Personalize your report by choosing insights you need
and save 40%!

The Vital Elements Determining the Momentum of this Segment are

  • Greater use of network connectivity or Wi-Fi connectivity to purchase items, as well as increased awareness about the creation of new products in cosmetics with better advantages such as price comparison and availability of offers applied through online purchase of premium cosmetics.
  • Increasing digitization and urbanization, as well as people's increasing level of living and preference for online shopping, resulted in a growing market for luxury cosmetics throughout the projection period.

Dangers of Synthetic Ingredients & Other Aspects

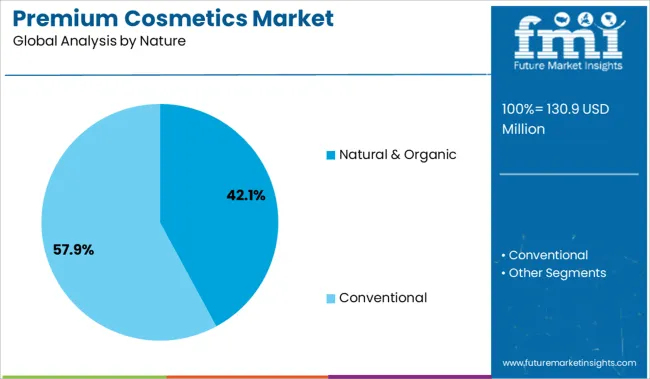
Increased awareness about the dangers of chemicals and synthetic ingredients is likely to boost the adoption of premium cosmetics. The majority of customers choose to purchase items with natural or organic labeling, which is fueling market growth. Furthermore, consumer preference is evolving away from traditional or mass-produced cosmetics and toward premium cosmetics as they become more aware of the benefits of luxury ingredients.

Digitalization is one of the primary forces expected to influence the premium cosmetics market growth. The increasing prevalence of social media and the internet serves as an important medium for brand recognition. In addition, personalization in cosmetics is a growing consumer trend, along with the production of items to satisfy individual requirements and lifestyles, in conjunction with professional services, aided by the torrent of information available online.

Premium cosmetics for conditions such as age spots, acne, and pigmentation are likely to drive the premium cosmetics market growth. In addition, the need for active components and products with proven efficacy, and the availability of a large selection of products, are increasing product sales. Additionally, consumer preferences for imported and branded cosmetics are influenced mostly by brand name, product safety, and price.

Availability of Counterfeit Products & Other Obstructions along with Future Opportunities

The availability of counterfeit cosmetic products, as well as stricter government regulations on cosmetics, are projected to impede the growth of the global premium cosmetics market growth during the forecast period. Moreover, the remarkably high cost of premium products is further expected to be a major challenge for the market.

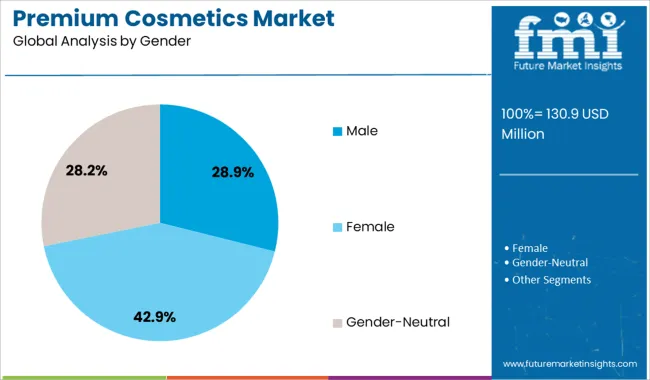
On the contrary, product variety is increasing, with gender-neutral and luxury cosmetics for males gaining momentum. In addition, brand endorsements and product placements by celebrities, as well as social media beauty influencers, are anticipated to generate creative market opportunities during the forecast period.
Region-Wise Analysis

In the USA, Market Players are now Using AI-powered Technology in Premium Beauty Products

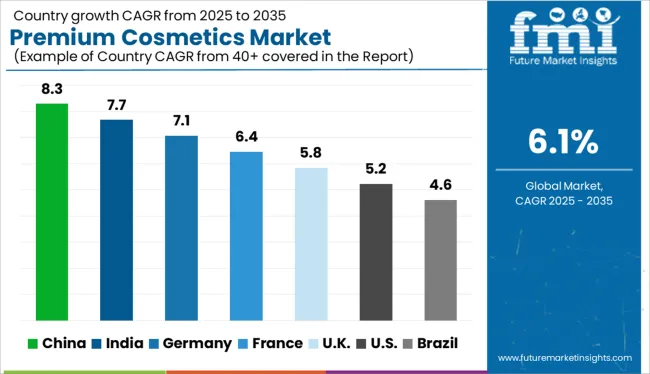
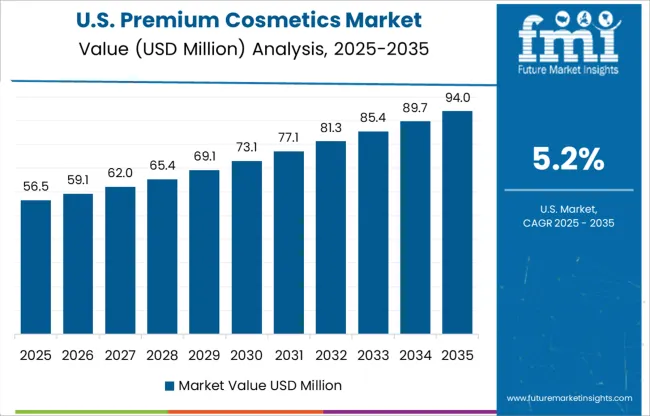
North America is the largest premium cosmetics market with remarkable potential. This is owing to the preference of most people to enhance their aesthetic appeal and the availability of innovative cosmetics and beauty products.

Furthermore, major players are providing cutting-edge cruelty-free cosmetics as animal sensitivity gains popularity. The majority of the key companies are focused on revolutionizing luxury cosmetics through revolutionary formulas, cutting-edge performance, and enticing packaging. Furthermore, they are committed to animal welfare, having developed the industry's first vegan substitute for carmine. They also collaborate with artists and cosmetic package designers to develop innovative, robust, and attractive packaging.

This region has seen the introduction of AI-powered mobile applications, which is attributable to the advancement of innovative technologies. MatchCo, for instance, is a smartphone app that allows consumers to buy bespoke foundations from the comfort of their own homes. The beauty app scans, analyses, and custom mix foundation to match each individual's skin tone. This is an all-in-one hydrating foundation (full coverage + primer + moisturizer) that nourishes the face while also providing an even skin tone.

Recently, social media influencers have been collaborating with certain premium brands. These brands achieve this by delivering PR packages, including their newest product launches, to influencers so that they may review the items before they are launched. Similarly, they may offer discount coupons affiliated with a certain influencer to their audience in exchange for endorsement and revenue.

Market Players in the United Kingdom are Formulating High-performance Cosmetics to set Global Beauty Trends!

Europe is a growing premium cosmetics market, with most of the luxury brands originating from countries such as the United Kingdom, France, Italy, and Spain. This is owing to increased awareness regarding personal care, the existence of well-established players, and the desire for online purchasing.

For decades, key players in the United Kingdom have been formulating and perfecting their product portfolio, culminating in the launch of their high-performance cosmetics while setting global beauty trends. Moreover, they further elevate the art of makeup within the fashion industry's most demanding environments, such as backstage at runway presentations for the most iconic couturiers and coveted international brands.

There are products available for consumers, whether they are looking for pure and natural cosmetics or choose to spend their money on skincare products. Key players aim to curate products that enhance the skin with brightness, moisture, and attractive bursts of color. Furthermore, consumers' preferences have shifted toward sweatproof, humidity-proof, waterproof, and transfer-resistant luxury cosmetic products, which are anticipated to generate market opportunities.

Minimal Makeup - A Riveting Concept in South Korea

South Korea is a booming market for premium cosmetics with extensive creative opportunities. Consumers in the country prefer makeup that is infused with skincare since they favor the concept of minimal makeup. Moreover, top brands use expensive ingredients to manufacture these products, which are likely to hike up their prices in the market, dubbing them as premium.

To keep their businesses relevant, premium cosmetic industry participants are heavily relying on digital marketing techniques and social media promotions. They maintain their standing in nations such as South Korea by dealing with e-commerce platforms and online shopping apps.

Cosmetics marketed in appealing and fascinating packaging are becoming increasingly popular. Customers are more inclined to purchase beauty items that have a theme linked with them, according to research. Furthermore, businesses are producing cosmetics infused with skincare elements in response to the growing demand for goods created with natural and useful ingredients.

India has witnessed a Proliferation of its e-Commerce Sector!

India is a growing premium cosmetics market with the proliferation of several new local luxury brands. Furthermore, millennials are growing increasingly concerned about the consequences of cosmetics on their skin. Moreover, their skincare and cosmetics habits affect leading manufacturers to develop creative prospects.

The proliferation of online shopping applications such as Nykaa, Purplle, HokMakeup, Amazon India, and others has expanded premium cosmetics sales in India. Furthermore, the market growth might be linked to customers' capacity to compare products across numerous distribution channels.

Since synthetic beauty cosmetics include hazardous and harsh ingredients, consumers are increasingly opting for greener options. These products are likely to be premium since the brands employ high-quality ingredients rather than artificial or synthetic additions.

New Entrants are Aiding Top Market Players with Innovative Solutions: Start-up Economy

Premium cosmetics are expanding over the world as people's desire to beautify their facial characteristics grows. Hence, the growing trend of utilizing cosmetics to improve one's appearance is generating creative chances for both leading manufacturers and start-up companies in the premium cosmetics market share to create unique formulas, and product designs, and launch e-commerce websites to sell and advertise premium products.
  • Premiumbeautynews - It is a digital media platform targeting beauty and cosmetic professionals. Publishes news and insights related to the market scenarios, regulations, science, Research and Development, product ingredient, suppliers, brands, innovation, packaging, and more from the industry. Offers e-journals and reports in its shopping section. The company also features articles from industry experts and organizes webinars for the audience. It also monetizes through display advertisements.
  • Beauty Inc. - It is an online retailer of color cosmetics. Offers cosmetic products catering to the face, eyes, lips, and nails. It also offers makeup tools and accessories such as makeup brushes. They provide brands such as Maybelline, OPI, NYX, etc. As of May 2017, does not provide international shipping.
  • The function of Beauty - It is a personal care brand founded by three MIT graduates that offer fully customizable shampoo, body wash, and skincare. For haircare, users take a quiz online on their hair goals, select a scent, and formula color, and can then elect to receive regular shipments of the product. The company recently raised $150M in Series B funding led by the private equity firm L. Catterton, which the company states it plans to use to expand its product offerings and its presence internationally.
  • Terra Moons Cosmetics - It is a Latina-owned, cruelty-free indie business that produces high-quality cosmetic products for all makeup enthusiasts. The main objective of Terra Moons Cosmetics is to create cosmetics that are both beautiful and long-lasting.
  • Winky Lux - Natalie Mackey and Nate Newman established the company to make routine beauty procedures more enjoyable. After being friends for 17 years and working in fashion, banking, and e-commerce, the two founders realized that the self-serious beauty sector needed a cheerful makeover. They set out in 2015 to build a range of items with appealing packaging that functions and is plastic and toxic-free.

Key Companies Amplifying the Premium Cosmetics Market Space & Recent Developments

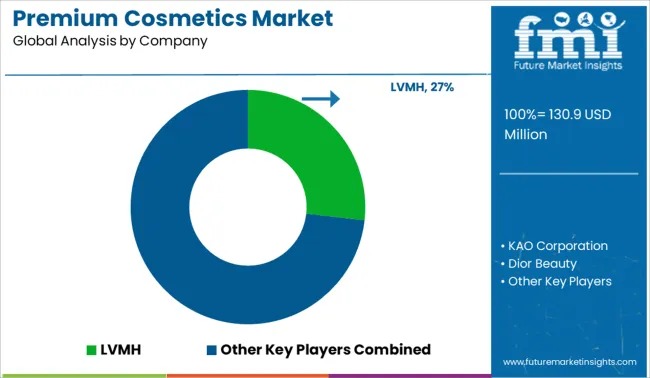
Market players in the premium cosmetics market share are introducing new product releases to extend their product portfolio. They are strengthening their global footprint through expansion strategies such as mergers, partnerships, and acquisitions. They also use digital marketing methods and social media platforms to acquire customers and develop a digital presence. To achieve a competitive advantage, some of the players are cooperating with e-commerce behemoths such as Amazon, eBay, and others.

Recent developments in the premium cosmetics market are:

  • In January 2022, the Introduction of the new beauty product by Chanel No. 1, with the improved natural look and increased sustainability of the product. The increased practices by the French Maison in the year 2022 with increased skin care products and makeup with the contribution to the eco-friendly and holistic. The developed skin care product from production, packing of the product, with natural touch-up to the skin with the use of the products on daily basis.
  • In 2018, L’Oréal acquired Stylenanda, a Makeup and fashion brand focused on millennials in South Korea and China, to extend its business in Hong Kong, Singapore, Malaysia, and Thailand. The acquisition will help the company focus on the product offerings aimed at millennials.
  • In 2016, Chanel launched a new range of nail polish; Le Vernis Longwear Nail Colour. The new collection has 16 variants and is dibutyl phthalate, formaldehyde, camphor, and toluene free.
  • In May 2022, Estée Lauder with Shoppers Stop opened an exclusive SS Beauty Store in Mumbai. With this establishment, the two companies have strengthened their partnership in India. The SS beauty store will offer only Estée Lauder brands like MAC Cosmetics, Clinique, Bobbi Brown, Jo Malone, Estee Lauder, Smashbox, and Tom Ford.
  • In July 2021, The organic skincare firm Refresh Botanicals from Canada announced the opening of its Indian store. Refresh BotanicalsTM, a natural and organic skincare brand first introduced in Canada in 2017, immediately gained popularity across Canadian and U.S. markets.
  • In 2022, Lancôme, a luxury cosmetics brand, was brought back to India by L'Oréal India. The company is considerably closer to Indian consumers than Lancôme due to the popular Advanced Génifique Youth Activating Serum, Teint Idôle Ultra Wear Foundation, and La Vie Est Belle Fragrance.

TOP MARKET PLAYERS OF THE PREMIUM COSMETICS MARKET

  • Oriflame Holding AG
  • Yves Rocher International
  • Avon Products
  • The Procter & Gamble Company
  • Elizabeth Arden Inc.
  • Dior Beauty
  • Chanel Beauty
  • Shiseido
  • L'Oreal
  • Estée Lauder
  • Coty
  • The Unilever Group
  • Maesa Ecommerce Inc.
  • Bare Essentials
  • King Kylie LLC
  • Christian Dior
  • Anastasia Beverly Hills Inc.
  • Stila Styles
  • Huda Beauty
  • MAC Cosmetics
  • Sugar Cosmetics

Key Segments Profiled in the Premium Cosmetics Market Survey

By Product:

  • Fragrance
  • Makeup
  • Haircare
  • Skincare
  • Others

By Nature:

  • Natural & Organic
  • Conventional

By Gender:

  • Male
  • Female
  • Gender-Neutral

By Distribution Channel:

  • Online
  • Offline

By Region:

  • North America
  • Latin America
  • Asia Pacific
  • Middle East and Africa(MEA)
  • Europe

Frequently Asked Questions

How much CAGR can be Approximated for the Premium Cosmetics Market?

The premium cosmetics market is anticipated to accumulate a CAGR of 6.14% during the forecast period.

What is the Major Restraint of the Premium Cosmetics Market?

The availability of counterfeit cosmetic products, as well as stricter government regulations on cosmetics.

What will be the Size of the Premium Cosmetics Market by 2033?

By 2033, the market is likely to grow to a revenue of US$ 210.92 Billion.

Table of Content

1. Executive Summary | Premium Cosmetics Market

    1.1. Global Market Outlook

    1.2. Demand-side Trends

    1.3. Supply-side Trends

    1.4. Technology Roadmap Analysis

    1.5. Analysis and Recommendations

2. Market Overview

    2.1. Market Coverage / Taxonomy

    2.2. Market Definition / Scope / Limitations

3. Market Background

    3.1. Market Dynamics

        3.1.1. Drivers

        3.1.2. Restraints

        3.1.3. Opportunity

        3.1.4. Trends

    3.2. Scenario Forecast

        3.2.1. Demand in Optimistic Scenario

        3.2.2. Demand in Likely Scenario

        3.2.3. Demand in Conservative Scenario

    3.3. Opportunity Map Analysis

    3.4. Investment Feasibility Matrix

    3.5. PESTLE and Porter’s Analysis

    3.6. Regulatory Landscape

        3.6.1. By Key Regions

        3.6.2. By Key Countries

    3.7. Regional Parent Market Outlook

4. Global Market Analysis 2018 to 2022 and Forecast, 2023 to 2033

    4.1. Historical Market Size Value (US$ Million) Analysis, 2018 to 2022

    4.2. Current and Future Market Size Value (US$ Million) Projections, 2023 to 2033

        4.2.1. Y-o-Y Growth Trend Analysis

        4.2.2. Absolute $ Opportunity Analysis

5. Global Market Analysis 2018 to 2022 and Forecast 2023 to 2033, By Product Type

    5.1. Introduction / Key Findings

    5.2. Historical Market Size Value (US$ Million) Analysis By Product Type, 2018 to 2022

    5.3. Current and Future Market Size Value (US$ Million) Analysis and Forecast By Product Type, 2023 to 2033

        5.3.1. Skin Care

        5.3.2. Hair Care

        5.3.3. Makeup

        5.3.4. Fragrance

    5.4. Y-o-Y Growth Trend Analysis By Product Type, 2018 to 2022

    5.5. Absolute $ Opportunity Analysis By Product Type, 2023 to 2033

6. Global Market Analysis 2018 to 2022 and Forecast 2023 to 2033, By Distribution Channel

    6.1. Introduction / Key Findings

    6.2. Historical Market Size Value (US$ Million) Analysis By Distribution Channel, 2018 to 2022

    6.3. Current and Future Market Size Value (US$ Million) Analysis and Forecast By Distribution Channel, 2023 to 2033

        6.3.1. Offline

        6.3.2. Online

    6.4. Y-o-Y Growth Trend Analysis By Distribution Channel, 2018 to 2022

    6.5. Absolute $ Opportunity Analysis By Distribution Channel, 2023 to 2033

7. Global Market Analysis 2018 to 2022 and Forecast 2023 to 2033, By Region

    7.1. Introduction

    7.2. Historical Market Size Value (US$ Million) Analysis By Region, 2018 to 2022

    7.3. Current Market Size Value (US$ Million) Analysis and Forecast By Region, 2023 to 2033

        7.3.1. North America

        7.3.2. Latin America

        7.3.3. Europe

        7.3.4. Asia Pacific

        7.3.5. Middle East and Africa(MEA)

    7.4. Market Attractiveness Analysis By Region

8. North America Market Analysis 2018 to 2022 and Forecast 2023 to 2033, By Country

    8.1. Historical Market Size Value (US$ Million) Trend Analysis By Market Taxonomy, 2018 to 2022

    8.2. Market Size Value (US$ Million) Forecast By Market Taxonomy, 2023 to 2033

        8.2.1. By Country

            8.2.1.1. USA

            8.2.1.2. Canada

        8.2.2. By Product Type

        8.2.3. By Distribution Channel

    8.3. Market Attractiveness Analysis

        8.3.1. By Country

        8.3.2. By Product Type

        8.3.3. By Distribution Channel

    8.4. Key Takeaways

9. Latin America Market Analysis 2018 to 2022 and Forecast 2023 to 2033, By Country

    9.1. Historical Market Size Value (US$ Million) Trend Analysis By Market Taxonomy, 2018 to 2022

    9.2. Market Size Value (US$ Million) Forecast By Market Taxonomy, 2023 to 2033

        9.2.1. By Country

            9.2.1.1. Brazil

            9.2.1.2. Mexico

            9.2.1.3. Rest of Latin America

        9.2.2. By Product Type

        9.2.3. By Distribution Channel

    9.3. Market Attractiveness Analysis

        9.3.1. By Country

        9.3.2. By Product Type

        9.3.3. By Distribution Channel

    9.4. Key Takeaways

10. Europe Market Analysis 2018 to 2022 and Forecast 2023 to 2033, By Country

    10.1. Historical Market Size Value (US$ Million) Trend Analysis By Market Taxonomy, 2018 to 2022

    10.2. Market Size Value (US$ Million) Forecast By Market Taxonomy, 2023 to 2033

        10.2.1. By Country

            10.2.1.1. Germany

            10.2.1.2. United Kingdom

            10.2.1.3. France

            10.2.1.4. Spain

            10.2.1.5. Italy

            10.2.1.6. Rest of Europe

        10.2.2. By Product Type

        10.2.3. By Distribution Channel

    10.3. Market Attractiveness Analysis

        10.3.1. By Country

        10.3.2. By Product Type

        10.3.3. By Distribution Channel

    10.4. Key Takeaways

11. Asia Pacific Market Analysis 2018 to 2022 and Forecast 2023 to 2033, By Country

    11.1. Historical Market Size Value (US$ Million) Trend Analysis By Market Taxonomy, 2018 to 2022

    11.2. Market Size Value (US$ Million) Forecast By Market Taxonomy, 2023 to 2033

        11.2.1. By Country

            11.2.1.1. China

            11.2.1.2. Japan

            11.2.1.3. South Korea

            11.2.1.4. Singapore

            11.2.1.5. Thailand

            11.2.1.6. Indonesia

            11.2.1.7. Australia

            11.2.1.8. New Zealand

            11.2.1.9. Rest of Asia Pacific

        11.2.2. By Product Type

        11.2.3. By Distribution Channel

    11.3. Market Attractiveness Analysis

        11.3.1. By Country

        11.3.2. By Product Type

        11.3.3. By Distribution Channel

    11.4. Key Takeaways

12. MEA Market Analysis 2018 to 2022 and Forecast 2023 to 2033, By Country

    12.1. Historical Market Size Value (US$ Million) Trend Analysis By Market Taxonomy, 2018 to 2022

    12.2. Market Size Value (US$ Million) Forecast By Market Taxonomy, 2023 to 2033

        12.2.1. By Country

            12.2.1.1. GCC Countries

            12.2.1.2. South Africa

            12.2.1.3. Israel

            12.2.1.4. Rest of Middle East and Africa(MEA)

        12.2.2. By Product Type

        12.2.3. By Distribution Channel

    12.3. Market Attractiveness Analysis

        12.3.1. By Country

        12.3.2. By Product Type

        12.3.3. By Distribution Channel

    12.4. Key Takeaways

13. Key Countries Market Analysis

    13.1. USA

        13.1.1. Pricing Analysis

        13.1.2. Market Share Analysis, 2021

            13.1.2.1. By Product Type

            13.1.2.2. By Distribution Channel

    13.2. Canada

        13.2.1. Pricing Analysis

        13.2.2. Market Share Analysis, 2021

            13.2.2.1. By Product Type

            13.2.2.2. By Distribution Channel

    13.3. Brazil

        13.3.1. Pricing Analysis

        13.3.2. Market Share Analysis, 2021

            13.3.2.1. By Product Type

            13.3.2.2. By Distribution Channel

    13.4. Mexico

        13.4.1. Pricing Analysis

        13.4.2. Market Share Analysis, 2021

            13.4.2.1. By Product Type

            13.4.2.2. By Distribution Channel

    13.5. Germany

        13.5.1. Pricing Analysis

        13.5.2. Market Share Analysis, 2021

            13.5.2.1. By Product Type

            13.5.2.2. By Distribution Channel

    13.6. United Kingdom

        13.6.1. Pricing Analysis

        13.6.2. Market Share Analysis, 2021

            13.6.2.1. By Product Type

            13.6.2.2. By Distribution Channel

    13.7. France

        13.7.1. Pricing Analysis

        13.7.2. Market Share Analysis, 2021

            13.7.2.1. By Product Type

            13.7.2.2. By Distribution Channel

    13.8. Spain

        13.8.1. Pricing Analysis

        13.8.2. Market Share Analysis, 2021

            13.8.2.1. By Product Type

            13.8.2.2. By Distribution Channel

    13.9. Italy

        13.9.1. Pricing Analysis

        13.9.2. Market Share Analysis, 2021

            13.9.2.1. By Product Type

            13.9.2.2. By Distribution Channel

    13.10. China

        13.10.1. Pricing Analysis

        13.10.2. Market Share Analysis, 2021

            13.10.2.1. By Product Type

            13.10.2.2. By Distribution Channel

    13.11. Japan

        13.11.1. Pricing Analysis

        13.11.2. Market Share Analysis, 2021

            13.11.2.1. By Product Type

            13.11.2.2. By Distribution Channel

    13.12. South Korea

        13.12.1. Pricing Analysis

        13.12.2. Market Share Analysis, 2021

            13.12.2.1. By Product Type

            13.12.2.2. By Distribution Channel

    13.13. Singapore

        13.13.1. Pricing Analysis

        13.13.2. Market Share Analysis, 2021

            13.13.2.1. By Product Type

            13.13.2.2. By Distribution Channel

    13.14. Thailand

        13.14.1. Pricing Analysis

        13.14.2. Market Share Analysis, 2021

            13.14.2.1. By Product Type

            13.14.2.2. By Distribution Channel

    13.15. Indonesia

        13.15.1. Pricing Analysis

        13.15.2. Market Share Analysis, 2021

            13.15.2.1. By Product Type

            13.15.2.2. By Distribution Channel

    13.16. Australia

        13.16.1. Pricing Analysis

        13.16.2. Market Share Analysis, 2021

            13.16.2.1. By Product Type

            13.16.2.2. By Distribution Channel

    13.17. New Zealand

        13.17.1. Pricing Analysis

        13.17.2. Market Share Analysis, 2021

            13.17.2.1. By Product Type

            13.17.2.2. By Distribution Channel

    13.18. GCC Countries

        13.18.1. Pricing Analysis

        13.18.2. Market Share Analysis, 2021

            13.18.2.1. By Product Type

            13.18.2.2. By Distribution Channel

    13.19. South Africa

        13.19.1. Pricing Analysis

        13.19.2. Market Share Analysis, 2021

            13.19.2.1. By Product Type

            13.19.2.2. By Distribution Channel

    13.20. Israel

        13.20.1. Pricing Analysis

        13.20.2. Market Share Analysis, 2021

            13.20.2.1. By Product Type

            13.20.2.2. By Distribution Channel

14. Market Structure Analysis

    14.1. Competition Dashboard

    14.2. Competition Benchmarking

    14.3. Market Share Analysis of Top Players

        14.3.1. By Regional

        14.3.2. By Product Type

        14.3.3. By Distribution Channel

15. Competition Analysis

    15.1. Competition Deep Dive

        15.1.1. LVMH

            15.1.1.1. Overview

            15.1.1.2. Product Portfolio

            15.1.1.3. Profitability by Market Segments

            15.1.1.4. Sales Footprint

            15.1.1.5. Strategy Overview

                15.1.1.5.1. Marketing Strategy

        15.1.2. KAO Corporation

            15.1.2.1. Overview

            15.1.2.2. Product Portfolio

            15.1.2.3. Profitability by Market Segments

            15.1.2.4. Sales Footprint

            15.1.2.5. Strategy Overview

                15.1.2.5.1. Marketing Strategy

        15.1.3. Dior Beauty

            15.1.3.1. Overview

            15.1.3.2. Product Portfolio

            15.1.3.3. Profitability by Market Segments

            15.1.3.4. Sales Footprint

            15.1.3.5. Strategy Overview

                15.1.3.5.1. Marketing Strategy

        15.1.4. Coty

            15.1.4.1. Overview

            15.1.4.2. Product Portfolio

            15.1.4.3. Profitability by Market Segments

            15.1.4.4. Sales Footprint

            15.1.4.5. Strategy Overview

                15.1.4.5.1. Marketing Strategy

        15.1.5. L’Oréal

            15.1.5.1. Overview

            15.1.5.2. Product Portfolio

            15.1.5.3. Profitability by Market Segments

            15.1.5.4. Sales Footprint

            15.1.5.5. Strategy Overview

                15.1.5.5.1. Marketing Strategy

        15.1.6. Estée Lauder

            15.1.6.1. Overview

            15.1.6.2. Product Portfolio

            15.1.6.3. Profitability by Market Segments

            15.1.6.4. Sales Footprint

            15.1.6.5. Strategy Overview

                15.1.6.5.1. Marketing Strategy

        15.1.7. Shiseido

            15.1.7.1. Overview

            15.1.7.2. Product Portfolio

            15.1.7.3. Profitability by Market Segments

            15.1.7.4. Sales Footprint

            15.1.7.5. Strategy Overview

                15.1.7.5.1. Marketing Strategy

        15.1.8. Chanel

            15.1.8.1. Overview

            15.1.8.2. Product Portfolio

            15.1.8.3. Profitability by Market Segments

            15.1.8.4. Sales Footprint

            15.1.8.5. Strategy Overview

                15.1.8.5.1. Marketing Strategy

        15.1.9. Elizabeth Arden Inc.

            15.1.9.1. Overview

            15.1.9.2. Product Portfolio

            15.1.9.3. Profitability by Market Segments

            15.1.9.4. Sales Footprint

            15.1.9.5. Strategy Overview

                15.1.9.5.1. Marketing Strategy

        15.1.10. The Procter & Gamble Company

            15.1.10.1. Overview

            15.1.10.2. Product Portfolio

            15.1.10.3. Profitability by Market Segments

            15.1.10.4. Sales Footprint

            15.1.10.5. Strategy Overview

                15.1.10.5.1. Marketing Strategy

16. Assumptions & Acronyms Used

17. Research Methodology

Don't pay for what you don't need

Customize your report by selecting specific countries or regions and save 30%!

List of Tables

Table 1: Global Market Value (US$ Million) Forecast by Region, 2018 to 2033

Table 2: Global Market Value (US$ Million) Forecast by Product Type, 2018 to 2033

Table 3: Global Market Value (US$ Million) Forecast by Distribution Channel, 2018 to 2033

Table 4: North America Market Value (US$ Million) Forecast by Country, 2018 to 2033

Table 5: North America Market Value (US$ Million) Forecast by Product Type, 2018 to 2033

Table 6: North America Market Value (US$ Million) Forecast by Distribution Channel, 2018 to 2033

Table 7: Latin America Market Value (US$ Million) Forecast by Country, 2018 to 2033

Table 8: Latin America Market Value (US$ Million) Forecast by Product Type, 2018 to 2033

Table 9: Latin America Market Value (US$ Million) Forecast by Distribution Channel, 2018 to 2033

Table 10: Europe Market Value (US$ Million) Forecast by Country, 2018 to 2033

Table 11: Europe Market Value (US$ Million) Forecast by Product Type, 2018 to 2033

Table 12: Europe Market Value (US$ Million) Forecast by Distribution Channel, 2018 to 2033

Table 13: Asia Pacific Market Value (US$ Million) Forecast by Country, 2018 to 2033

Table 14: Asia Pacific Market Value (US$ Million) Forecast by Product Type, 2018 to 2033

Table 15: Asia Pacific Market Value (US$ Million) Forecast by Distribution Channel, 2018 to 2033

Table 16: MEA Market Value (US$ Million) Forecast by Country, 2018 to 2033

Table 17: MEA Market Value (US$ Million) Forecast by Product Type, 2018 to 2033

Table 18: MEA Market Value (US$ Million) Forecast by Distribution Channel, 2018 to 2033
Sneha Verghese
Sneha Verghese

Principal Consultant

Talk to Analyst

Find your sweet spots for generating winning opportunities in this market.

List of Charts

Figure 1: Global Market Value (US$ Million) by Product Type, 2023 to 2033

Figure 2: Global Market Value (US$ Million) by Distribution Channel, 2023 to 2033

Figure 3: Global Market Value (US$ Million) by Region, 2023 to 2033

Figure 4: Global Market Value (US$ Million) Analysis by Region, 2018 to 2033

Figure 5: Global Market Value Share (%) and BPS Analysis by Region, 2023 to 2033

Figure 6: Global Market Y-o-Y Growth (%) Projections by Region, 2023 to 2033

Figure 7: Global Market Value (US$ Million) Analysis by Product Type, 2018 to 2033

Figure 8: Global Market Value Share (%) and BPS Analysis by Product Type, 2023 to 2033

Figure 9: Global Market Y-o-Y Growth (%) Projections by Product Type, 2023 to 2033

Figure 10: Global Market Value (US$ Million) Analysis by Distribution Channel, 2018 to 2033

Figure 11: Global Market Value Share (%) and BPS Analysis by Distribution Channel, 2023 to 2033

Figure 12: Global Market Y-o-Y Growth (%) Projections by Distribution Channel, 2023 to 2033

Figure 13: Global Market Attractiveness by Product Type, 2023 to 2033

Figure 14: Global Market Attractiveness by Distribution Channel, 2023 to 2033

Figure 15: Global Market Attractiveness by Region, 2023 to 2033

Figure 16: North America Market Value (US$ Million) by Product Type, 2023 to 2033

Figure 17: North America Market Value (US$ Million) by Distribution Channel, 2023 to 2033

Figure 18: North America Market Value (US$ Million) by Country, 2023 to 2033

Figure 19: North America Market Value (US$ Million) Analysis by Country, 2018 to 2033

Figure 20: North America Market Value Share (%) and BPS Analysis by Country, 2023 to 2033

Figure 21: North America Market Y-o-Y Growth (%) Projections by Country, 2023 to 2033

Figure 22: North America Market Value (US$ Million) Analysis by Product Type, 2018 to 2033

Figure 23: North America Market Value Share (%) and BPS Analysis by Product Type, 2023 to 2033

Figure 24: North America Market Y-o-Y Growth (%) Projections by Product Type, 2023 to 2033

Figure 25: North America Market Value (US$ Million) Analysis by Distribution Channel, 2018 to 2033

Figure 26: North America Market Value Share (%) and BPS Analysis by Distribution Channel, 2023 to 2033

Figure 27: North America Market Y-o-Y Growth (%) Projections by Distribution Channel, 2023 to 2033

Figure 28: North America Market Attractiveness by Product Type, 2023 to 2033

Figure 29: North America Market Attractiveness by Distribution Channel, 2023 to 2033

Figure 30: North America Market Attractiveness by Country, 2023 to 2033

Figure 31: Latin America Market Value (US$ Million) by Product Type, 2023 to 2033

Figure 32: Latin America Market Value (US$ Million) by Distribution Channel, 2023 to 2033

Figure 33: Latin America Market Value (US$ Million) by Country, 2023 to 2033

Figure 34: Latin America Market Value (US$ Million) Analysis by Country, 2018 to 2033

Figure 35: Latin America Market Value Share (%) and BPS Analysis by Country, 2023 to 2033

Figure 36: Latin America Market Y-o-Y Growth (%) Projections by Country, 2023 to 2033

Figure 37: Latin America Market Value (US$ Million) Analysis by Product Type, 2018 to 2033

Figure 38: Latin America Market Value Share (%) and BPS Analysis by Product Type, 2023 to 2033

Figure 39: Latin America Market Y-o-Y Growth (%) Projections by Product Type, 2023 to 2033

Figure 40: Latin America Market Value (US$ Million) Analysis by Distribution Channel, 2018 to 2033

Figure 41: Latin America Market Value Share (%) and BPS Analysis by Distribution Channel, 2023 to 2033

Figure 42: Latin America Market Y-o-Y Growth (%) Projections by Distribution Channel, 2023 to 2033

Figure 43: Latin America Market Attractiveness by Product Type, 2023 to 2033

Figure 44: Latin America Market Attractiveness by Distribution Channel, 2023 to 2033

Figure 45: Latin America Market Attractiveness by Country, 2023 to 2033

Figure 46: Europe Market Value (US$ Million) by Product Type, 2023 to 2033

Figure 47: Europe Market Value (US$ Million) by Distribution Channel, 2023 to 2033

Figure 48: Europe Market Value (US$ Million) by Country, 2023 to 2033

Figure 49: Europe Market Value (US$ Million) Analysis by Country, 2018 to 2033

Figure 50: Europe Market Value Share (%) and BPS Analysis by Country, 2023 to 2033

Figure 51: Europe Market Y-o-Y Growth (%) Projections by Country, 2023 to 2033

Figure 52: Europe Market Value (US$ Million) Analysis by Product Type, 2018 to 2033

Figure 53: Europe Market Value Share (%) and BPS Analysis by Product Type, 2023 to 2033

Figure 54: Europe Market Y-o-Y Growth (%) Projections by Product Type, 2023 to 2033

Figure 55: Europe Market Value (US$ Million) Analysis by Distribution Channel, 2018 to 2033

Figure 56: Europe Market Value Share (%) and BPS Analysis by Distribution Channel, 2023 to 2033

Figure 57: Europe Market Y-o-Y Growth (%) Projections by Distribution Channel, 2023 to 2033

Figure 58: Europe Market Attractiveness by Product Type, 2023 to 2033

Figure 59: Europe Market Attractiveness by Distribution Channel, 2023 to 2033

Figure 60: Europe Market Attractiveness by Country, 2023 to 2033

Figure 61: Asia Pacific Market Value (US$ Million) by Product Type, 2023 to 2033

Figure 62: Asia Pacific Market Value (US$ Million) by Distribution Channel, 2023 to 2033

Figure 63: Asia Pacific Market Value (US$ Million) by Country, 2023 to 2033

Figure 64: Asia Pacific Market Value (US$ Million) Analysis by Country, 2018 to 2033

Figure 65: Asia Pacific Market Value Share (%) and BPS Analysis by Country, 2023 to 2033

Figure 66: Asia Pacific Market Y-o-Y Growth (%) Projections by Country, 2023 to 2033

Figure 67: Asia Pacific Market Value (US$ Million) Analysis by Product Type, 2018 to 2033

Figure 68: Asia Pacific Market Value Share (%) and BPS Analysis by Product Type, 2023 to 2033

Figure 69: Asia Pacific Market Y-o-Y Growth (%) Projections by Product Type, 2023 to 2033

Figure 70: Asia Pacific Market Value (US$ Million) Analysis by Distribution Channel, 2018 to 2033

Figure 71: Asia Pacific Market Value Share (%) and BPS Analysis by Distribution Channel, 2023 to 2033

Figure 72: Asia Pacific Market Y-o-Y Growth (%) Projections by Distribution Channel, 2023 to 2033

Figure 73: Asia Pacific Market Attractiveness by Product Type, 2023 to 2033

Figure 74: Asia Pacific Market Attractiveness by Distribution Channel, 2023 to 2033

Figure 75: Asia Pacific Market Attractiveness by Country, 2023 to 2033

Figure 76: MEA Market Value (US$ Million) by Product Type, 2023 to 2033

Figure 77: MEA Market Value (US$ Million) by Distribution Channel, 2023 to 2033

Figure 78: MEA Market Value (US$ Million) by Country, 2023 to 2033

Figure 79: MEA Market Value (US$ Million) Analysis by Country, 2018 to 2033

Figure 80: MEA Market Value Share (%) and BPS Analysis by Country, 2023 to 2033

Figure 81: MEA Market Y-o-Y Growth (%) Projections by Country, 2023 to 2033

Figure 82: MEA Market Value (US$ Million) Analysis by Product Type, 2018 to 2033

Figure 83: MEA Market Value Share (%) and BPS Analysis by Product Type, 2023 to 2033

Figure 84: MEA Market Y-o-Y Growth (%) Projections by Product Type, 2023 to 2033

Figure 85: MEA Market Value (US$ Million) Analysis by Distribution Channel, 2018 to 2033

Figure 86: MEA Market Value Share (%) and BPS Analysis by Distribution Channel, 2023 to 2033

Figure 87: MEA Market Y-o-Y Growth (%) Projections by Distribution Channel, 2023 to 2033

Figure 88: MEA Market Attractiveness by Product Type, 2023 to 2033

Figure 89: MEA Market Attractiveness by Distribution Channel, 2023 to 2033

Figure 90: MEA Market Attractiveness by Country, 2023 to 2033

Recommendations

Consumer Product

Cosmetic Pencil & Pen Market

Published : January 2023

Chemicals & Materials

Cosmetic Chemicals Market

Published : June 2022

Explore Consumer Product Insights

View Reports