Premium Lager Market Size, Share and Forecast Outlook 2025 to 2035

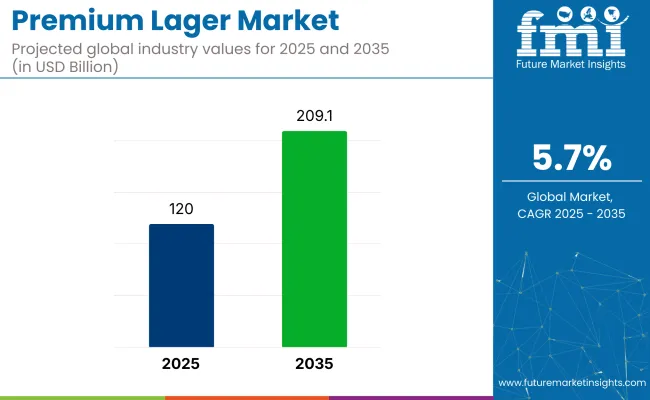
The global premium lager market is projected to increase from USD 120 billion in 2025 to USD 209.1 billion by 2035 at a CAGR of 5.7% during the forecast period. This trend is driven by the growing demand for premium and craft beers as consumers increasingly seek unique flavors, artisanal brewing, and high-quality ingredients.
Premium Lager Market Quick Stats

  • Market Value (2025): USD 120 billion
  • Industry Forecast Value (2035): USD 209.1 billion
  • Market Analysis CAGR: 5.7%
  • Leading Segment in 2035: Craft Lager (34% share)
  • Key Growth Region: Asia Pacific (India)
  • Key Players: Anheuser-Busch InBev, Heineken N.V., China Resources Snow Breweries, Molson Coors Brewing, Tsingtao Brewery Group

Premium Lager Market

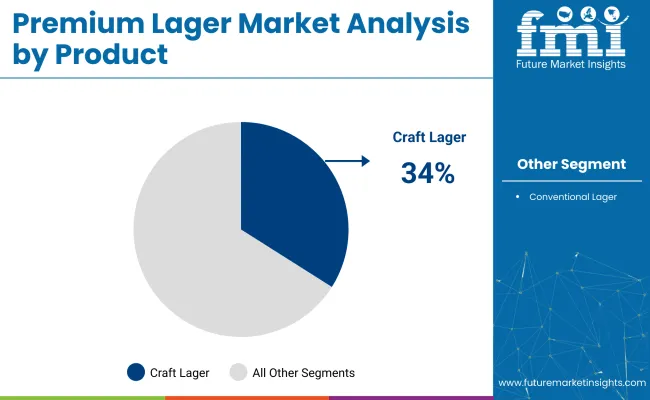
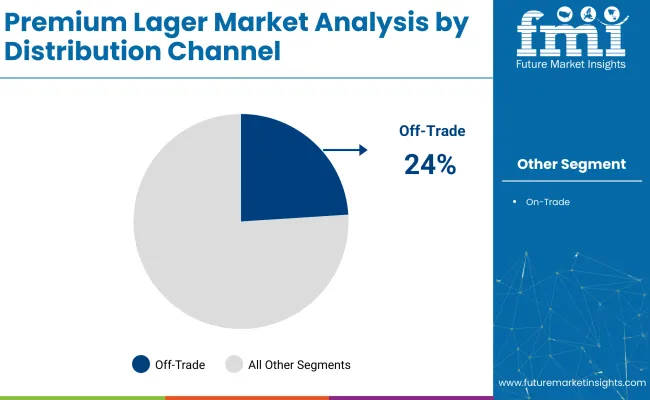
Craft lager is expected to dominate the product segment, capturing 34% of the industry share in 2025. This segment is benefitting from the rise of microbreweries and craft beer culture, with consumers seeking distinctive, locally brewed products. Additionally, off-trade distribution, which includes retail and online sales, will hold a significant share of the industry, accounting for 24% in 2025. This reflects the growing convenience of purchasing lager from supermarkets, liquor stores, and e-commerce platforms.

India, with its rapidly growing middle class and changing consumption patterns, is expected to be a key growth region. The country’s growing affinity for premium and imported alcoholic beverages is driving demand for premium lagers, with a projected CAGR of 8.4%. Asia Pacific, particularly India, presents a massive opportunity for global lager brands.

The industry remains highly competitive, with major players like Anheuser-Busch InBev, Heineken N.V., and Tsingtao Brewery Group leading the industry. As competition intensifies, these companies are expanding their product portfolios and strengthening their distribution networks to maintain industry leadership. Tsingtao Brewery collaborated with fashion brand DAWANG to launch an innovative Fall/Winter 2024 collection, merging the worlds of beer and fashion to celebrate Qingdao's rich culture and heritage.

Analyzing Premium Lager Market by Top Investment Segments

The global industry is projected to grow through 2035. In 2025, craft lager will hold 34% of the industry share, and off-trade distribution will capture 24% of the distribution segment. Key players include AB InBev, Heineken, and Carlsberg.

Craft Lager Segment Leads with 34% Industry Share

The craft lager segment is projected to capture 34% of the industry share in 2025.
  • Craft lagers are gaining significant popularity due to their unique flavors, local production, and the rising trend of artisanal and small-batch brewing.
  • As consumers increasingly seek premium, differentiated products, craft lager has emerged as a key driver in the premium beer category. Companies like Brew Dog and Stone Brewing are offering innovative recipes that highlight natural ingredients, such as locally sourced hops and malt.
  • The growth in consumer interest toward locally brewed and sustainably produced beverages is fueling craft lager’s dominance, as it aligns with the increasing demand for high-quality, artisanal beverages in the global industry.

Premium Lager Market Analysis By Product

Off-Trade Distribution Dominates with 24% Industry Share

Off-trade distribution is expected to hold 24% of the industry share in 2025.
  • Off-trade distribution method, involving retail sales through supermarkets, liquor stores, and online platforms, has been growing steadily due to the increasing popularity of exceptional lager among home consumers.
  • As more consumers purchase lager to enjoy at home, off-trade channels provide a convenient and cost-effective way to access high-quality beers. Online retailing and major supermarket chains are increasingly offering options, allowing consumers to purchase with ease.
  • This segment’s growth is also driven by the rise of specialty beer shops and online marketplaces that cater to craft beer enthusiasts and those seeking premium products, further contributing to off-trade distribution’s industry shares.

Premium Lager Market Analysis By Distribution Channel

Premium Lager Market Dynamics

The industry is expanding due to increasing consumer demand for high-quality, craft-style beers. However, high production costs and competition from global beer brands create challenges for industry growth.

Rising consumer preference for premium and craft-style beers

  • The global shift towards premium, craft-style beers is driving the growth of the industry. Consumers are increasingly looking for unique, high-quality products with distinct flavors and brewing techniques.
  • Craft beers, which include lagers, appeal to consumers seeking artisanal, locally brewed, or small-batch options. These products are perceived as offering better taste, quality, and craftsmanship compared to mass-produced beer.
  • Additionally, the growing trend of social gatherings, where consumers seek new, unique beer experiences, has further fueled demand for best lagers, particularly in regions like North America and Europe.
  • The segment is benefiting from the premiumization trend in the overall beverage industry, with consumers willing to pay more for better quality, packaging, and flavor profiles.

High production costs and competition from global beer brands

  • The production often requires high-quality ingredients, specialized brewing techniques, and longer fermentation processes, driving up production costs compared to standard lagers and mass-produced beers.
  • The industry faces strong competition from established global beer brands that dominate the beer industry. These large brands have extensive distribution networks and significant advertising budgets, making it difficult for smaller or independent breweries to gain significant industry share.
  • Additionally, global beer brands are increasingly introducing their own offerings, adding further pressure on smaller craft brewers. This competition drives price sensitivity, making it challenging for producers to maintain profitability without compromising on quality.
  • Despite these challenges, the growing demand for high-quality beer experiences continues to create opportunities for niche brewers and innovative product offerings in the segment.

Analyzing Top Countries Manufacturing, Distributing, and Supplying Premium Lager

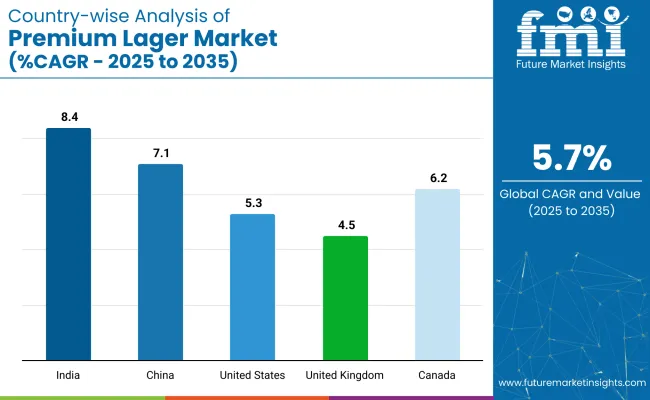
The industry is experiencing substantial growth globally, driven by increasing consumer demand for high-quality beers and evolving consumer preferences toward premium, craft, and international brews. Countries like India, China, the United States, the United Kingdom, and Canada are leading this trend, contributing significantly to the industry expansion.
Country Wise Analysis Of Premium Lager Market

Country CAGR (2025 to 2035)
India 8.4%
China 7.1%
United States 5.3%
United Kingdom 4.5%
Canada 6.2%

Analysis of Premium Lager Market in India

The industry in India is projected to grow at a CAGR of 8.4% from 2025 to 2035, driven by the growing preference for higher-quality alcoholic beverages among younger consumers.

  • The expanding middle class, urbanization, and increasing disposable incomes are contributing to the growing popularity of lager brands, particularly in urban areas.
  • As India’s beer culture evolves, there is a shift from traditional low-cost domestic beers to premium, international, and craft beers, which appeal to a more sophisticated consumer base.
  • Indian breweries, such as United Breweries (Kingfisher) and Carlsberg India, are innovating with premium offerings, while global brands like Heineken and Budweiser are expanding their market presence in response to growing demand.

Demand Forecast for Premium Lager Market in China

The industry in China is expected to grow at a CAGR of 7.1% from 2025 to 2035, driven by a shift in consumer preferences toward premium and craft beers.

  • The rise of the middle class and changing lifestyles are influencing consumer behavior, with increasing demand over traditional mass-produced beers.
  • The craft beer segment is expanding rapidly, especially in tier-1 cities like Beijing, Shanghai, and Guangzhou, where young consumers are seeking unique, high-quality lager options.
  • International brands like Asahi and Carlsberg are capitalizing on the growing demand, while domestic breweries are launching lager varieties to cater to evolving tastes.

Growth Trajectory of Premium Lager Market in the United States

The United States industry is projected to grow at a CAGR of 5.3% from 2025 to 2035, supported by the growing popularity of craft beers and the evolving demand for premium alcoholic beverages.

  • American consumers are increasingly willing to pay a premium for high-quality lagers, with craft beer experiencing significant growth across the country.
  • There is a noticeable shift from mainstream domestic beers toward premium and craft lagers that offer unique flavors and higher quality.
  • The USA industry is driven by independent craft breweries, with companies like Sierra Nevada, New Belgium, and Boston Beer Company leading the way in providing lager options to consumers.

Growth Trajectory of Premium Lager Market in the United Kingdom

The industry in the United Kingdom is expected to grow at a CAGR of 4.5% from 2025 to 2035, driven by changing consumer preferences and the increasing popularity of craft beers and international premium brands.

  • As British consumers become more discerning, there is a clear shift from mass-market lagers to premium options that offer distinctive flavors and high-quality ingredients.
  • The rise of craft beer in the UK is a significant factor in the industry's growth, with many consumers seeking craft lagers that offer a more artisanal experience.
  • International brands like Heineken and Carlsberg continue to maintain a strong presence in the sector, while local craft breweries are making significant inroads into the industry.

Premium Lager Market Growth Outlook in Canada

Canada’s industry is projected to grow at a CAGR of 6.2% from 2025 to 2035, fueled by increasing demand for higher-quality beers, particularly among younger demographics.
  • The Canadian beer industry is seeing a growing shift toward premium and craft lagers, with an increasing preference for locally brewed and unique offerings.
  • Canadian craft breweries, such as Steam Whistle Brewery and Alexander Keith’s, are tapping into the demand, offering diverse flavors and high-quality ingredients.
  • The trend toward sustainability and locally sourced ingredients is encouraging the growth, with consumers willing to pay more for beers that meet their taste preferences and ethical values.

Leading Premium Lager Suppliers

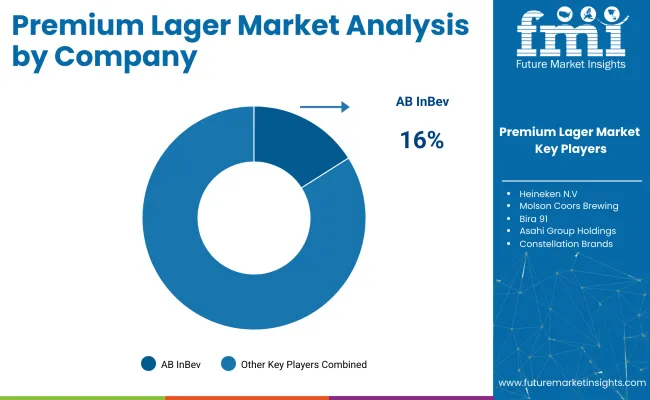
Premium Lager Market Analysis By Company

The global industry is characterized by a blend of dominant multinational corporations and emerging regional players. Prominent players include industry giants such as Anheuser-Busch InBev, Heineken N.V., China Resources Snow Breweries, Carlsberg Breweries A/S, Molson Coors Beverage Company, Tsingtao Brewery Group, Asahi Group Holdings, and Constellation Brands, who command significant industry share through their extensive portfolios and global distribution networks.

Key players comprise companies like Bira 91, B9 Beverages Pvt. Ltd., and The Beijing Yanjing Beer Group Corporation, which, while smaller in scale, have established strong regional presences and cater to niche industries. Despite the dominance of leading suppliers, the industry remains moderately fragmented, driven by the increasing demand for diverse and premium beer offerings.

Recent Premium Lager Industry News

  • Tsingtao Brewery introduced a new 24-ounce can of its Premium Lager in the USA, catering to consumers seeking larger servings for various occasions while maintaining the beer's crisp and refreshing taste.
  • Carlsberg launched a groundbreaking beer brewed with fonio, a drought-resistant West African grain, instead of traditional barley and hops, marking a significant step in sustainable brewing practices.
  • Heineken expanded its brand into the beauty industry with the launch of 'The Smootheriser,' a skin-smoothing beauty cream inspired by the smoothness of Heineken Silver beer, blending innovation with brand identity.

Leading Players

  • Anheuser-Busch InBev
  • Heineken N.V.
  • China Resources Snow Breweries
  • Molson Coors Brewing
  • Tsingtao Brewery Group
  • Bira 91
  • Asahi Group Holdings
  • Constellation Brands
  • B9 Beverages Pvt. Ltd.
  • Carlsberg Breweries A/S

Report Scope Table - Premium Lager Market

Report Attributes Key Insights
Estimated Industry Value (2025) USD 120 billion
Projected Industry Value (2035) USD 209.1 billion
CAGR (2025 to 2035) 5.7%
Base Year for Estimation 2024
Historical Period 2020 to 2024
Forecast Period 2025 to 2035
Quantitative Units Revenue in USD billion
Product Type Conventional Lager, Craft Lager
Distribution Channel Off-trade, On-trade
Region Latin America, Asia Pacific, the Middle East & Africa, North America, Europe
Countries Covered United States, Canada, Mexico, Brazil, Argentina, Germany, France, United Kingdom, Italy, Spain, Netherlands, China, India, Japan, South Korea, ANZ, GCC Countries, South Africa
Key Players Anheuser-Busch InBev , Heineken N.V., China Resources Snow Breweries, Molson Coors Brewing, Tsingtao Brewery Group, Bira 91, Asahi Group Holdings, Constellation Brands, B9 Beverages Pvt. Ltd., Carlsberg Breweries A/S
Additional Attributes Dollar sales rising with craft lager segment, consumer preference shifting towards premium offerings, growth in global demand for craft beer, off-trade sales driving industry growth, premiumization trend accelerating

Premium Lager Market Analyzed by Key Investment Segments

By Product:

Conventional lager and craft lager.

By Distribution Channel:

Off-trade and on-trade.

By Region:

North America, Latin America, Western Europe, Eastern Europe, East Asia, South Asia, Middle East and Africa (MEA).

Table of Content

  1. Executive Summary
    • Global Market Outlook
    • Demand-side Trends
    • Supply-side Trends
    • Technology Roadmap Analysis
    • Analysis and Recommendations
  2. Market Overview
    • Market Coverage / Taxonomy
    • Market Definition / Scope / Limitations
  3. Market Background
    • Market Dynamics
      • Drivers
      • Restraints
      • Opportunity
      • Trends
    • Scenario Forecast
      • Demand in Optimistic Scenario
      • Demand in Likely Scenario
      • Demand in Conservative Scenario
    • Opportunity Map Analysis
    • Product Life Cycle Analysis
    • Supply Chain Analysis
      • Supply Side Participants and their Roles
        • Producers
        • Mid-Level Participants (Traders/ Agents/ Brokers)
        • Wholesalers and Distributors
      • Value Added and Value Created at Node in the Supply Chain
      • List of Raw Material Suppliers
      • List of Existing and Potential Buyer’s
    • Investment Feasibility Matrix
    • Value Chain Analysis
      • Profit Margin Analysis
      • Wholesalers and Distributors
      • Retailers
    • PESTLE and Porter’s Analysis
    • Regulatory Landscape
      • By Key Regions
      • By Key Countries
    • Regional Parent Market Outlook
    • Production and Consumption Statistics
    • Import and Export Statistics
  4. Global Market Analysis 2020 to 2024 and Forecast, 2025 to 2035
    • Historical Market Size Value (USD Billion) & Volume (sq. ft.) Analysis, 2020 to 2024
    • Current and Future Market Size Value (USD Billion) & Volume (sq. ft.) Projections, 2025 to 2035
      • Y-o-Y Growth Trend Analysis
      • Absolute $ Opportunity Analysis
  5. Global Market Pricing Analysis 2020 to 2024 and Forecast 2025 to 2035
  6. Global Market Analysis 2020 to 2024 and Forecast 2025 to 2035, By Product
    • Introduction / Key Findings
    • Historical Market Size Value (USD Billion) & Volume (sq. ft.) Analysis By Product, 2020 to 2024
    • Current and Future Market Size Value (USD Billion) & Volume (sq. ft.) Analysis and Forecast By Product, 2025 to 2035
      • Conventional Lager
      • Craft Lager
    • Y-o-Y Growth Trend Analysis By Product, 2020 to 2024
    • Absolute $ Opportunity Analysis By Product, 2025 to 2035
  7. Global Market Analysis 2020 to 2024 and Forecast 2025 to 2035, By Distribution Channel
    • Introduction / Key Findings
    • Historical Market Size Value (USD Billion) & Volume (sq. ft.) Analysis By Distribution Channel, 2020 to 2024
    • Current and Future Market Size Value (USD Billion) & Volume (sq. ft.) Analysis and Forecast By Distribution Channel, 2025 to 2035
      • Off-Trade
      • On-Trade
    • Y-o-Y Growth Trend Analysis By Distribution Channel, 2020 to 2024
    • Absolute $ Opportunity Analysis By Distribution Channel, 2025 to 2035
  8. Global Market Analysis 2020 to 2024 and Forecast 2025 to 2035, By Region
    • Introduction
    • Historical Market Size Value (USD Billion) & Volume (sq. ft.) Analysis By Region, 2020 to 2024
    • Current Market Size Value (USD Billion) & Volume (sq. ft.) Analysis and Forecast By Region, 2025 to 2035
      • North America
      • Latin America
      • Western Europe
      • Eastern Europe
      • East Asia
      • South Asia & Pacific
      • Middle East and Africa
    • Market Attractiveness Analysis By Region
  9. North America Market Analysis 2020 to 2024 and Forecast 2025 to 2035, By Country
    • Historical Market Size Value (USD Billion) & Volume (sq. ft.) Trend Analysis By Market Taxonomy, 2020 to 2024
    • Market Size Value (USD Billion) & Volume (sq. ft.) Forecast By Market Taxonomy, 2025 to 2035
      • By Country
        • USA
        • Canada
        • Mexico
      • By Product
      • By Distribution Channel
    • Market Attractiveness Analysis
      • By Country
      • By Product
      • By Distribution Channel
    • Key Takeaways
  10. Latin America Market Analysis 2020 to 2024 and Forecast 2025 to 2035, By Country
    • Historical Market Size Value (USD Billion) & Volume (sq. ft.) Trend Analysis By Market Taxonomy, 2020 to 2024
    • Market Size Value (USD Billion) & Volume (sq. ft.) Forecast By Market Taxonomy, 2025 to 2035
      • By Country
        • Brazil
        • Argentina
        • Rest of LATAM
      • By Product
      • By Distribution Channel
    • Market Attractiveness Analysis
      • By Country
      • By Product
      • By Distribution Channel
    • Key Takeaways
  11. Western Europe Market Analysis 2020 to 2024 and Forecast 2025 to 2035, By Country
    • Historical Market Size Value (USD Billion) & Volume (sq. ft.) Trend Analysis By Market Taxonomy, 2020 to 2024
    • Market Size Value (USD Billion) & Volume (sq. ft.) Forecast By Market Taxonomy, 2025 to 2035
      • By Country
        • Germany
        • Italy
        • France
        • UK
        • Spain
        • BENELUX
        • Nordic
        • Rest of W.Europe
      • By Product
      • By Distribution Channel
    • Market Attractiveness Analysis
      • By Country
      • By Product
      • By Distribution Channel
    • Key Takeaways
  12. Eastern Europe Market Analysis 2020 to 2024 and Forecast 2025 to 2035, By Country
    • Historical Market Size Value (USD Billion) & Volume (sq. ft.) Trend Analysis By Market Taxonomy, 2020 to 2024
    • Market Size Value (USD Billion) & Volume (sq. ft.) Forecast By Market Taxonomy, 2025 to 2035
      • By Country
        • Russia
        • Hungary
        • Poland
        • Balkan & Baltics
        • Rest of E. Europe
      • By Product
      • By Distribution Channel
    • Market Attractiveness Analysis
      • By Country
      • By Product
      • By Distribution Channel
    • Key Takeaways
  13. East Asia Market Analysis 2020 to 2024 and Forecast 2025 to 2035, By Country
    • Historical Market Size Value (USD Billion) & Volume (sq. ft.) Trend Analysis By Market Taxonomy, 2020 to 2024
    • Market Size Value (USD Billion) & Volume (sq. ft.) Forecast By Market Taxonomy, 2025 to 2035
      • By Country
        • China
        • Japan
        • South Korea
      • By Product
      • By Distribution Channel
    • Market Attractiveness Analysis
      • By Country
      • By Product
      • By Distribution Channel
    • Key Takeaways
  14. South Asia & Pacific Market Analysis 2020 to 2024 and Forecast 2025 to 2035, By Country
    • Historical Market Size Value (USD Billion) & Volume (sq. ft.) Trend Analysis By Market Taxonomy, 2020 to 2024
    • Market Size Value (USD Billion) & Volume (sq. ft.) Forecast By Market Taxonomy, 2025 to 2035
      • By Country
        • India
        • Australia & New Zealand
        • ASEAN
        • Rest of SAP
      • By Product
      • By Distribution Channel
    • Market Attractiveness Analysis
      • By Country
      • By Product
      • By Distribution Channel
    • Key Takeaways
  15. Middle East and Africa Market Analysis 2020 to 2024 and Forecast 2025 to 2035, By Country
    • Historical Market Size Value (USD Billion) & Volume (sq. ft.) Trend Analysis By Market Taxonomy, 2020 to 2024
    • Market Size Value (USD Billion) & Volume (sq. ft.) Forecast By Market Taxonomy, 2025 to 2035
      • By Country
        • GCC Countries
        • Northern Africa
        • South Africa
        • Turkiye
        • Rest of MEA
      • By Product
      • By Distribution Channel
    • Market Attractiveness Analysis
      • By Country
      • By Product
      • By Distribution Channel
    • Key Takeaways
  16. Key Countries Market Analysis
    • USA
      • Pricing Analysis
      • Market Share Analysis, 2024
        • By Product
        • By Distribution Channel
    • Canada
      • Pricing Analysis
      • Market Share Analysis, 2024
        • By Product
        • By Distribution Channel
    • Brazil
      • Pricing Analysis
      • Market Share Analysis, 2024
        • By Product
        • By Distribution Channel
    • Mexico
      • Pricing Analysis
      • Market Share Analysis, 2024
        • By Product
        • By Distribution Channel
    • Argentina
      • Pricing Analysis
      • Market Share Analysis, 2024
        • By Product
        • By Distribution Channel
  17. Market Structure Analysis
    • Competition Dashboard
    • Competition Benchmarking
    • Market Share Analysis of Top Players
      • By Regional
      • By Product
      • By Distribution Channel
  18. Competition Analysis
  19. Competition Deep Dive
    • Anheuser-Busch InBev
      • Overview
      • Product Portfolio
      • Profitability by Market Segments (Product/Age /Sales Channel/Region)
      • Sales Footprint
      • Strategy Overview
        • Marketing Strategy
        • Product Strategy
        • Channel Strategy
    • Heineken N.V.
      • Overview
      • Product Portfolio
      • Profitability by Market Segments (Product/Age /Sales Channel/Region)
      • Sales Footprint
      • Strategy Overview
        • Marketing Strategy
        • Product Strategy
        • Channel Strategy
    • China Resources Snow Breweries
      • Overview
      • Product Portfolio
      • Profitability by Market Segments (Product/Age /Sales Channel/Region)
      • Sales Footprint
      • Strategy Overview
        • Marketing Strategy
        • Product Strategy
        • Channel Strategy
    • Molson Coors Brewing
      • Overview
      • Product Portfolio
      • Profitability by Market Segments (Product/Age /Sales Channel/Region)
      • Sales Footprint
      • Strategy Overview
        • Marketing Strategy
        • Product Strategy
        • Channel Strategy
    • Tsingtao Brewery Group
      • Overview
      • Product Portfolio
      • Profitability by Market Segments (Product/Age /Sales Channel/Region)
      • Sales Footprint
      • Strategy Overview
        • Marketing Strategy
        • Product Strategy
        • Channel Strategy
    • Bira 91
      • Overview
      • Product Portfolio
      • Profitability by Market Segments (Product/Age /Sales Channel/Region)
      • Sales Footprint
      • Strategy Overview
        • Marketing Strategy
        • Product Strategy
        • Channel Strategy
    • Asahi Group Holdings
      • Overview
      • Product Portfolio
      • Profitability by Market Segments (Product/Age /Sales Channel/Region)
      • Sales Footprint
      • Strategy Overview
        • Marketing Strategy
        • Product Strategy
        • Channel Strategy
    • Constellation Brands
      • Overview
      • Product Portfolio
      • Profitability by Market Segments (Product/Age /Sales Channel/Region)
      • Sales Footprint
      • Strategy Overview
        • Marketing Strategy
        • Product Strategy
        • Channel Strategy
    • B9 Beverages Pvt. Ltd.
      • Overview
      • Product Portfolio
      • Profitability by Market Segments (Product/Age /Sales Channel/Region)
      • Sales Footprint
      • Strategy Overview
        • Marketing Strategy
        • Product Strategy
        • Channel Strategy
    • Carlsberg Breweries A/S
      • Overview
      • Product Portfolio
      • Profitability by Market Segments (Product/Age /Sales Channel/Region)
      • Sales Footprint
      • Strategy Overview
        • Marketing Strategy
        • Product Strategy
        • Channel Strategy
  20. Assumptions & Acronyms Used
  21. Research Methodology

List of Tables

  • Table 1: Global Market Value (USD Billion) Forecast by Region, 2020 to 2035
  • Table 2: Global Market Volume (sq. ft.) Forecast by Region, 2020 to 2035
  • Table 3: Global Market Value (USD Billion) Forecast by Product, 2020 to 2035
  • Table 4: Global Market Volume (sq. ft.) Forecast by Product, 2020 to 2035
  • Table 5: Global Market Value (USD Billion) Forecast by Distribution Channel, 2020 to 2035
  • Table 6: Global Market Volume (sq. ft.) Forecast by Distribution Channel, 2020 to 2035
  • Table 7: North America Market Value (USD Billion) Forecast by Country, 2020 to 2035
  • Table 8: North America Market Volume (sq. ft.) Forecast by Country, 2020 to 2035
  • Table 9: North America Market Value (USD Billion) Forecast by Product, 2020 to 2035
  • Table 10: North America Market Volume (sq. ft.) Forecast by Product, 2020 to 2035
  • Table 11: North America Market Value (USD Billion) Forecast by Distribution Channel, 2020 to 2035
  • Table 12: North America Market Volume (sq. ft.) Forecast by Distribution Channel, 2020 to 2035
  • Table 13: Latin America Market Value (USD Billion) Forecast by Country, 2020 to 2035
  • Table 14: Latin America Market Volume (sq. ft.) Forecast by Country, 2020 to 2035
  • Table 15: Latin America Market Value (USD Billion) Forecast by Product, 2020 to 2035
  • Table 16: Latin America Market Volume (sq. ft.) Forecast by Product, 2020 to 2035
  • Table 17: Latin America Market Value (USD Billion) Forecast by Distribution Channel, 2020 to 2035
  • Table 18: Latin America Market Volume (sq. ft.) Forecast by Distribution Channel, 2020 to 2035
  • Table 19: Western Europe Market Value (USD Billion) Forecast by Country, 2020 to 2035
  • Table 20: Western Europe Market Volume (sq. ft.) Forecast by Country, 2020 to 2035
  • Table 21: Western Europe Market Value (USD Billion) Forecast by Product, 2020 to 2035
  • Table 22: Western Europe Market Volume (sq. ft.) Forecast by Product, 2020 to 2035
  • Table 23: Western Europe Market Value (USD Billion) Forecast by Distribution Channel, 2020 to 2035
  • Table 24: Western Europe Market Volume (sq. ft.) Forecast by Distribution Channel, 2020 to 2035
  • Table 25: Eastern Europe Market Value (USD Billion) Forecast by Country, 2020 to 2035
  • Table 26: Eastern Europe Market Volume (sq. ft.) Forecast by Country, 2020 to 2035
  • Table 27: Eastern Europe Market Value (USD Billion) Forecast by Product, 2020 to 2035
  • Table 28: Eastern Europe Market Volume (sq. ft.) Forecast by Product, 2020 to 2035
  • Table 29: Eastern Europe Market Value (USD Billion) Forecast by Distribution Channel, 2020 to 2035
  • Table 30: Eastern Europe Market Volume (sq. ft.) Forecast by Distribution Channel, 2020 to 2035
  • Table 31: East Asia Market Value (USD Billion) Forecast by Country, 2020 to 2035
  • Table 32: East Asia Market Volume (sq. ft.) Forecast by Country, 2020 to 2035
  • Table 33: East Asia Market Value (USD Billion) Forecast by Product, 2020 to 2035
  • Table 34: East Asia Market Volume (sq. ft.) Forecast by Product, 2020 to 2035
  • Table 35: East Asia Market Value (USD Billion) Forecast by Distribution Channel, 2020 to 2035
  • Table 36: East Asia Market Volume (sq. ft.) Forecast by Distribution Channel, 2020 to 2035
  • Table 37: South Asia & Pacific Market Value (USD Billion) Forecast by Country, 2020 to 2035
  • Table 38: South Asia & Pacific Market Volume (sq. ft.) Forecast by Country, 2020 to 2035
  • Table 39: South Asia & Pacific Market Value (USD Billion) Forecast by Product, 2020 to 2035
  • Table 40: South Asia & Pacific Market Volume (sq. ft.) Forecast by Product, 2020 to 2035
  • Table 41: South Asia & Pacific Market Value (USD Billion) Forecast by Distribution Channel, 2020 to 2035
  • Table 42: South Asia & Pacific Market Volume (sq. ft.) Forecast by Distribution Channel, 2020 to 2035
  • Table 43: Middle East and Africa Market Value (USD Billion) Forecast by Country, 2020 to 2035
  • Table 44: Middle East and Africa Market Volume (sq. ft.) Forecast by Country, 2020 to 2035
  • Table 45: Middle East and Africa Market Value (USD Billion) Forecast by Product, 2020 to 2035
  • Table 46: Middle East and Africa Market Volume (sq. ft.) Forecast by Product, 2020 to 2035
  • Table 47: Middle East and Africa Market Value (USD Billion) Forecast by Distribution Channel, 2020 to 2035
  • Table 48: Middle East and Africa Market Volume (sq. ft.) Forecast by Distribution Channel, 2020 to 2035

List of Figures

  • Figure 1: Global Market Volume (sq. ft.) Forecast 2020 to 2035
  • Figure 2: Global Market Pricing Analysis
  • Figure 3: Global Market Value (USD Billion) Forecast 2020 to 2035
  • Figure 4: Global Market Value Share and BPS Analysis by Product, 2025 and 2035
  • Figure 5: Global Market Y-o-Y Growth Comparison by Product, 2025 to 2035
  • Figure 6: Global Market Attractiveness Analysis by Product
  • Figure 7: Global Market Value Share and BPS Analysis by Distribution Channel, 2025 and 2035
  • Figure 8: Global Market Y-o-Y Growth Comparison by Distribution Channel, 2025 to 2035
  • Figure 9: Global Market Attractiveness Analysis by Distribution Channel
  • Figure 10: Global Market Value (USD Billion) Share and BPS Analysis by Region, 2025 and 2035
  • Figure 11: Global Market Y-o-Y Growth Comparison by Region, 2025 to 2035
  • Figure 12: Global Market Attractiveness Analysis by Region
  • Figure 13: North America Market Incremental $ Opportunity, 2025 to 2035
  • Figure 14: Latin America Market Incremental $ Opportunity, 2025 to 2035
  • Figure 15: Western Europe Market Incremental $ Opportunity, 2025 to 2035
  • Figure 16: Eastern Europe Market Incremental $ Opportunity, 2025 to 2035
  • Figure 17: East Asia Market Incremental $ Opportunity, 2025 to 2035
  • Figure 18: South Asia & Pacific Market Incremental $ Opportunity, 2025 to 2035
  • Figure 19: Middle East and Africa Market Incremental $ Opportunity, 2025 to 2035
  • Figure 20: North America Market Value Share and BPS Analysis by Country, 2025 and 2035
  • Figure 21: North America Market Value Share and BPS Analysis by Product, 2025 and 2035
  • Figure 22: North America Market Y-o-Y Growth Comparison by Product, 2025 to 2035
  • Figure 23: North America Market Attractiveness Analysis by Product
  • Figure 24: North America Market Value Share and BPS Analysis by Distribution Channel, 2025 and 2035
  • Figure 25: North America Market Y-o-Y Growth Comparison by Distribution Channel, 2025 to 2035
  • Figure 26: North America Market Attractiveness Analysis by Distribution Channel
  • Figure 27: Latin America Market Value Share and BPS Analysis by Country, 2025 and 2035
  • Figure 28: Latin America Market Value Share and BPS Analysis by Product, 2025 and 2035
  • Figure 29: Latin America Market Y-o-Y Growth Comparison by Product, 2025 to 2035
  • Figure 30: Latin America Market Attractiveness Analysis by Product
  • Figure 31: Latin America Market Value Share and BPS Analysis by Distribution Channel, 2025 and 2035
  • Figure 32: Latin America Market Y-o-Y Growth Comparison by Distribution Channel, 2025 to 2035
  • Figure 33: Latin America Market Attractiveness Analysis by Distribution Channel
  • Figure 34: Western Europe Market Value Share and BPS Analysis by Country, 2025 and 2035
  • Figure 35: Western Europe Market Value Share and BPS Analysis by Product, 2025 and 2035
  • Figure 36: Western Europe Market Y-o-Y Growth Comparison by Product, 2025 to 2035
  • Figure 37: Western Europe Market Attractiveness Analysis by Product
  • Figure 38: Western Europe Market Value Share and BPS Analysis by Distribution Channel, 2025 and 2035
  • Figure 39: Western Europe Market Y-o-Y Growth Comparison by Distribution Channel, 2025 to 2035
  • Figure 40: Western Europe Market Attractiveness Analysis by Distribution Channel
  • Figure 41: Eastern Europe Market Value Share and BPS Analysis by Country, 2025 and 2035
  • Figure 42: Eastern Europe Market Value Share and BPS Analysis by Product, 2025 and 2035
  • Figure 43: Eastern Europe Market Y-o-Y Growth Comparison by Product, 2025 to 2035
  • Figure 44: Eastern Europe Market Attractiveness Analysis by Product
  • Figure 45: Eastern Europe Market Value Share and BPS Analysis by Distribution Channel, 2025 and 2035
  • Figure 46: Eastern Europe Market Y-o-Y Growth Comparison by Distribution Channel, 2025 to 2035
  • Figure 47: Eastern Europe Market Attractiveness Analysis by Distribution Channel
  • Figure 48: East Asia Market Value Share and BPS Analysis by Country, 2025 and 2035
  • Figure 49: East Asia Market Value Share and BPS Analysis by Product, 2025 and 2035
  • Figure 50: East Asia Market Y-o-Y Growth Comparison by Product, 2025 to 2035
  • Figure 51: East Asia Market Attractiveness Analysis by Product
  • Figure 52: East Asia Market Value Share and BPS Analysis by Distribution Channel, 2025 and 2035
  • Figure 53: East Asia Market Y-o-Y Growth Comparison by Distribution Channel, 2025 to 2035
  • Figure 54: East Asia Market Attractiveness Analysis by Distribution Channel
  • Figure 55: South Asia & Pacific Market Value Share and BPS Analysis by Country, 2025 and 2035
  • Figure 56: South Asia & Pacific Market Value Share and BPS Analysis by Product, 2025 and 2035
  • Figure 57: South Asia & Pacific Market Y-o-Y Growth Comparison by Product, 2025 to 2035
  • Figure 58: South Asia & Pacific Market Attractiveness Analysis by Product
  • Figure 59: South Asia & Pacific Market Value Share and BPS Analysis by Distribution Channel, 2025 and 2035
  • Figure 60: South Asia & Pacific Market Y-o-Y Growth Comparison by Distribution Channel, 2025 to 2035
  • Figure 61: South Asia & Pacific Market Attractiveness Analysis by Distribution Channel
  • Figure 62: Middle East and Africa Market Value Share and BPS Analysis by Country, 2025 and 2035
  • Figure 63: Middle East and Africa Market Value Share and BPS Analysis by Product, 2025 and 2035
  • Figure 64: Middle East and Africa Market Y-o-Y Growth Comparison by Product, 2025 to 2035
  • Figure 65: Middle East and Africa Market Attractiveness Analysis by Product
  • Figure 66: Middle East and Africa Market Value Share and BPS Analysis by Distribution Channel, 2025 and 2035
  • Figure 67: Middle East and Africa Market Y-o-Y Growth Comparison by Distribution Channel, 2025 to 2035
  • Figure 68: Middle East and Africa Market Attractiveness Analysis by Distribution Channel
  • Figure 69: Global Market - Tier Structure Analysis
  • Figure 70: Global Market - Company Share Analysis

Frequently Asked Questions

What is the projected industry value of the premium lager market in 2025?

The industry is projected to reach USD 120 billion in 2025.

What is the forecast industry value of the premium lager market by 2035?

The industry is expected to grow to USD 209.1 billion by 2035.

What is the expected CAGR for the premium lager market from 2025 to 2035?

The industry is expected to grow at a CAGR of 5.7% from 2025 to 2035.

Which product will dominate the premium lager market in 2025?

Craft lager is projected to dominate, holding a 34% industry share in 2025.

Which region is expected to experience the highest growth in the premium lager market?

India is forecasted to be the fastest-growing industry with an 8.4% CAGR.

Explore Similar Insights

Future Market Insights

Premium Lager Market