Premium Packaging Market Size, Share, and Forecast Outlook 2025 to 2035

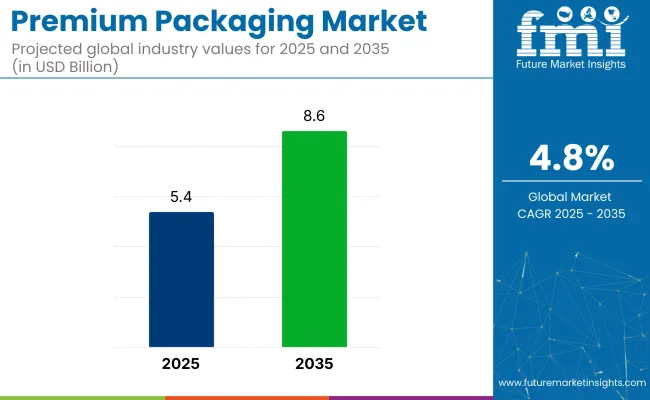
Premium packaging market is projected to grow from USD 5.4 billion in 2025 to USD 8.6 billion by 2035, expanding at a CAGR of 4.8%. Increased preference for distinctive, high-quality packaging that enhances product value is shaping demand across luxury goods, cosmetics, food, beverages, and pharmaceuticals.
Quick Stats of Premium Packaging Market

  • Market Value (2025): USD 5.4 billion
  • Forecast Value (2035): USD 8.6 billion
  • Forecast CAGR: 4.8%
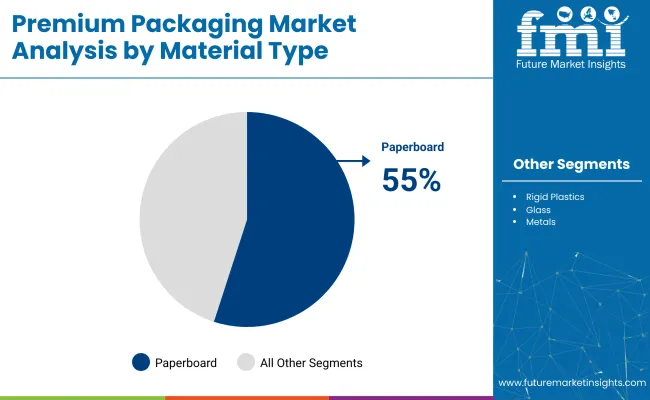
  • Top Material Type in 2025: Paperboard (55% industry share)
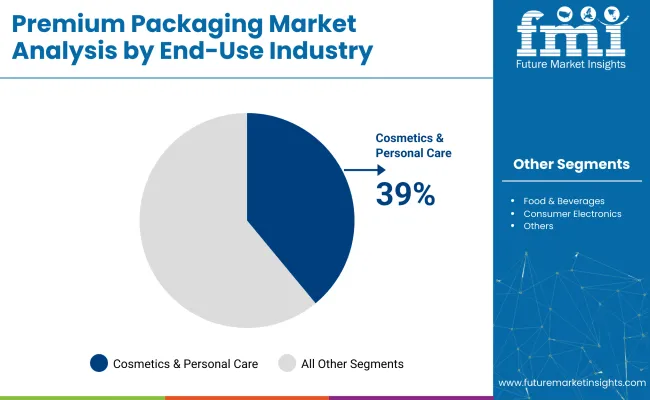
  • Leading End-Use Industry: Cosmetics & Personal Care (39% industry share)
  • Top Distribution Channel: Luxury Retail Stores & E-commerce (60% share)
  • Key Growth Region: China (5.6% CAGR)
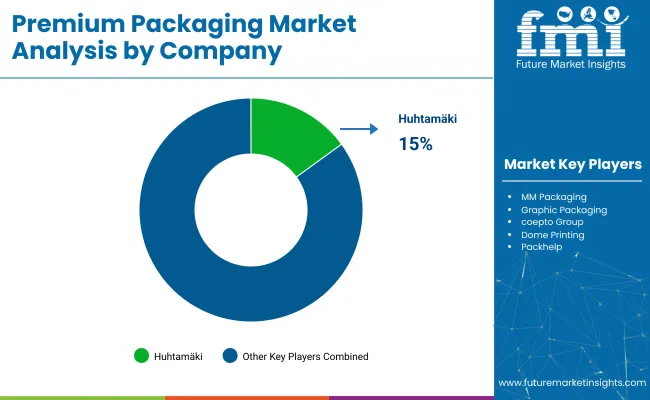
  • Leading Player: Huhtamäki (15% industry share)

Premium Packaging Market

Attribute Detail
Industry Size (2025) USD 5.4 billion
Industry Size (2035) USD 8.6 billion
CAGR (2025 to 2035) 4.8%

In upscale retail, packaging has become integral to brand identity, using embossed finishes, rigid boxes, and glass formats to create elevated experiences. Customization, including limited-edition designs and personalized wraps, is being prioritized to appeal to consumer individuality and gifting trends. Functional appeal, visual aesthetics, and perceived exclusivity are being used to strengthen brand recall and drive consumer engagement across premium categories.

The industry holds a notable share within these parent industries. Specifically, in the packaging market, the premium packaging segment is estimated to capture around 8-10% due to its focus on high-quality materials and unique designs. In the luxury goods market, premium packaging can represent up to 15-20% as packaging becomes a crucial part of the luxury consumer experience.

The cosmetics and personal care market contributes approximately 12-14% due to increasing demand for aesthetic packaging in skincare and fragrance products. Within the food and beverage market, premium packaging accounts for roughly 5-7%, driven by gourmet products. Lastly, the consumer electronics market sees around 6-8% share, with packaging playing a key role in high-end product presentation.

In a 2024 interview with Premium Beauty News, Claudia D’Arpizio, Senior Partner at Bain & Company and Global Head of the Fashion & Luxury Practice, stated, “Packaging is evolving from a static container into a dynamic brand touchpoint.

It’s no longer about choosing between beauty and responsibility. Today, you can and must deliver both.” This statement reflects how premium packaging is being repositioned as a strategic branding element that must meet both aesthetic and functional expectations.

With heightened demand across luxury sectors for design innovation, personalization, and environmental compliance, the premium packaging market is projected to expand steadily through 2035.

Analyzing Premium Packaging Market by Top Investment Segments

Paperboard is projected to dominate the premium packaging material segment, capturing 55% industry share in 2025 due to its strength, versatility, and eco-friendly properties. The cosmetics and personal care sector leads the end-use industry, holding 39%. Rigid boxes represent 30% of packaging demand, while luxury retail and e-commerce account for 60%.

Paperboard Dominates Material Type Segment with Significant Industry Share

Paperboard is expected to lead the material type segment of the premium packaging industry with a 55% industry share in 2025. This material is preferred for its strength, versatility, and renewability, making it an ideal choice for luxury packaging solutions.
  • Paperboard has been preferred across cosmetics, food, and electronics industries due to its advanced customization compatibility and high print adaptability, supporting detailed branding and premium presentation.
  • Packaging aesthetics have been enhanced using paperboard, as the material allows structural integrity alongside lightweight formats-ideal for premium positioning of skincare, gourmet edibles, and tech accessories.
  • Premium-grade packaging demand has been consistently met through paperboard due to its balance of cost-efficiency and reduced ecological footprint, keeping it dominant across upscale consumer segments.

Premium Packaging Market Analysis By Material Type

Cosmetics and Personal Care Lead End-Use Industry Segment with 39% Industry Share

The cosmetics and personal care sector is projected to capture 39% of the industry share in 2025. Premium packaging plays a crucial role in the beauty industry, as consumers increasingly value aesthetically pleasing, eco-conscious packaging solutions.
  • High-end formats such as magnetic closures, rigid boxes, and custom sleeves have been adopted by brands in makeup, perfumes, skincare, and haircare to elevate shelf impact and influence consumer perception.
  • Product differentiation has been enabled through premium packaging, strengthening brand identity and reinforcing repeat purchase behavior across the personal care and cosmetics space.
  • Packaging has contributed directly to the value proposition of luxury personal care offerings, positioning the cosmetics segment as the lead adopter of premium-grade formats amid growing upscale demand.

Premium Packaging Market Analysis By End Use Industry

Rigid Boxes Capture 30% of Packaging Format Demand

Rigid boxes are likely to hold 30% of the market share in the premium packaging industry, driving growth across various industries. These boxes offer superior durability and a premium unboxing experience, which is essential for high-end products.

  • High-end formats such as magnetic closures, rigid boxes, and custom sleeves have been adopted by brands in makeup, perfumes, skincare, and haircare to elevate shelf impact and influence consumer perception.
  • Product differentiation has been enabled through premium packaging, strengthening brand identity and reinforcing repeat purchase behavior across the personal care and cosmetics space.
  • Packaging has contributed directly to the value proposition of luxury personal care offerings, positioning the cosmetics segment as the lead adopter of premium-grade formats amid growing upscale demand.

Luxury Retail Stores and E-Commerce Channels Account for 60% of Distribution Share

Luxury retail stores and e-commerce platforms are expected to dominate the distribution channels of the premium packaging industry, with luxury retail accounting for 60% of the industry share.

  • Branded outlets have been used to position premium packaging for cosmetics, electronics, and fashion items, offering controlled brand storytelling and a curated in-store presentation.
  • Online retail platforms have expanded premium packaging adoption, as consumers increasingly seek refined unboxing experiences aligned with personalized e-commerce deliveries.
  • Both offline and online channels have contributed to broader reach and enhanced product appeal, reinforcing premium packaging as a strategic differentiator in high-value retail categories.

Top Premium Packaging Market Dynamics

The industry is expanding as consumers demand high-quality, visually appealing packaging. Innovations in material use, customization, and distribution channels are driving the shift towards more premium offerings in various industries.

Recent Market Trends and New Innovations by Key Players

  • Increased use of green materials like paperboard is enhancing both aesthetic appeal and ecological credentials.
  • Key players are focusing on premium unboxing experiences, leveraging advanced packaging formats like magnetic closures and rigid boxes.
  • Customization in packaging design is being prioritized to offer personalized experiences, boosting brand differentiation.
  • Technological innovations in printing techniques are improving product branding and enhancing consumer engagement with packaging.

Challenges Facing the Premium Packaging Market

  • High costs associated with premium packaging materials are restricting growth in price-sensitive industries.
  • Maintaining the balance between environmental responsibility and luxury appeal remains a significant challenge.
  • Increased competition from non-premium packaging solutions threatens industry share in various consumer goods sectors.

Top Countries Manufacturing, Synthesizing, Distributing, and Generating Demand for Premium Packaging

India’s momentum is driven by the expanding consumer goods sector, coupled with rising demand for premium packaging solutions in the food and beverage industry. China follows closely, with a projected 5.6% CAGR, supported by its growing retail industry and e-commerce expansion, increasing the demand for high-quality packaging. Also the developed economies such as Germany (4.4%), the United States (5.9%), and Canada (5.5%) are expanding at a steady pace.

The United States leads in premium packaging demand, driven by the increasing consumer preference for high-end, green packaging options. Canada also shows strong demand for premium packaging, particularly in the food and beverage sectors. The industry adds over USD 700 million by 2035, both high-growth regions like India and China, as well as stable demand from OECD countries, will significantly shape its trajectory.

The report covers detailed analysis of 40+ countries, with the top five countries shared as a reference.
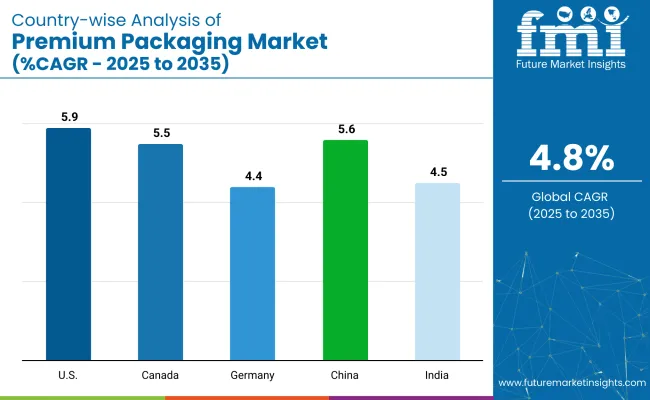
Country Wise Analysis Of Premium Packaging Market

Countries CAGR (2025 to 2035)
USA 5.9%
Canada 5.5%
Germany 4.4%
China 5.6%
India 4.5%

An Overview of USA Premium Packaging Growth

Premium packaging in the United States is forecasted to grow at 5.9% CAGR from 2025 to 2035. Federal and state-level policy shifts are reshaping packaging across luxury retail, DTC beauty, and gourmet food categories. EPR laws in multiple states are increasing compliance costs for multi-material formats, while new trade frameworks reduce input expenses. Brands are investing in structure simplification and premium coatings.

  • SB54 mandates recyclability validation for high-end formats in California.
  • EPR fees in Oregon and Maine influence mono-material adoption.
  • USMCA tariff relaxations benefit virgin fibre imports for embossing.

Canada Premium Packaging Analysis and Growth

Canada’s segment is projected to grow at a 5.5% CAGR through 2035. Provincial enforcement of design-for-recovery rules has made paperboard-based formats dominant in premium applications. Folding cartons and luxury tubes are preferred by personal care and alcohol companies targeting duty-free and e-commerce channels. Plastic restrictions and packaging tax frameworks guide new investments in automated board converting units.

  • Ontario’s Blue Box reforms require 95% material recovery design.
  • Éco-Frais framework incentivises mono-fibre packaging with low residue.
  • Federal ban on non-essential plastics raises paperboard demand.

In-Depth Analysis of Germany Premium Packaging Sales

Germany is expected to grow at 4.4% CAGR, driven by strict compliance obligations under VerpackG and material-specific penalties. Luxury packagers are shifting from complex laminates to mono-material rigid boxes to meet mandatory recycling certifications. Automation grants for board-processing machinery have supported upgrades in Hamburg and Munich. Recyclability thresholds are now enforced on both primary and secondary packaging.

  • Green Dot fees penalise PET-laminated luxury packaging formats.
  • VerpackG enforces recyclability registration for all packaging layers.
  • DIN EN 13430 compliance demanded for upscale food gift boxes.

An Overview of China Premium Packaging Expansion

China’s industry is projected to grow at 5.6% CAGR, supported by increased domestic gifting and regulatory caps on excess packaging. GB 23350 restricts the ratio of pack weight to product weight, prompting reduced use of layered formats in tea and confectionery. MIIT mandates for smart packaging and RCEP-driven tariff cuts have driven lower-cost innovation for upscale brands targeting online channels.

  • GB 23350 enforces structure simplification in luxury food formats.
  • Smart box pilots in Guangdong offer QR and AR functions.
  • RCEP tariff cuts lower input costs for premium paperboard.

India Premium Packaging Analysis and Growth

India is expected to register a 4.5% CAGR through 2035. Compliance with updated PWM Rules has led to a shift toward paper-based premium formats. Import duties on luxury rigid boxes have encouraged local production, while PLI benefits support board conversion and embellishment upgrades. DTC beauty and jewellery brands are driving demand for magnetic and embossed packs.

  • PWM Rules expand producer obligations for post-use collection.
  • 20% import duty imposed on finished high-end rigid boxes.
  • PLI support reduces cost of board used in luxury folding.

Leading Premium Packaging Supplier

Leading Player - Huhtamäki: 15%

Premium Packaging Market Analysis By CompanyPremium packaging suppliers operate in a semi-consolidated landscape, where large firms such as Huhtamäki, MM Packaging, and Graphic Packaging dominate through integrated operations and region-specific production hubs. MM Packaging has scaled its footprint through targeted acquisitions in Central Europe, while Graphic Packaging advanced design capabilities using automation for luxury electronics and beverage segments. High upfront investment, proprietary design frameworks, and regulatory packaging norms serve as major deterrents for new entrants.

Newer entrants like Pack help and Hunter Luxury are gaining traction by offering flexible production runs and design tools tailored to online-first brands. Hunter Luxury expanded its UK R&D division to support structural box innovations for niche liquor firms. Premier Packaging introduced an artisan fragrance carton line, targeting short-lead launches for upscale grooming brands.

Recent Industry News

  • In September 2023, Graphic Packaging acquired Bell Incorporated, securing three USA plants and expanding its premium carton and fiber mailer capabilities for upscale retail and food applications.
  • In May 2025, Hunter Luxury launched biodegradable molded pulp rigid boxes at Luxe Pack New York, combining emboss-ready surfaces with eco-forward materials tailored for premium spirits and chocolate packaging.

Leading Players

  • Premier Packaging LLC
  • Keenpac
  • Hunter Luxury
  • Axilone
  • Huhtamäki
  • MM Packaging
  • Graphic Packaging
  • coepto Group
  • Dome Printing
  • Packhelp

Premium Packaging Market - Report Scope

Report Attributes Details
Market Size (2025) USD 5.4 billion
Projected Market Size (2035) USD 8.6 billion
CAGR (2025 to 2035) 4.8%
Base Year for Estimation 2024
Historical Period 2020 to 2024
Projections Period 2025 to 2035
Quantitative Units USD billion for value
Material Types Analyzed Paperboard, Rigid Plastics, Glass, Metals, Wood, Textiles
Packaging Formats Analyzed Rigid Boxes, Magnetic Closures, Custom Sleeves, Folding Cartons, Tubes
Applications Analyzed Product Display, Branding, Gifting, Collector’s Edition
End-Use Industries Analyzed Cosmetics & Personal Care (Skincare, Perfumes, Haircare, Makeup), Food & Beverages (Gourmet Products, Alcohol & Spirits, Chocolates, Teas), Consumer Electronics (Smartphones, Smartwatches, Accessories), Fashion & Apparel (Jewelry, Watches, Luxury Clothing), Corporate Gifting (Employee Kits, Premium Giveaways)
Distribution Channels Analyzed Luxury Retail Stores, Brand Outlets, E-commerce
Regions Covered North America, Europe, Asia-Pacific, Latin America, Middle East & Africa
Countries Covered United States, Canada, Germany, France, United Kingdom, Italy, Spain, China, Japan, South Korea, India, Australia, UAE, South Africa
Key Players Premier Packaging LLC, Keenpac, Hunter Luxury, Axilone, Huhtamäki, MM Packaging, Graphic Packaging, coepto Group, Dome Printing, Packhelp
Additional Attributes Dollar sales growth by application (cosmetics, electronics), regional demand trends, competitive landscape, pricing strategies, distribution channel insights, material innovations, luxury packaging demand.

Key Segments

By Material Type:

  • Paperboard
  • Rigid Plastics
  • Glass
  • Metals
  • Wood
  • Textiles

By Packaging Format:

  • Rigid Boxes
  • Magnetic Closures
  • Custom Sleeves
  • Folding Cartons
  • Tubes

By Application:

  • Product Display
  • Branding
  • Gifting
  • Collector’s Edition

By End-Use Industry:

  • Cosmetics & Personal Care: Skincare, Perfumes, Haircare, Makeup
  • Food & Beverages: Gourmet Products, Alcohol & Spirits, Chocolates, Teas
  • Consumer Electronics: Smartphones, Smartwatches, Accessories
  • Fashion & Apparel: Jewelry, Watches, Luxury Clothing
  • Corporate Gifting: Employee Kits, Premium Giveaways

By Distribution Channel:

  • Luxury Retail Stores
  • Brand Outlets
  • E-commerce

By Region:

  • North America
  • Europe
  • Asia-Pacific
  • Latin America
  • Middle East & Africa

Table of Content

  1. Executive Summary
    • Global Market Outlook
    • Demand-side Trends
    • Supply-side Trends
    • Technology Roadmap Analysis
    • Analysis and Recommendations
  2. Market Overview
    • Market Coverage/Taxonomy
    • Market Definition/Scope/Limitations
  3. Market Background
    • Market Dynamics
      • Drivers
      • Restraints
      • Opportunity
      • Trends
    • Scenario Forecast
      • Demand in Optimistic Scenario
      • Demand in Likely Scenario
      • Demand in Conservative Scenario
    • Opportunity Map Analysis
    • Product Life Cycle Analysis
    • Supply Chain Analysis
      • Supply Side Participants and their Roles
        • Producers
        • Mid-Level Participants (Traders/ Agents/ Brokers)
        • Wholesalers and Distributors
      • Value Added and Value Created at Node in the Supply Chain
      • List of Raw Material Suppliers
      • List of Existing and Potential Buyer’s
    • Investment Feasibility Matrix
    • Value Chain Analysis
      • Profit Margin Analysis
      • Wholesalers and Distributors
      • Retailers
    • PESTLE and Porter’s Analysis
    • Regulatory Landscape
      • By Key Regions
      • By Key Countries
    • Regional Parent Market Outlook
    • Production and Consumption Statistics
    • Import and Export Statistics
  4. Global Premium Packaging Market Analysis 2020 to 2024 and Forecast, 2025 to 2035
    • Historical Market Size Value (USD Billion) & Volume (KT) Analysis, 2020 to 2024
    • Current and Future Market Size Value (USD Billion) & Volume (KT) Projections, 2025 to 2035
      • Y-o-Y Growth Trend Analysis
      • Absolute $ Opportunity Analysis
  5. Global Premium Packaging Market Pricing Analysis 2020 to 2024 and Forecast 2025 to 2035
  6. Global Premium Packaging Market Analysis 2020 to 2024 and Forecast 2025 to 2035, By Material Type
    • Introduction/Key Findings
    • Historical Market Size Value (USD Billion) & Volume (KT) Analysis By Material Type, 2020 to 2024
    • Current and Future Market Size Value (USD Billion) & Volume (KT) Analysis and Forecast By Material Type, 2025 to 2035
      • Paperboard
      • Rigid Plastics
      • Glass
      • Metals
      • Wood
      • Textiles
    • Y-o-Y Growth Trend Analysis By Material Type, 2020 to 2024
    • Absolute $ Opportunity Analysis By Material Type, 2025 to 2035
  7. Global Premium Packaging Market Analysis 2020 to 2024 and Forecast 2025 to 2035, By Packaging Format
    • Introduction/Key Findings
    • Historical Market Size Value (USD Billion) & Volume (KT) Analysis By Packaging Format, 2020 to 2024
    • Current and Future Market Size Value (USD Billion) & Volume (KT) Analysis and Forecast By Packaging Format, 2025 to 2035
      • Rigid Boxes
      • Magnetic Closures
      • Custom Sleeves
      • Folding Cartons
      • Tubes
    • Y-o-Y Growth Trend Analysis By Packaging Format, 2020 to 2024
    • Absolute $ Opportunity Analysis By Packaging Format, 2025 to 2035
  8. Global Premium Packaging Market Analysis 2020 to 2024 and Forecast 2025 to 2035, By Application
    • Introduction/Key Findings
    • Historical Market Size Value (USD Billion) & Volume (KT) Analysis By Application, 2020 to 2024
    • Current and Future Market Size Value (USD Billion) & Volume (KT) Analysis and Forecast By Application, 2025 to 2035
      • Product Display
      • Branding
      • Gifting
      • Collector’s Edition
    • Y-o-Y Growth Trend Analysis By Application, 2020 to 2024
    • Absolute $ Opportunity Analysis By Application, 2025 to 2035
  9. Global Premium Packaging Market Analysis 2020 to 2024 and Forecast 2025 to 2035, By End-Use Industry
    • Introduction/Key Findings
    • Historical Market Size Value (USD Billion) & Volume (KT) Analysis By End-Use Industry, 2020 to 2024
    • Current and Future Market Size Value (USD Billion) & Volume (KT) Analysis and Forecast By End-Use Industry, 2025 to 2035
      • Cosmetics & Personal Care
        • Skincare
        • Perfumes
        • Haircare
        • Makeup
      • Food & Beverages
        • Gourmet Products
        • Alcohol & Spirits
        • Chocolates
        • Teas
      • Consumer Electronics
        • Smartphones
        • Smartwatches
        • Accessories
      • Fashion & Apparel
        • Jewelry
        • Watches
        • Luxury Clothing
      • Corporate Gifting
        • Employee Kits
        • Premium Giveaways
    • Y-o-Y Growth Trend Analysis By End-Use Industry, 2020 to 2024
    • Absolute $ Opportunity Analysis By End-Use Industry, 2025 to 2035
  10. Global Premium Packaging Market Analysis 2020 to 2024 and Forecast 2025 to 2035, By Distribution Channel
    • Introduction/Key Findings
    • Historical Market Size Value (USD Billion) & Volume (KT) Analysis By Distribution Channel, 2020 to 2024
    • Current and Future Market Size Value (USD Billion) & Volume (KT) Analysis and Forecast By Distribution Channel, 2025 to 2035
      • Luxury Retail Stores
      • Brand Outlets
      • E-commerce
    • Y-o-Y Growth Trend Analysis By Distribution Channel, 2020 to 2024
    • Absolute $ Opportunity Analysis By Distribution Channel, 2025 to 2035
  11. Global Premium Packaging Market Analysis 2020 to 2024 and Forecast 2025 to 2035, By Region
    • Introduction
    • Historical Market Size Value (USD Billion) & Volume (KT) Analysis By Region, 2020 to 2024
    • Current Market Size Value (USD Billion) & Volume (KT) Analysis and Forecast By Region, 2025 to 2035
      • North America
      • Latin America
      • Western Europe
      • Eastern Europe
      • East Asia
      • South Asia & Pacific
      • Middle East and Africa
    • Market Attractiveness Analysis By Region
  12. North America Premium Packaging Market Analysis 2020 to 2024 and Forecast 2025 to 2035, By Country
    • Historical Market Size Value (USD Billion) & Volume (KT) Trend Analysis By Market Taxonomy, 2020 to 2024
    • Market Size Value (USD Billion) & Volume (KT) Forecast By Market Taxonomy, 2025 to 2035
      • By Country
        • USA
        • Canada
        • Mexico
      • By Material Type
      • By Packaging Format
      • By Application
      • By End-Use Industry
      • By Distribution Channel
    • Market Attractiveness Analysis
      • By Country
      • By Material Type
      • By Packaging Format
      • By Application
      • By End-Use Industry
      • By Distribution Channel
    • Key Takeaways
  13. Latin America Premium Packaging Market Analysis 2020 to 2024 and Forecast 2025 to 2035, By Country
    • Historical Market Size Value (USD Billion) & Volume (KT) Trend Analysis By Market Taxonomy, 2020 to 2024
    • Market Size Value (USD Billion) & Volume (KT) Forecast By Market Taxonomy, 2025 to 2035
      • By Country
        • Brazil
        • Argentina
        • Rest of LATAM
      • By Material Type
      • By Packaging Format
      • By Application
      • By End-Use Industry
      • By Distribution Channel
    • Market Attractiveness Analysis
      • By Country
      • By Material Type
      • By Packaging Format
      • By Application
      • By End-Use Industry
      • By Distribution Channel
    • Key Takeaways
  14. Western Europe Premium Packaging Market Analysis 2020 to 2024 and Forecast 2025 to 2035, By Country
    • Historical Market Size Value (USD Billion) & Volume (KT) Trend Analysis By Market Taxonomy, 2020 to 2024
    • Market Size Value (USD Billion) & Volume (KT) Forecast By Market Taxonomy, 2025 to 2035
      • By Country
        • Germany
        • Italy
        • France
        • UK
        • Spain
        • BENELUX
        • Nordic
        • Rest of W.Europe
      • By Material Type
      • By Packaging Format
      • By Application
      • By End-Use Industry
      • By Distribution Channel
    • Market Attractiveness Analysis
      • By Country
      • By Material Type
      • By Packaging Format
      • By Application
      • By End-Use Industry
      • By Distribution Channel
    • Key Takeaways
  15. Eastern Europe Premium Packaging Market Analysis 2020 to 2024 and Forecast 2025 to 2035, By Country
    • Historical Market Size Value (USD Billion) & Volume (KT) Trend Analysis By Market Taxonomy, 2020 to 2024
    • Market Size Value (USD Billion) & Volume (KT) Forecast By Market Taxonomy, 2025 to 2035
      • By Country
        • Russia
        • Hungary
        • Poland
        • Balkan & Baltics
        • Rest of E. Europe
      • By Material Type
      • By Packaging Format
      • By Application
      • By End-Use Industry
      • By Distribution Channel
    • Market Attractiveness Analysis
      • By Country
      • By Material Type
      • By Packaging Format
      • By Application
      • By End-Use Industry
      • By Distribution Channel
    • Key Takeaways
  16. East Asia Premium Packaging Market Analysis 2020 to 2024 and Forecast 2025 to 2035, By Country
    • Historical Market Size Value (USD Billion) & Volume (KT) Trend Analysis By Market Taxonomy, 2020 to 2024
    • Market Size Value (USD Billion) & Volume (KT) Forecast By Market Taxonomy, 2025 to 2035
      • By Country
        • China
        • Japan
        • South Korea
      • By Material Type
      • By Packaging Format
      • By Application
      • By End-Use Industry
      • By Distribution Channel
    • Market Attractiveness Analysis
      • By Country
      • By Material Type
      • By Packaging Format
      • By Application
      • By End-Use Industry
      • By Distribution Channel
    • Key Takeaways
  17. South Asia & Pacific Premium Packaging Market Analysis 2020 to 2024 and Forecast 2025 to 2035, By Country
    • Historical Market Size Value (USD Billion) & Volume (KT) Trend Analysis By Market Taxonomy, 2020 to 2024
    • Market Size Value (USD Billion) & Volume (KT) Forecast By Market Taxonomy, 2025 to 2035
      • By Country
        • India
        • Australia & New Zealand
        • ASEAN
        • Rest of SAP
      • By Material Type
      • By Packaging Format
      • By Application
      • By End-Use Industry
      • By Distribution Channel
    • Market Attractiveness Analysis
      • By Country
      • By Material Type
      • By Packaging Format
      • By Application
      • By End-Use Industry
      • By Distribution Channel
    • Key Takeaways
  18. Middle East and Africa Premium Packaging Market Analysis 2020 to 2024 and Forecast 2025 to 2035, By Country
    • Historical Market Size Value (USD Billion) & Volume (KT) Trend Analysis By Market Taxonomy, 2020 to 2024
    • Market Size Value (USD Billion) & Volume (KT) Forecast By Market Taxonomy, 2025 to 2035
      • By Country
        • GCC Countries
        • Northern Africa
        • South Africa
        • Turkiye
        • Rest of MEA
      • By Material Type
      • By Packaging Format
      • By Application
      • By End-Use Industry
      • By Distribution Channel
    • Market Attractiveness Analysis
      • By Country
      • By Material Type
      • By Packaging Format
      • By Application
      • By End-Use Industry
      • By Distribution Channel
    • Key Takeaways
  19. Key Countries Premium Packaging Market Analysis
    • USA
      • Pricing Analysis
      • Market Share Analysis, 2024
        • By Material Type
        • By Packaging Format
        • By Application
        • By End-Use Industry
        • By Distribution Channel
    • Canada
      • Pricing Analysis
      • Market Share Analysis, 2024
        • By Material Type
        • By Packaging Format
        • By Application
        • By End-Use Industry
        • By Distribution Channel
    • Brazil
      • Pricing Analysis
      • Market Share Analysis, 2024
        • By Material Type
        • By Packaging Format
        • By Application
        • By End-Use Industry
        • By Distribution Channel
    • Mexico
      • Pricing Analysis
      • Market Share Analysis, 2024
        • By Material Type
        • By Packaging Format
        • By Application
        • By End-Use Industry
        • By Distribution Channel
    • Argentina
      • Pricing Analysis
      • Market Share Analysis, 2024
        • By Material Type
        • By Packaging Format
        • By Application
        • By End-Use Industry
        • By Distribution Channel
  20. Market Structure Analysis
    • Competition Dashboard
    • Competition Benchmarking
    • Market Share Analysis of Top Players
      • By Regional
      • By Material Type
      • By Packaging Format
      • By Application
      • By End-Use Industry
      • By Distribution Channel
  21. Competition Analysis
    • Competition Deep Dive
      • Premier Packaging LLC
        • Overview
        • Product Portfolio
        • Profitability by Market Segments (Product/Age /Sales Channel/Region)
        • Sales Footprint
        • Strategy Overview
          • Marketing Strategy
          • Product Strategy
          • Channel Strategy
      • Keenpac
        • Overview
        • Product Portfolio
        • Profitability by Market Segments (Product/Age /Sales Channel/Region)
        • Sales Footprint
        • Strategy Overview
          • Marketing Strategy
          • Product Strategy
          • Channel Strategy
      • Hunter Luxury
        • Overview
        • Product Portfolio
        • Profitability by Market Segments (Product/Age /Sales Channel/Region)
        • Sales Footprint
        • Strategy Overview
          • Marketing Strategy
          • Product Strategy
          • Channel Strategy
      • Axilone
        • Overview
        • Product Portfolio
        • Profitability by Market Segments (Product/Age /Sales Channel/Region)
        • Sales Footprint
        • Strategy Overview
          • Marketing Strategy
          • Product Strategy
          • Channel Strategy
      • Huhtamäki
        • Overview
        • Product Portfolio
        • Profitability by Market Segments (Product/Age /Sales Channel/Region)
        • Sales Footprint
        • Strategy Overview
          • Marketing Strategy
          • Product Strategy
          • Channel Strategy
      • MM Packaging
        • Overview
        • Product Portfolio
        • Profitability by Market Segments (Product/Age /Sales Channel/Region)
        • Sales Footprint
        • Strategy Overview
          • Marketing Strategy
          • Product Strategy
          • Channel Strategy
      • Graphic Packaging
        • Overview
        • Product Portfolio
        • Profitability by Market Segments (Product/Age /Sales Channel/Region)
        • Sales Footprint
        • Strategy Overview
          • Marketing Strategy
          • Product Strategy
          • Channel Strategy
      • coepto Group
        • Overview
        • Product Portfolio
        • Profitability by Market Segments (Product/Age /Sales Channel/Region)
        • Sales Footprint
        • Strategy Overview
          • Marketing Strategy
          • Product Strategy
          • Channel Strategy
      • Dome Printing
        • Overview
        • Product Portfolio
        • Profitability by Market Segments (Product/Age /Sales Channel/Region)
        • Sales Footprint
        • Strategy Overview
          • Marketing Strategy
          • Product Strategy
          • Channel Strategy
      • Packhelp
        • Overview
        • Product Portfolio
        • Profitability by Market Segments (Product/Age /Sales Channel/Region)
        • Sales Footprint
        • Strategy Overview
          • Marketing Strategy
          • Product Strategy
          • Channel Strategy
  22. Assumptions & Acronyms Used
  23. Research Methodology

List of Tables

  • Table 1: Global Market Value (USD Billion) Forecast by Region, 2020-2035
  • Table 2: Global Market Volume (KT) Forecast by Region, 2020-2035
  • Table 3: Global Market Value (USD Billion) Forecast by Material Type, 2020-2035
  • Table 4: Global Market Volume (KT) Forecast by Material Type, 2020-2035
  • Table 5: Global Market Value (USD Billion) Forecast by Packaging Format, 2020-2035
  • Table 6: Global Market Volume (KT) Forecast by Packaging Format, 2020-2035
  • Table 7: Global Market Value (USD Billion) Forecast by Application, 2020-2035
  • Table 8: Global Market Volume (KT) Forecast by Application, 2020-2035
  • Table 9: Global Market Value (USD Billion) Forecast by End-Use Industry, 2020-2035
  • Table 10: Global Market Volume (KT) Forecast by End-Use Industry, 2020-2035
  • Table 11: Global Market Value (USD Billion) Forecast by Distribution Channel, 2020-2035
  • Table 12: Global Market Volume (KT) Forecast by Distribution Channel, 2020-2035
  • Table 13: North America Market Value (USD Billion) Forecast by Country, 2020-2035
  • Table 14: North America Market Volume (KT) Forecast by Country, 2020-2035
  • Table 15: North America Market Value (USD Billion) Forecast by Material Type, 2020-2035
  • Table 16: North America Market Volume (KT) Forecast by Material Type, 2020-2035
  • Table 17: North America Market Value (USD Billion) Forecast by Packaging Format, 2020-2035
  • Table 18: North America Market Volume (KT) Forecast by Packaging Format, 2020-2035
  • Table 19: North America Market Value (USD Billion) Forecast by Application, 2020-2035
  • Table 20: North America Market Volume (KT) Forecast by Application, 2020-2035
  • Table 21: North America Market Value (USD Billion) Forecast by End-Use Industry, 2020-2035
  • Table 22: North America Market Volume (KT) Forecast by End-Use Industry, 2020-2035
  • Table 23: North America Market Value (USD Billion) Forecast by Distribution Channel, 2020-2035
  • Table 24: North America Market Volume (KT) Forecast by Distribution Channel, 2020-2035
  • Table 25: Latin America Market Value (USD Billion) Forecast by Country, 2020-2035
  • Table 26: Latin America Market Volume (KT) Forecast by Country, 2020-2035
  • Table 27: Latin America Market Value (USD Billion) Forecast by Material Type, 2020-2035
  • Table 28: Latin America Market Volume (KT) Forecast by Material Type, 2020-2035
  • Table 29: Latin America Market Value (USD Billion) Forecast by Packaging Format, 2020-2035
  • Table 30: Latin America Market Volume (KT) Forecast by Packaging Format, 2020-2035
  • Table 31: Latin America Market Value (USD Billion) Forecast by Application, 2020-2035
  • Table 32: Latin America Market Volume (KT) Forecast by Application, 2020-2035
  • Table 33: Latin America Market Value (USD Billion) Forecast by End-Use Industry, 2020-2035
  • Table 34: Latin America Market Volume (KT) Forecast by End-Use Industry, 2020-2035
  • Table 35: Latin America Market Value (USD Billion) Forecast by Distribution Channel, 2020-2035
  • Table 36: Latin America Market Volume (KT) Forecast by Distribution Channel, 2020-2035
  • Table 37: Western Europe Market Value (USD Billion) Forecast by Country, 2020-2035
  • Table 38: Western Europe Market Volume (KT) Forecast by Country, 2020-2035
  • Table 39: Western Europe Market Value (USD Billion) Forecast by Material Type, 2020-2035
  • Table 40: Western Europe Market Volume (KT) Forecast by Material Type, 2020-2035
  • Table 41: Western Europe Market Value (USD Billion) Forecast by Packaging Format, 2020-2035
  • Table 42: Western Europe Market Volume (KT) Forecast by Packaging Format, 2020-2035
  • Table 43: Western Europe Market Value (USD Billion) Forecast by Application, 2020-2035
  • Table 44: Western Europe Market Volume (KT) Forecast by Application, 2020-2035
  • Table 45: Western Europe Market Value (USD Billion) Forecast by End-Use Industry, 2020-2035
  • Table 46: Western Europe Market Volume (KT) Forecast by End-Use Industry, 2020-2035
  • Table 47: Western Europe Market Value (USD Billion) Forecast by Distribution Channel, 2020-2035
  • Table 48: Western Europe Market Volume (KT) Forecast by Distribution Channel, 2020-2035
  • Table 49: Eastern Europe Market Value (USD Billion) Forecast by Country, 2020-2035
  • Table 50: Eastern Europe Market Volume (KT) Forecast by Country, 2020-2035
  • Table 51: Eastern Europe Market Value (USD Billion) Forecast by Material Type, 2020-2035
  • Table 52: Eastern Europe Market Volume (KT) Forecast by Material Type, 2020-2035
  • Table 53: Eastern Europe Market Value (USD Billion) Forecast by Packaging Format, 2020-2035
  • Table 54: Eastern Europe Market Volume (KT) Forecast by Packaging Format, 2020-2035
  • Table 55: Eastern Europe Market Value (USD Billion) Forecast by Application, 2020-2035
  • Table 56: Eastern Europe Market Volume (KT) Forecast by Application, 2020-2035
  • Table 57: Eastern Europe Market Value (USD Billion) Forecast by End-Use Industry, 2020-2035
  • Table 58: Eastern Europe Market Volume (KT) Forecast by End-Use Industry, 2020-2035
  • Table 59: Eastern Europe Market Value (USD Billion) Forecast by Distribution Channel, 2020-2035
  • Table 60: Eastern Europe Market Volume (KT) Forecast by Distribution Channel, 2020-2035
  • Table 61: East Asia Market Value (USD Billion) Forecast by Country, 2020-2035
  • Table 62: East Asia Market Volume (KT) Forecast by Country, 2020-2035
  • Table 63: East Asia Market Value (USD Billion) Forecast by Material Type, 2020-2035
  • Table 64: East Asia Market Volume (KT) Forecast by Material Type, 2020-2035
  • Table 65: East Asia Market Value (USD Billion) Forecast by Packaging Format, 2020-2035
  • Table 66: East Asia Market Volume (KT) Forecast by Packaging Format, 2020-2035
  • Table 67: East Asia Market Value (USD Billion) Forecast by Application, 2020-2035
  • Table 68: East Asia Market Volume (KT) Forecast by Application, 2020-2035
  • Table 69: East Asia Market Value (USD Billion) Forecast by End-Use Industry, 2020-2035
  • Table 70: East Asia Market Volume (KT) Forecast by End-Use Industry, 2020-2035
  • Table 71: East Asia Market Value (USD Billion) Forecast by Distribution Channel, 2020-2035
  • Table 72: East Asia Market Volume (KT) Forecast by Distribution Channel, 2020-2035
  • Table 73: South Asia & Pacific Market Value (USD Billion) Forecast by Country, 2020-2035
  • Table 74: South Asia & Pacific Market Volume (KT) Forecast by Country, 2020-2035
  • Table 75: South Asia & Pacific Market Value (USD Billion) Forecast by Material Type, 2020-2035
  • Table 76: South Asia & Pacific Market Volume (KT) Forecast by Material Type, 2020-2035
  • Table 77: South Asia & Pacific Market Value (USD Billion) Forecast by Packaging Format, 2020-2035
  • Table 78: South Asia & Pacific Market Volume (KT) Forecast by Packaging Format, 2020-2035
  • Table 79: South Asia & Pacific Market Value (USD Billion) Forecast by Application, 2020-2035
  • Table 80: South Asia & Pacific Market Volume (KT) Forecast by Application, 2020-2035
  • Table 81: South Asia & Pacific Market Value (USD Billion) Forecast by End-Use Industry, 2020-2035
  • Table 82: South Asia & Pacific Market Volume (KT) Forecast by End-Use Industry, 2020-2035
  • Table 83: South Asia & Pacific Market Value (USD Billion) Forecast by Distribution Channel, 2020-2035
  • Table 84: South Asia & Pacific Market Volume (KT) Forecast by Distribution Channel, 2020-2035
  • Table 85: Middle East and Africa Market Value (USD Billion) Forecast by Country, 2020-2035
  • Table 86: Middle East and Africa Market Volume (KT) Forecast by Country, 2020-2035
  • Table 87: Middle East and Africa Market Value (USD Billion) Forecast by Material Type, 2020-2035
  • Table 88: Middle East and Africa Market Volume (KT) Forecast by Material Type, 2020-2035
  • Table 89: Middle East and Africa Market Value (USD Billion) Forecast by Packaging Format, 2020-2035
  • Table 90: Middle East and Africa Market Volume (KT) Forecast by Packaging Format, 2020-2035
  • Table 91: Middle East and Africa Market Value (USD Billion) Forecast by Application, 2020-2035
  • Table 92: Middle East and Africa Market Volume (KT) Forecast by Application, 2020-2035
  • Table 93: Middle East and Africa Market Value (USD Billion) Forecast by End-Use Industry, 2020-2035
  • Table 94: Middle East and Africa Market Volume (KT) Forecast by End-Use Industry, 2020-2035
  • Table 95: Middle East and Africa Market Value (USD Billion) Forecast by Distribution Channel, 2020-2035
  • Table 96: Middle East and Africa Market Volume (KT) Forecast by Distribution Channel, 2020-2035

List of Figures

  • Figure 1: Global Market Volume (KT) Forecast 2020-2035
  • Figure 2: Global Market Pricing Analysis
  • Figure 3: Global Market Value (USD Billion) Forecast 2020-2035
  • Figure 4: Global Market Value Share and BPS Analysis by Material Type, 2025 and 2035
  • Figure 5: Global Market Y-o-Y Growth Comparison by Material Type, 2025-2035
  • Figure 6: Global Market Attractiveness Analysis by Material Type
  • Figure 7: Global Market Value Share and BPS Analysis by Packaging Format, 2025 and 2035
  • Figure 8: Global Market Y-o-Y Growth Comparison by Packaging Format, 2025-2035
  • Figure 9: Global Market Attractiveness Analysis by Packaging Format
  • Figure 10: Global Market Value Share and BPS Analysis by Application, 2025 and 2035
  • Figure 11: Global Market Y-o-Y Growth Comparison by Application, 2025-2035
  • Figure 12: Global Market Attractiveness Analysis by Application
  • Figure 13: Global Market Value Share and BPS Analysis by End-Use Industry, 2025 and 2035
  • Figure 14: Global Market Y-o-Y Growth Comparison by End-Use Industry, 2025-2035
  • Figure 15: Global Market Attractiveness Analysis by End-Use Industry
  • Figure 16: Global Market Value Share and BPS Analysis by Distribution Channel, 2025 and 2035
  • Figure 17: Global Market Y-o-Y Growth Comparison by Distribution Channel, 2025-2035
  • Figure 18: Global Market Attractiveness Analysis by Distribution Channel
  • Figure 19: Global Market Value (USD Billion) Share and BPS Analysis by Region, 2025 and 2035
  • Figure 20: Global Market Y-o-Y Growth Comparison by Region, 2025-2035
  • Figure 21: Global Market Attractiveness Analysis by Region
  • Figure 22: North America Market Incremental $ Opportunity, 2025-2035
  • Figure 23: Latin America Market Incremental $ Opportunity, 2025-2035
  • Figure 24: Western Europe Market Incremental $ Opportunity, 2025-2035
  • Figure 25: Eastern Europe Market Incremental $ Opportunity, 2025-2035
  • Figure 26: East Asia Market Incremental $ Opportunity, 2025-2035
  • Figure 27: South Asia & Pacific Market Incremental $ Opportunity, 2025-2035
  • Figure 28: Middle East and Africa Market Incremental $ Opportunity, 2025-2035
  • Figure 29: North America Market Value Share and BPS Analysis by Country, 2025 and 2035
  • Figure 30: North America Market Value Share and BPS Analysis by Material Type, 2025 and 2035
  • Figure 31: North America Market Y-o-Y Growth Comparison by Material Type, 2025-2035
  • Figure 32: North America Market Attractiveness Analysis by Material Type
  • Figure 33: North America Market Value Share and BPS Analysis by Packaging Format, 2025 and 2035
  • Figure 34: North America Market Y-o-Y Growth Comparison by Packaging Format, 2025-2035
  • Figure 35: North America Market Attractiveness Analysis by Packaging Format
  • Figure 36: North America Market Value Share and BPS Analysis by Application, 2025 and 2035
  • Figure 37: North America Market Y-o-Y Growth Comparison by Application, 2025-2035
  • Figure 38: North America Market Attractiveness Analysis by Application
  • Figure 39: North America Market Value Share and BPS Analysis by End-Use Industry, 2025 and 2035
  • Figure 40: North America Market Y-o-Y Growth Comparison by End-Use Industry, 2025-2035
  • Figure 41: North America Market Attractiveness Analysis by End-Use Industry
  • Figure 42: North America Market Value Share and BPS Analysis by Distribution Channel, 2025 and 2035
  • Figure 43: North America Market Y-o-Y Growth Comparison by Distribution Channel, 2025-2035
  • Figure 44: North America Market Attractiveness Analysis by Distribution Channel
  • Figure 45: Latin America Market Value Share and BPS Analysis by Country, 2025 and 2035
  • Figure 46: Latin America Market Value Share and BPS Analysis by Material Type, 2025 and 2035
  • Figure 47: Latin America Market Y-o-Y Growth Comparison by Material Type, 2025-2035
  • Figure 48: Latin America Market Attractiveness Analysis by Material Type
  • Figure 49: Latin America Market Value Share and BPS Analysis by Packaging Format, 2025 and 2035
  • Figure 50: Latin America Market Y-o-Y Growth Comparison by Packaging Format, 2025-2035
  • Figure 51: Latin America Market Attractiveness Analysis by Packaging Format
  • Figure 52: Latin America Market Value Share and BPS Analysis by Application, 2025 and 2035
  • Figure 53: Latin America Market Y-o-Y Growth Comparison by Application, 2025-2035
  • Figure 54: Latin America Market Attractiveness Analysis by Application
  • Figure 55: Latin America Market Value Share and BPS Analysis by End-Use Industry, 2025 and 2035
  • Figure 56: Latin America Market Y-o-Y Growth Comparison by End-Use Industry, 2025-2035
  • Figure 57: Latin America Market Attractiveness Analysis by End-Use Industry
  • Figure 58: Latin America Market Value Share and BPS Analysis by Distribution Channel, 2025 and 2035
  • Figure 59: Latin America Market Y-o-Y Growth Comparison by Distribution Channel, 2025-2035
  • Figure 60: Latin America Market Attractiveness Analysis by Distribution Channel
  • Figure 61: Western Europe Market Value Share and BPS Analysis by Country, 2025 and 2035
  • Figure 62: Western Europe Market Value Share and BPS Analysis by Material Type, 2025 and 2035
  • Figure 63: Western Europe Market Y-o-Y Growth Comparison by Material Type, 2025-2035
  • Figure 64: Western Europe Market Attractiveness Analysis by Material Type
  • Figure 65: Western Europe Market Value Share and BPS Analysis by Packaging Format, 2025 and 2035
  • Figure 66: Western Europe Market Y-o-Y Growth Comparison by Packaging Format, 2025-2035
  • Figure 67: Western Europe Market Attractiveness Analysis by Packaging Format
  • Figure 68: Western Europe Market Value Share and BPS Analysis by Application, 2025 and 2035
  • Figure 69: Western Europe Market Y-o-Y Growth Comparison by Application, 2025-2035
  • Figure 70: Western Europe Market Attractiveness Analysis by Application
  • Figure 71: Western Europe Market Value Share and BPS Analysis by End-Use Industry, 2025 and 2035
  • Figure 72: Western Europe Market Y-o-Y Growth Comparison by End-Use Industry, 2025-2035
  • Figure 73: Western Europe Market Attractiveness Analysis by End-Use Industry
  • Figure 74: Western Europe Market Value Share and BPS Analysis by Distribution Channel, 2025 and 2035
  • Figure 75: Western Europe Market Y-o-Y Growth Comparison by Distribution Channel, 2025-2035
  • Figure 76: Western Europe Market Attractiveness Analysis by Distribution Channel
  • Figure 77: Eastern Europe Market Value Share and BPS Analysis by Country, 2025 and 2035
  • Figure 78: Eastern Europe Market Value Share and BPS Analysis by Material Type, 2025 and 2035
  • Figure 79: Eastern Europe Market Y-o-Y Growth Comparison by Material Type, 2025-2035
  • Figure 80: Eastern Europe Market Attractiveness Analysis by Material Type
  • Figure 81: Eastern Europe Market Value Share and BPS Analysis by Packaging Format, 2025 and 2035
  • Figure 82: Eastern Europe Market Y-o-Y Growth Comparison by Packaging Format, 2025-2035
  • Figure 83: Eastern Europe Market Attractiveness Analysis by Packaging Format
  • Figure 84: Eastern Europe Market Value Share and BPS Analysis by Application, 2025 and 2035
  • Figure 85: Eastern Europe Market Y-o-Y Growth Comparison by Application, 2025-2035
  • Figure 86: Eastern Europe Market Attractiveness Analysis by Application
  • Figure 87: Eastern Europe Market Value Share and BPS Analysis by End-Use Industry, 2025 and 2035
  • Figure 88: Eastern Europe Market Y-o-Y Growth Comparison by End-Use Industry, 2025-2035
  • Figure 89: Eastern Europe Market Attractiveness Analysis by End-Use Industry
  • Figure 90: Eastern Europe Market Value Share and BPS Analysis by Distribution Channel, 2025 and 2035
  • Figure 91: Eastern Europe Market Y-o-Y Growth Comparison by Distribution Channel, 2025-2035
  • Figure 92: Eastern Europe Market Attractiveness Analysis by Distribution Channel
  • Figure 93: East Asia Market Value Share and BPS Analysis by Country, 2025 and 2035
  • Figure 94: East Asia Market Value Share and BPS Analysis by Material Type, 2025 and 2035
  • Figure 95: East Asia Market Y-o-Y Growth Comparison by Material Type, 2025-2035
  • Figure 96: East Asia Market Attractiveness Analysis by Material Type
  • Figure 97: East Asia Market Value Share and BPS Analysis by Packaging Format, 2025 and 2035
  • Figure 98: East Asia Market Y-o-Y Growth Comparison by Packaging Format, 2025-2035
  • Figure 99: East Asia Market Attractiveness Analysis by Packaging Format
  • Figure 100: East Asia Market Value Share and BPS Analysis by Application, 2025 and 2035
  • Figure 101: East Asia Market Y-o-Y Growth Comparison by Application, 2025-2035
  • Figure 102: East Asia Market Attractiveness Analysis by Application
  • Figure 103: East Asia Market Value Share and BPS Analysis by End-Use Industry, 2025 and 2035
  • Figure 104: East Asia Market Y-o-Y Growth Comparison by End-Use Industry, 2025-2035
  • Figure 105: East Asia Market Attractiveness Analysis by End-Use Industry
  • Figure 106: East Asia Market Value Share and BPS Analysis by Distribution Channel, 2025 and 2035
  • Figure 107: East Asia Market Y-o-Y Growth Comparison by Distribution Channel, 2025-2035
  • Figure 108: East Asia Market Attractiveness Analysis by Distribution Channel
  • Figure 109: South Asia & Pacific Market Value Share and BPS Analysis by Country, 2025 and 2035
  • Figure 110: South Asia & Pacific Market Value Share and BPS Analysis by Material Type, 2025 and 2035
  • Figure 111: South Asia & Pacific Market Y-o-Y Growth Comparison by Material Type, 2025-2035
  • Figure 112: South Asia & Pacific Market Attractiveness Analysis by Material Type
  • Figure 113: South Asia & Pacific Market Value Share and BPS Analysis by Packaging Format, 2025 and 2035
  • Figure 114: South Asia & Pacific Market Y-o-Y Growth Comparison by Packaging Format, 2025-2035
  • Figure 115: South Asia & Pacific Market Attractiveness Analysis by Packaging Format
  • Figure 116: South Asia & Pacific Market Value Share and BPS Analysis by Application, 2025 and 2035
  • Figure 117: South Asia & Pacific Market Y-o-Y Growth Comparison by Application, 2025-2035
  • Figure 118: South Asia & Pacific Market Attractiveness Analysis by Application
  • Figure 119: South Asia & Pacific Market Value Share and BPS Analysis by End-Use Industry, 2025 and 2035
  • Figure 120: South Asia & Pacific Market Y-o-Y Growth Comparison by End-Use Industry, 2025-2035
  • Figure 121: South Asia & Pacific Market Attractiveness Analysis by End-Use Industry
  • Figure 122: South Asia & Pacific Market Value Share and BPS Analysis by Distribution Channel, 2025 and 2035
  • Figure 123: South Asia & Pacific Market Y-o-Y Growth Comparison by Distribution Channel, 2025-2035
  • Figure 124: South Asia & Pacific Market Attractiveness Analysis by Distribution Channel
  • Figure 125: Middle East and Africa Market Value Share and BPS Analysis by Country, 2025 and 2035
  • Figure 126: Middle East and Africa Market Value Share and BPS Analysis by Material Type, 2025 and 2035
  • Figure 127: Middle East and Africa Market Y-o-Y Growth Comparison by Material Type, 2025-2035
  • Figure 128: Middle East and Africa Market Attractiveness Analysis by Material Type
  • Figure 129: Middle East and Africa Market Value Share and BPS Analysis by Packaging Format, 2025 and 2035
  • Figure 130: Middle East and Africa Market Y-o-Y Growth Comparison by Packaging Format, 2025-2035
  • Figure 131: Middle East and Africa Market Attractiveness Analysis by Packaging Format
  • Figure 132: Middle East and Africa Market Value Share and BPS Analysis by Application, 2025 and 2035
  • Figure 133: Middle East and Africa Market Y-o-Y Growth Comparison by Application, 2025-2035
  • Figure 134: Middle East and Africa Market Attractiveness Analysis by Application
  • Figure 135: Middle East and Africa Market Value Share and BPS Analysis by End-Use Industry, 2025 and 2035
  • Figure 136: Middle East and Africa Market Y-o-Y Growth Comparison by End-Use Industry, 2025-2035
  • Figure 137: Middle East and Africa Market Attractiveness Analysis by End-Use Industry
  • Figure 138: Middle East and Africa Market Value Share and BPS Analysis by Distribution Channel, 2025 and 2035
  • Figure 139: Middle East and Africa Market Y-o-Y Growth Comparison by Distribution Channel, 2025-2035
  • Figure 140: Middle East and Africa Market Attractiveness Analysis by Distribution Channel
  • Figure 141: Global Market - Tier Structure Analysis
  • Figure 142: Global Market - Company Share Analysis

Frequently Asked Questions

What is the projected market size of the premium packaging industry in 2025 and 2035?

The industry size is projected to be USD 5.4 billion in 2025 and USD 8.6 billion by 2035.

What is the expected CAGR for the premium packaging market from 2025 to 2035?

The expected CAGR is 4.8% from 2025 to 2035.

Which material dominates the premium packaging industry in 2025?

Paperboard is expected to dominate the material segment with a 55% market share.

Who is the leading company in the premium packaging market?

Huhtamäki is the leading company in the market, holding a 15% industry share.

What is the projected CAGR of the premium packaging market in China?

China is projected to grow at a CAGR of 5.6% from 2025 to 2035.

Explore Similar Insights

Future Market Insights

Premium Packaging Market