Reports
- Global Locations -
Headquarters
Future Market Insights, Inc.
Christiana Corporate, 200
Continental Drive, Suite 401,
Newark, Delaware - 19713,
United States
Americas
Future Market Insights, Inc.
616 Corporate Way, Suite 2-9018,
Valley Cottage, NY 10989, United States
MEA
Future Market Insights
1602-6 Jumeirah Bay X2 Tower, Plot No: JLT-PH2-X2A,
Jumeirah Lakes Towers, Dubai,
United Arab Emirates
Europe
Future Market Insights
3rd Floor, 207 Regent Street,
W1B 3HH London
United Kingdom
Asia Pacific
Future Market Insights
Office No. 401-A, 4th Floor,
VANTAGE 9, S.No. 36/1/1,
Baner, Pune 411045, India
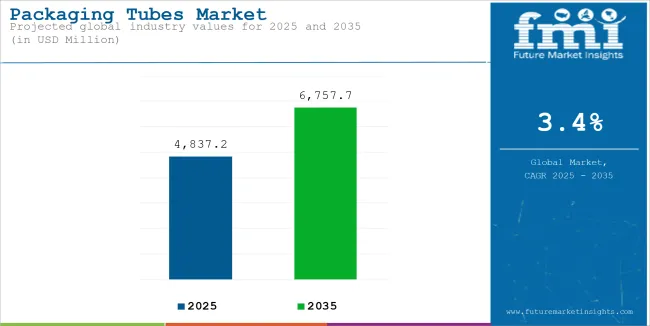
[388 Pages Report] The packaging tubes market is estimated at US$ 3.2 Bn in 2022 and is projected to reach US$ 4.4 Bn by 2028, at a CAGR of 5.0% from 2022 to 2028.
Attribute | Details |
---|---|
Market Size 2022 | US$ 3.2 billion |
Market Size 2028 | US$ 4.4 billion |
Value CAGR (2022-2028) | 5.0% |
Collective Value Share: Top 3 Countries (2022E) | 39% |
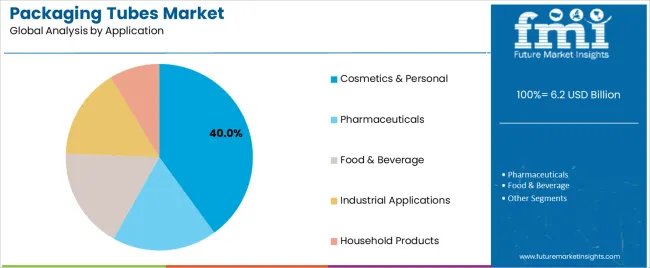
The study conducted by Future Market Insights estimates that the cosmetics, oral care and pharmaceutical end uses of packaging tubes market will cumulatively offer an incremental opportunity of around US$ 1 Bn during the period 2022-28 and these segments are projected to collectively capture approximately 4/5th market share of the global packaging tubes market by the end of 2028.
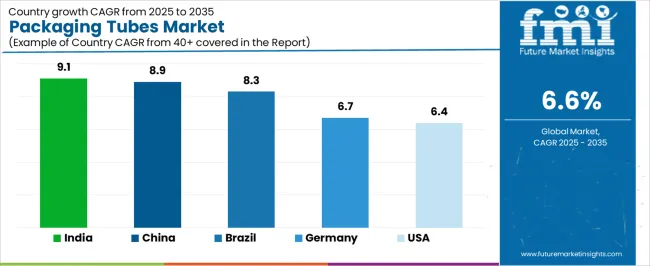
The APAC region is expected to drive the packaging tubes market and is estimated to hold a significant market share of around 31% in 2022. FMI team further estimates that in 2022, the China packaging tubes market will grow 7.2% year-over-year. Across the APAC region, the total valuation of the packaging tubes market is projected to reach US$ 1.4 Bn by 2028.
Don't pay for what you don't need
Customize your report by selecting specific countries or regions and save 30%!
Particulars | Details |
---|---|
H1 2021 | 6.0% |
H1 2022 Projected | 5.7% |
H1 2022 Expected | 5.9% |
BPS Change - H1, 2022 (O) – H1, 2022 (P) | (+) 20 ↑ |
BPS Change – H1, 2022 (O) – H1, 2021 | (-) 10 ↓ |
Future Market Insights predict a comparison and review analysis of the dynamics of the packaging tubes market, which is principally subjected to an array of industry factors along with a few definite influences regarding rising environmental concerns and stringent rules and regulations imposed by the government to minimize the impact of plastic packaging waste.
Some new developments that have taken place in the market include the introduction of bioplastics which are produced from renewable biomass sources, such as vegetable fats and oils, sawdust, straw, and recycled food waste and as they are not harmful to nature and are easily degradable as well. In May 2022, CCL Industries Inc. acquired Avery, a horticulture market specialities.
The market for packaging tubes is expected to decline by 10 basis share points (BPS) in H1-2022 (O) against comparison with H1-2021, according to an FMI analysis. However, when comparing H1-2022 projected and H1-2022 outlook period, an increase in BPS change by 20 BPS has been noticed.
The market for packaging tubes is expanding as it helps in extending the product shelf life by delivering superior barrier property along with protecting against bacteria and reducing light & oxygen transfer.
Despite these prospects, some likely challenges that stay ahead for the industry are the availability of alternative packaging systems such as sachets, packets and pouches which is expected to hinder the growth of the packaging tubes market.
Majorly driven by the elevated consumer demand for packaging tubes for the convenience it provides, FMI projects, the global packaging tubes market to expand at a prolific 5.0% CAGR between the forecast period of 2022 and 2028, in comparison to the CAGR of 4.1% registered between the period 2013 and 2021.
Fast-moving lifestyle and on-the-go culture globally has led to the consumer preference for easy to carry and handle packaging formats. Consumers are preferring packaging solutions like tubes and pouches for their daily use products, e.g. laundry wash gels, toothpaste, hair care products, fruit jams, etc.
These packaging solutions improve the convenience and user experience. The manufacturers are launching packaging tubes specifically designed for innovative applications like the packaging of sanitizers, food products, ointments and several other products. The cosmetic tubes are most popular among consumers for the ease in dispensing they offer for products with varied viscosity.
Packaging tubes are also widely used as an efficient oral care packaging solution for the convenience they offer to the consumers. The growing consumer preference for tube packaging solutions is one of the factors that is expected to drive the tube packaging market at a higher CAGR during the forecast period compared to the historical.
Increased competition between large multinational brands and local players led to the innovation in marketing strategies. Several new entrants in the pharmaceutical market also contributed to this intensified competition. The above-mentioned factors led to the solution for embracing the tube packaging format for pharmaceutical products.
The penetration of tubes in the pharmaceutical segment has shown lucrative growth globally. The ageing population and shift from hospital care to home care or inpatients to outpatients led to the increasing demand for a sophisticated and high barrier packaging solution for pharmaceuticals.
Laminated tubes provide high barrier protection for pharmaceutical contents packaged in the tube. The packaging tubes are used for several pharmaceutical products that are in cream, ointment or other high viscosity formats. The growing adoption of tubes for pharmaceutical packaging is anticipated to drive the demand for packaging tubes in the market.
The negative repercussions of the COVID-19 pandemic were moderate on the packaging tubes market compared to other industries. The significant application of packaging tubes in the cosmetics industry resulted in reducing the demand for the target product in the market.
However, the use of packaging tubes for pharmaceutical and food end-uses dampened the blow of the pandemic on the target market. Furthermore, the efforts of tube manufacturers like Ctl-Th Packaging SI and Albea SA among others in developing and supplying tubes for sanitizer packaging also contributed to dampening the impact of the pandemic on the packaging tubes market.
In the Western Europe region, Germany is the largest market for packaging tubes, with an estimated market share of around 20% by the end of 2022. As per the Germany Trade and Invest (GTAI), in 2019, Germany was a major European pharmaceutical market and the fourth largest globally. The pharmaceutical industry sales grew in the country grew 5.7% year-over-year in 2019 and reached US$ 52.5 Bn (~EUR 46.4 billion). The significant growth of the pharmaceutical industry in Germany is expected to augment the demand for packaging tubes for the pharmaceutical end-use.
FMI estimates that India is globally the third-largest market for packaging tubes after U.S. and China, with an estimated market share of 12% across the globe by the end of 2022. According to a report published by the Consulate General of Israel, Mumbai - Economic Department, the Indian beauty and personal care industry in the country is estimated to reach US$ 9.5 – 10.5 Bn in 2021, at a growth rate of 5-6% during the last five years. The growing beauty and personal care industry in the country is anticipated to bolster the market demand for packaging tubes in the country.
Get the data you need at a Fraction of the cost
Personalize your report by choosing insights you need
and save 40%!
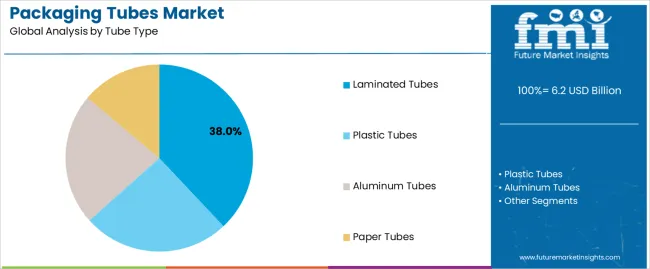
As per FMI analysis by product type, the laminated tubes segment is projected to experience escalated demand in the global packaging tubes market for its unique combination of high barrier properties from aluminium tubes and aesthetic appeal from the plastic tubes. In terms of valuation, the laminated tubes segment is estimated to grow at a compound annual growth rate of 6.1% during 2022-28 in the global packaging tubes market.
Cosmetics is a major end use of packaging tubes, this segment is estimated to offer an excellent incremental opportunity of over US$ 429 Mn during the forecast period 2022-28. The growing consciousness among the consumers of all age groups regarding appearance is one of the factors driving the demand for convenient cosmetic packaging solutions like tubes in the cosmetics industry.
By region, the Asia Pacific region is estimated to generate heavy demand for packaging tubes during 2022-28. APAC market for packaging tubes is projected to grow 1.6 times its current market size by the end of 2028. This is mainly because of the significant growth of the cosmetics and pharmaceutical industry of the developing countries like China, India and ASEAN countries in the APAC region.
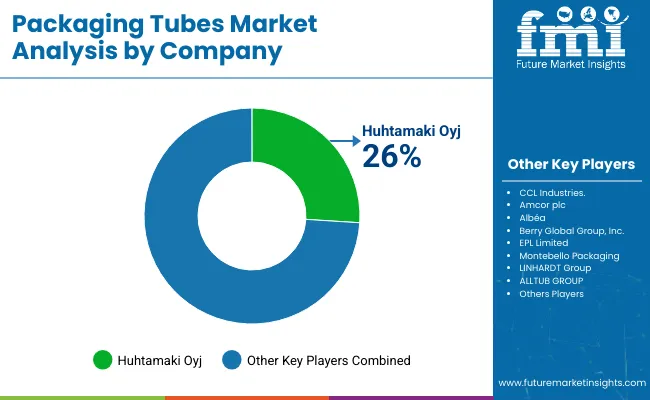
To get a competitive advantage in the packaging tubes market the manufacturers in the industry are adopting several strategies. The key players in the market are launching innovative packaging tubes that are manufactured with post-consumer recycled material or are fully recyclable. The key players are also involved in strategic partnerships with brand owners in the pharmaceutical, cosmetics and oral care industry to capture maximum market share.
For instance, in September 2021, Essel Propack Ltd. announced a partnership with Colgate-Palmolive India to produce recyclable Platina toothpaste tubes in India, furthermore, in November 2021, Essel Propack Ltd. in partnership with Vicco Labs launched 100% recyclable tube packaging for Vicco Turmeric product line.
In October 2020, Berry Global Inc., launched Divinity HDPE a 2-inch flip-top tube closure made from high-density polyethylene (HDPE) plastic, which when used in conjunction with Berry’s squeezable polyethylene (PE) tubes makes a sustainable single-substrate packaging solution.
Attribute | Details |
---|---|
Forecast Period | 2022-2028 |
Historical Data Available for | 2013-2021 |
Market Analysis | US$ Million for Value and million Units for Volume |
Key Regions Covered | North America, Latin America, Western Europe, Eastern Europe, Asia Pacific, the Middle East & Africa and Japan |
Key Countries Covered | United States, Canada, Brazil, Mexico, Germany, Italy, France, UK, Spain, Russia, Poland, GCC Countries, China and India |
Key Segments Covered | Product Type, Capacity, Closure Type, End Use, and Region |
Key Companies Profiled |
|
Report Coverage | Market Forecast, Company Share Analysis, Competition Intelligence, DROT Analysis, Market Dynamics and Challenges, and Strategic Growth Initiatives |
Customization & Pricing | Available upon Request |
By product type:
By capacity:
By closure type:
By end use:
By region:
1. Executive Summary 1.1. Global Market Outlook 1.2. Market Analysis 1.3. Analysis and Recommendations 2. Market Overview 2.1. Market Coverage 2.2. Market Definition 3. Key Market Trends 3.1. Key Trends Impacting the Market 3.2. Product Innovation Trends 4. Key Success Factors 4.1. Product Adoption Analysis 4.2. Product USPs / Features 5. Global Packaging Tubes Market Demand Analysis 2013-2021 and Forecast, 2022-2028 5.1. Historical Market Volume (Mn Units) Analysis, 2013-2021 5.2. Current and Future Market Volume (Mn Units) Projections, 2022-2028 5.3. Y-o-Y Growth Trend Analysis 6. Global Packaging Tubes Market - Pricing Analysis 6.1. Regional Pricing Analysis 6.2. Pricing Break-up 6.3. Global Average Pricing Analysis Benchmark 7. Global Packaging Tubes Market Demand (Value in US$ Mn) Analysis 2013-2021 and Forecast, 2022-2028 7.1. Historical Market Value (US$ Mn) Analysis, 2013-2021 7.2. Current and Future Market Value (US$ Mn) Projections, 2022-2028 7.2.1. Y-o-Y Growth Trend Analysis 7.2.2. Absolute $ Opportunity Analysis 8. Market Background 8.1. Global Packaging Market Outlook 8.2. Global Cosmetics and Personal Care Market Outlook 8.3. Macro-Economic Factors 8.3.1. Global GDP Growth Outlook 8.3.2. Retail Industry Outlook 8.3.3. Pharmaceutical Industry Growth Outlook 8.4. Forecast Factors - Relevance & Impact 8.4.1. Manufacturing Value Added Growth 8.4.2. Segmental Revenue Growth of Key Players 8.4.3. Cosmetics Industry Growth 8.5. Value Chain 8.5.1. Key Participants 8.5.1.1. Raw Material Suppliers 8.5.1.2. Packaging Tubes Manufacturers 8.5.1.3. Brand Owners 8.5.2. Profitability Margin 8.6. Market Dynamics 8.6.1. Drivers 8.6.2. Restraints 8.6.3. Opportunity Analysis 9. Impact of COVID-19 9.1. Current Statistics and Probable Future Impact 9.2. Impact of COVID-19 on Packaging Tubes Market 10. Global Packaging Tubes Market Analysis 2013-2021 and Forecast 2022-2028, by Product Type 10.1. Introduction / Key Findings 10.2. Historical Market Size (US$ Mn) and Volume (Mn Units) Analysis By Product Type, 2013-2021 10.3. Current and Future Market Size (US$ Mn) and Volume (Mn Units) Analysis and Forecast By Product Type, 2022-2028 10.3.1. Laminated Tubes 10.3.1.1. Plastic Barrier 10.3.1.2. Aluminium Barrier 10.3.2. Aluminium Tubes 10.3.3. Plastic Tubes 10.4. Market Attractiveness Analysis By Product Type 11. Global Packaging Tubes Market Analysis 2013-2021 and Forecast 2022-2028, by Capacity 11.1. Introduction 11.2. Historical Market Size (US$ Mn) and Volume (Mn Units) Analysis, by Capacity, 2013-2021 11.3. Current and Future Market Size (US$ Mn) and Volume (Mn Units) Analysis and Forecast, by Capacity, 2022-2028 11.3.1. Up to 50 ml 11.3.2. 51 ml to 100 ml 11.3.3. 101 ml to 150 ml 11.3.4. Above 150 ml 11.4. Market Attractiveness Analysis, by Capacity 12. Global Packaging Tubes Market Analysis 2013-2021 and Forecast 2022-2028, by Closure Type 12.1. Introduction 12.2. Historical Market Size (US$ Mn) and Volume (Mn Units) Analysis, by Closure Type, 2013-2021 12.3. Current and Future Market Size (US$ Mn) and Volume (Mn Units) Analysis and Forecast, by Closure Type, 2022-2028 12.3.1. Stand-up Caps 12.3.2. Nozzle Caps 12.3.3. Fez Caps 12.3.4. Flip-top Caps 12.3.5. Others 12.4. Market Attractiveness Analysis, by Closure Type 13. Global Packaging Tubes Market Analysis 2013-2021 and Forecast 2022-2028, by End Use 13.1. Introduction / Key Findings 13.2. Historical Market Size (US$ Mn) and Volume (Mn Units) Analysis By End Use, 2013-2021 13.3. Current and Future Market Size (US$ Mn) and Volume (Mn Units) Analysis and Forecast By End Use, 2022-2028 13.3.1. Cosmetics 13.3.1.1. Hair care 13.3.1.2. Skin Care 13.3.1.3. Others 13.3.2. Oral Care 13.3.3. Commercial 13.3.3.1. Sealants & Adhesives 13.3.3.2. Lubricants 13.3.3.3. Others 13.3.4. Pharmaceuticals 13.3.5. Home & Personal Care 13.3.6. Food 13.3.7. Others 13.4. Market Attractiveness Analysis By End Use 14. Global Packaging Tubes Market Analysis 2013-2021 and Forecast 2022-2028, by Region 14.1. Introduction 14.2. Historical Market Size (US$ Mn) and Volume (Mn Units) Analysis By Region, 2013-2021 14.3. Current Market Size (US$ Mn) and Volume (Mn Units) Analysis and Forecast By Region, 2022-2028 14.3.1. North America 14.3.2. Latin America 14.3.3. Western Europe 14.3.4. Eastern Europe 14.3.5. Asia Pacific 14.3.6. Middle East & Africa (MEA) 14.3.7. Japan 14.4. Market Attractiveness Analysis By Region 15. North America Packaging Tubes Market Analysis 2013-2021 and Forecast 2022-2028 15.1. Introduction 15.2. Historical Market Size (US$ Mn) and Volume (Mn Units) Trend Analysis By Market Taxonomy, 2013-2021 15.3. Market Size (US$ Mn) and Volume (Mn Units) Forecast By Market Taxonomy, 2022-2028 15.3.1. By Country 15.3.1.1. U.S. 15.3.1.2. Canada 15.3.2. By Product Type 15.3.3. By Capacity 15.3.4. By Closure Type 15.3.5. By End Use 15.4. Market Attractiveness Analysis 15.4.1. By Country 15.4.2. By Product Type 15.4.3. By Capacity 15.4.4. By Closure Type 15.4.5. By End Use 16. Latin America Packaging Tubes Market Analysis 2013-2021 and Forecast 2022-2028 16.1. Introduction 16.2. Historical Market Size (US$ Mn) and Volume (Mn Units) Trend Analysis By Market Taxonomy, 2013-2021 16.3. Market Size (US$ Mn) and Volume (Mn Units) Forecast By Market Taxonomy, 2022-2028 16.3.1. By Country 16.3.1.1. Brazil 16.3.1.2. Mexico 16.3.1.3. Rest of Latin America 16.3.2. By Product Type 16.3.3. By Capacity 16.3.4. By Closure Type 16.3.5. By End Use 16.4. Market Attractiveness Analysis 16.4.1. By Country 16.4.2. By Product Type 16.4.3. By Capacity 16.4.4. By Closure Type 16.4.5. By End Use 17. Western Europe Packaging Tubes Market Analysis 2013-2021 and Forecast 2022-2028 17.1. Introduction 17.2. Historical Market Size (US$ Mn) and Volume (Mn Units) Trend Analysis By Market Taxonomy, 2013-2021 17.3. Market Size (US$ Mn) and Volume (Mn Units) Forecast By Market Taxonomy, 2022-2028 17.3.1. By Country 17.3.1.1. Germany 17.3.1.2. Italy 17.3.1.3. France 17.3.1.4. Spain 17.3.1.5. NORDIC Countries 17.3.1.6. U.K. 17.3.1.7. BENELUX 17.3.1.8. Rest of Western Europe 17.3.2. By Product Type 17.3.3. By Capacity 17.3.4. By Closure Type 17.3.5. By End Use 17.4. Market Attractiveness Analysis 17.4.1. By Country 17.4.2. By Product Type 17.4.3. By Capacity 17.4.4. By Closure Type 17.4.5. By End Use 18. Eastern Europe Packaging Tubes Market Analysis 2013-2021 and Forecast 2022-2028 18.1. Introduction 18.2. Historical Market Size (US$ Mn) and Volume (Mn Units) Trend Analysis By Market Taxonomy, 2013-2021 18.3. Market Size (US$ Mn) and Volume (Mn Units) Forecast By Market Taxonomy, 2022-2028 18.3.1. By Country 18.3.1.1. Russia 18.3.1.2. Poland 18.3.1.3. Rest of Eastern Europe 18.3.2. By Product Type 18.3.3. By Capacity 18.3.4. By Closure Type 18.3.5. By End Use 18.4. Market Attractiveness Analysis 18.4.1. By Country 18.4.2. By Product Type 18.4.3. By Capacity 18.4.4. By Closure Type 18.4.5. By End Use 19. Middle East and Africa Packaging Tubes Market Analysis 2013-2021 and Forecast 2022-2028 19.1. Introduction 19.2. Historical Market Size (US$ Mn) and Volume (Mn Units) Trend Analysis By Market Taxonomy, 2013-2021 19.3. Market Size (US$ Mn) and Volume (Mn Units) Forecast By Market Taxonomy, 2022-2028 19.3.1. By Country 19.3.1.1. GCC Countries 19.3.1.2. Northern Africa 19.3.1.3. South Africa 19.3.1.4. Rest of Middle East and Africa 19.3.2. By Product Type 19.3.3. By Capacity 19.3.4. By Closure Type 19.3.5. By End Use 19.4. Market Attractiveness Analysis 19.4.1. By Country 19.4.2. By Product Type 19.4.3. By Capacity 19.4.4. By Closure Type 19.4.5. By End Use 20. Asia Pacific Packaging Tubes Market Analysis 2013-2021 and Forecast 2022-2028 20.1. Introduction 20.2. Historical Market Size (US$ Mn) and Volume (Mn Units) Trend Analysis By Market Taxonomy, 2013-2021 20.3. Market Size (US$ Mn) and Volume (Mn Units) Forecast By Market Taxonomy, 2022-2028 20.3.1. By Country 20.3.1.1. China 20.3.1.2. India 20.3.1.3. ASEAN 20.3.1.4. Australia & New Zealand 20.3.1.5. Rest of APAC 20.3.2. By Product Type 20.3.3. By Capacity 20.3.4. By Closure Type 20.3.5. By End Use 20.4. Market Attractiveness Analysis 20.4.1. By Country 20.4.2. By Product Type 20.4.3. By Capacity 20.4.4. By Closure Type 20.4.5. By End Use 21. Japan Packaging Tubes Market Analysis 2013-2021 and Forecast 2022-2028 21.1. Introduction 21.2. Historical Market Size (US$ Mn) and Volume (Mn Units) Trend Analysis By Market Taxonomy, 2013-2021 21.3. Market Size (US$ Mn) and Volume (Mn Units) Forecast By Market Taxonomy, 2022-2028 21.3.1. By Product Type 21.3.2. By Capacity 21.3.3. By Closure Type 21.3.4. By End Use 21.4. Market Attractiveness Analysis 21.4.1. By Product Type 21.4.2. By Capacity 21.4.3. By Closure Type 21.4.4. By End Use 22. Packaging Tubes Market Country wise Analysis 2022(E)-2028(F) 22.1. U.S. Packaging Tubes Packaging Market Analysis 22.1.1. Market Volume (Mn Units) and Value (US$ Mn) Analysis and Forecast, by Market Taxonomy 22.1.1.1. By Product Type 22.1.1.2. By Capacity 22.1.1.3. By Closure Type 22.1.1.4. By End Use 22.2. Canada Packaging Tubes Packaging Market Analysis 22.2.1. Market Volume (Mn Units) and Value (US$ Mn) Analysis and Forecast, by Market Taxonomy 22.2.1.1. By Product Type 22.2.1.2. By Capacity 22.2.1.3. By Closure Type 22.2.1.4. By End Use 22.3. Brazil Packaging Tubes Packaging Market Analysis 22.3.1. Market Volume (Mn Units) and Value (US$ Mn) Analysis and Forecast, by Market Taxonomy 22.3.1.1. By Product Type 22.3.1.2. By Capacity 22.3.1.3. By Closure Type 22.3.1.4. By End Use 22.4. Mexico Packaging Tubes Packaging Market Analysis 22.4.1. Market Volume (Mn Units) and Value (US$ Mn) Analysis and Forecast, by Market Taxonomy 22.4.1.1. By Product Type 22.4.1.2. By Capacity 22.4.1.3. By Closure Type 22.4.1.4. By End Use 22.5. Germany Packaging Tubes Packaging Market Analysis 22.5.1. Market Volume (Mn Units) and Value (US$ Mn) Analysis and Forecast, by Market Taxonomy 22.5.1.1. By Product Type 22.5.1.2. By Capacity 22.5.1.3. By Closure Type 22.5.1.4. By End Use 22.6. Italy Packaging Tubes Packaging Market Analysis 22.6.1. Market Volume (Mn Units) and Value (US$ Mn) Analysis and Forecast, by Market Taxonomy 22.6.1.1. By Product Type 22.6.1.2. By Capacity 22.6.1.3. By Closure Type 22.6.1.4. By End Use 22.7. France Packaging Tubes Packaging Market Analysis 22.7.1. Market Volume (Mn Units) and Value (US$ Mn) Analysis and Forecast, by Market Taxonomy 22.7.1.1. By Product Type 22.7.1.2. By Capacity 22.7.1.3. By Closure Type 22.7.1.4. By End Use 22.8. U.K. Packaging Tubes Packaging Market Analysis 22.8.1. Market Volume (Mn Units) and Value (US$ Mn) Analysis and Forecast, by Market Taxonomy 22.8.1.1. By Product Type 22.8.1.2. By Capacity 22.8.1.3. By Closure Type 22.8.1.4. By End Use 22.9. Spain Packaging Tubes Packaging Market Analysis 22.9.1. Market Volume (Mn Units) and Value (US$ Mn) Analysis and Forecast, by Market Taxonomy 22.9.1.1. By Product Type 22.9.1.2. By Capacity 22.9.1.3. By Closure Type 22.9.1.4. By End Use 22.10. Russia Packaging Tubes Packaging Market Analysis 22.10.1. Market Volume (Mn Units) and Value (US$ Mn) Analysis and Forecast, by Market Taxonomy 22.10.1.1. By Product Type 22.10.1.2. By Capacity 22.10.1.3. By Closure Type 22.10.1.4. By End Use 22.11. GCC Countries Packaging Tubes Packaging Market Analysis 22.11.1. Market Volume (Mn Units) and Value (US$ Mn) Analysis and Forecast, by Market Taxonomy 22.11.1.1. By Product Type 22.11.1.2. By Capacity 22.11.1.3. By Closure Type 22.11.1.4. By End Use 22.12. India Packaging Tubes Packaging Market Analysis 22.12.1. Market Volume (Mn Units) and Value (US$ Mn) Analysis and Forecast, by Market Taxonomy 22.12.1.1. By Product Type 22.12.1.2. By Capacity 22.12.1.3. By Closure Type 22.12.1.4. By End Use 22.13. China Packaging Tubes Packaging Market Analysis 22.13.1. Market Volume (Mn Units) and Value (US$ Mn) Analysis and Forecast, by Market Taxonomy 22.13.1.1. By Product Type 22.13.1.2. By Capacity 22.13.1.3. By Closure Type 22.13.1.4. By End Use 23. Market Structure Analysis 23.1. Market Analysis, by Tier of Packaging Tubes Companies 23.2. Market Share Analysis of Top Players 23.3. Market Presence Analysis 24. Competition Analysis 24.1. Competition Dashboard 24.2. Competition Benchmarking 24.3. Competition Deep Dive (Key Players) (Global Manufacturers) 24.3.1. Albea S.A. 24.3.1.1. Overview 24.3.1.2. Product Portfolio 24.3.1.3. Profitability by Market Segments 24.3.1.4. Sales Footprint 24.3.1.5. Strategy Overview 24.3.1.5.1. Marketing Strategy 24.3.1.5.2. Product Strategy 24.3.1.5.3. Channel Strategy 24.3.2. Essel Propack Ltd. 24.3.2.1. Overview 24.3.2.2. Product Portfolio 24.3.2.3. Profitability by Market Segments 24.3.2.4. Sales Footprint 24.3.2.5. Strategy Overview 24.3.2.5.1. Marketing Strategy 24.3.2.5.2. Product Strategy 24.3.2.5.3. Channel Strategy 24.3.3. CCL Industries Inc. 24.3.3.1. Overview 24.3.3.2. Product Portfolio 24.3.3.3. Profitability by Market Segments 24.3.3.4. Sales Footprint 24.3.3.5. Strategy Overview 24.3.3.5.1. Marketing Strategy 24.3.3.5.2. Product Strategy 24.3.3.5.3. Channel Strategy 24.3.4. Berry Global Inc. 24.3.4.1. Overview 24.3.4.2. Product Portfolio 24.3.4.3. Profitability by Market Segments 24.3.4.4. Sales Footprint 24.3.4.5. Strategy Overview 24.3.4.5.1. Marketing Strategy 24.3.4.5.2. Product Strategy 24.3.4.5.3. Channel Strategy 24.3.5. Ctl-Th Packaging Sl 24.3.5.1. Overview 24.3.5.2. Product Portfolio 24.3.5.3. Profitability by Market Segments 24.3.5.4. Sales Footprint 24.3.5.5. Strategy Overview 24.3.5.5.1. Marketing Strategy 24.3.5.5.2. Product Strategy 24.3.5.5.3. Channel Strategy 24.3.6. Linhardt GmbH & Co. KG 24.3.6.1. Overview 24.3.6.2. Product Portfolio 24.3.6.3. Profitability by Market Segments 24.3.6.4. Sales Footprint 24.3.6.5. Strategy Overview 24.3.6.5.1. Marketing Strategy 24.3.6.5.2. Product Strategy 24.3.6.5.3. Channel Strategy 24.3.7. Montebello Packaging 24.3.7.1. Overview 24.3.7.2. Product Portfolio 24.3.7.3. Profitability by Market Segments 24.3.7.4. Sales Footprint 24.3.7.5. Strategy Overview 24.3.7.5.1. Marketing Strategy 24.3.7.5.2. Product Strategy 24.3.7.5.3. Channel Strategy 24.3.8. Huhtamaki Oyj 24.3.8.1. Overview 24.3.8.2. Product Portfolio 24.3.8.3. Profitability by Market Segments 24.3.8.4. Sales Footprint 24.3.8.5. Strategy Overview 24.3.8.5.1. Marketing Strategy 24.3.8.5.2. Product Strategy 24.3.8.5.3. Channel Strategy 24.3.9. Intrapac International Corporation 24.3.9.1. Overview 24.3.9.2. Product Portfolio 24.3.9.3. Profitability by Market Segments 24.3.9.4. Sales Footprint 24.3.9.5. Strategy Overview 24.3.9.5.1. Marketing Strategy 24.3.9.5.2. Product Strategy 24.3.9.5.3. Channel Strategy 24.3.10. Plastube Inc. 24.3.10.1. Overview 24.3.10.2. Product Portfolio 24.3.10.3. Profitability by Market Segments 24.3.10.4. Sales Footprint 24.3.10.5. Strategy Overview 24.3.10.5.1. Marketing Strategy 24.3.10.5.2. Product Strategy 24.3.10.5.3. Channel Strategy 24.3.11. Pack-Tubes 24.3.11.1. Overview 24.3.11.2. Product Portfolio 24.3.11.3. Profitability by Market Segments 24.3.11.4. Sales Footprint 24.3.11.5. Strategy Overview 24.3.11.5.1. Marketing Strategy 24.3.11.5.2. Product Strategy 24.3.11.5.3. Channel Strategy 24.3.12. Perfektüp Ambalaj San. ve Tic.A.Ş. 24.3.12.1. Overview 24.3.12.2. Product Portfolio 24.3.12.3. Profitability by Market Segments 24.3.12.4. Sales Footprint 24.3.12.5. Strategy Overview 24.3.12.5.1. Marketing Strategy 24.3.12.5.2. Product Strategy 24.3.12.5.3. Channel Strategy 24.3.13. Burhani Group of Industries 24.3.13.1. Overview 24.3.13.2. Product Portfolio 24.3.13.3. Profitability by Market Segments 24.3.13.4. Sales Footprint 24.3.13.5. Strategy Overview 24.3.13.5.1. Marketing Strategy 24.3.13.5.2. Product Strategy 24.3.13.5.3. Channel Strategy 24.3.14. Tubapack A.S. 24.3.14.1. Overview 24.3.14.2. Product Portfolio 24.3.14.3. Profitability by Market Segments 24.3.14.4. Sales Footprint 24.3.14.5. Strategy Overview 24.3.14.5.1. Marketing Strategy 24.3.14.5.2. Product Strategy 24.3.14.5.3. Channel Strategy 24.3.15. Norway Pack AS 24.3.15.1. Overview 24.3.15.2. Product Portfolio 24.3.15.3. Profitability by Market Segments 24.3.15.4. Sales Footprint 24.3.15.5. Strategy Overview 24.3.15.5.1. Marketing Strategy 24.3.15.5.2. Product Strategy 24.3.15.5.3. Channel Strategy 24.3.16. Alltub Group 24.3.16.1. Overview 24.3.16.2. Product Portfolio 24.3.16.3. Profitability by Market Segments 24.3.16.4. Sales Footprint 24.3.16.5. Strategy Overview 24.3.16.5.1. Marketing Strategy 24.3.16.5.2. Product Strategy 24.3.16.5.3. Channel Strategy 24.3.17. Hoffmann Neopac Ag 24.3.17.1. Overview 24.3.17.2. Product Portfolio 24.3.17.3. Profitability by Market Segments 24.3.17.4. Sales Footprint 24.3.17.5. Strategy Overview 24.3.17.5.1. Marketing Strategy 24.3.17.5.2. Product Strategy 24.3.17.5.3. Channel Strategy 24.3.18. Tubopress Italia Spa 24.3.18.1. Overview 24.3.18.2. Product Portfolio 24.3.18.3. Profitability by Market Segments 24.3.18.4. Sales Footprint 24.3.18.5. Strategy Overview 24.3.18.5.1. Marketing Strategy 24.3.18.5.2. Product Strategy 24.3.18.5.3. Channel Strategy 24.3.19. Lajovic Tuba D.O.O. 24.3.19.1. Overview 24.3.19.2. Product Portfolio 24.3.19.3. Profitability by Market Segments 24.3.19.4. Sales Footprint 24.3.19.5. Strategy Overview 24.3.19.5.1. Marketing Strategy 24.3.19.5.2. Product Strategy 24.3.19.5.3. Channel Strategy 24.3.20. Pirlo GmbH & Co KG 24.3.20.1. Overview 24.3.20.2. Product Portfolio 24.3.20.3. Profitability by Market Segments 24.3.20.4. Sales Footprint 24.3.20.5. Strategy Overview 24.3.20.5.1. Marketing Strategy 24.3.20.5.2. Product Strategy 24.3.20.5.3. Channel Strategy *The above list is indicative in nature and is subject to change during the course of research 25. Assumptions and Acronyms Used 26. Research Methodology
Don't pay for what you don't need
Customize your report by selecting specific countries or regions and save 30%!
Table 01: Global Tubes Value (US$ Mn) and Volume (Bn Units) Forecast, by Product Type, 2013(H) – 2028(H) Table 02: Global Tubes Value (US$ Mn) and Volume (Bn Units) Forecast, by Capacity, 2013(H) – 2028(H) Table 03: Global Tubes Value (US$ Mn) and Volume (Bn Units) Forecast, by Closure Type, 2013(H) – 2028(H) Table 04: Global Tubes Value (US$ Mn) and Volume (Bn Units) Forecast, by End-use, 2013(H) – 2028(H) Table 05: Global Tubes Value (US$ Mn) and Volume (Bn Units) Forecast, by Region, 2013(H) – 2028(H) Table 06: North America Packaging Tubes Market Value (US$ Mn) and Volume (Mn Units) Forecast, by Country, 2013(H) – 2028(H) Table 07: North America Tubes Value (US$ Mn) and Volume (Mn Units) Forecast, by Product Type, 2013(H) – 2028(H) Table 08: North America Tubes Value (US$ Mn) and Volume (Mn Units) Forecast, by Capacity, 2013(H) – 2028(H) Table 09: North America Tubes Value (US$ Mn) and Volume (Mn Units) Forecast, by Closure Type, 2013(H) – 2028(H) Table 10: North America Tubes Value (US$ Mn) and Volume (Mn Units) Forecast, by End-use, 2013(H) – 2028(H) Table 11: Latin America Packaging Tubes Market Value (US$ Mn) and Volume (Mn Units) Forecast, by Country, 2013(H) – 2028(H) Table 12: Latin America Tubes Value (US$ Mn) and Volume (Mn Units) Forecast, by Product Type, 2013(H) – 2028(H) Table 13: Latin America Tubes Value (US$ Mn) and Volume (Mn Units) Forecast, by Capacity, 2013(H) – 2028(H) Table 14: Latin America Tubes Value (US$ Mn) and Volume (Mn Units) Forecast, by Closure Type, 2013(H) – 2028(H) Table 15: Latin America Tubes Value (US$ Mn) and Volume (Mn Units) Forecast, by End-use, 2013(H) – 2028(H) Table 16: Western Europe Packaging Tubes Market Value (US$ Mn) and Volume (Mn Units) Forecast, by Country, 2013(H) – 2028(H) Table 17: Western Europe Tubes Value (US$ Mn) and Volume (Mn Units) Forecast, by Product Type, 2013(H) – 2028(H) Table 18: Western Europe Tubes Value (US$ Mn) and Volume (Mn Units) Forecast, by Capacity, 2013(H) – 2028(H) Table 19: Western Europe Tubes Value (US$ Mn) and Volume (Mn Units) Forecast, by Closure Type, 2013(H) – 2028(H) Table 20: Western Europe Tubes Value (US$ Mn) and Volume (Mn Units) Forecast, by End-use, 2013(H) – 2028(H) Table 21: Eastern Europe Packaging Tubes Market Value (US$ Mn) and Volume (Mn Units) Forecast, by Country, 2013(H) – 2028(H) Table 22: Eastern Europe Tubes Value (US$ Mn) and Volume (Mn Units) Forecast, by Product Type, 2013(H) – 2028(H) Table 23: Eastern Europe Tubes Value (US$ Mn) and Volume (Mn Units) Forecast, by Capacity, 2013(H) – 2028(H) Table 24: Eastern Europe Tubes Value (US$ Mn) and Volume (Mn Units) Forecast, by Closure Type, 2013(H) – 2028(H) Table 25: Eastern Europe Tubes Value (US$ Mn) and Volume (Mn Units) Forecast, by End-use, 2013(H) – 2028(H) Table 26: MEA Packaging Tubes Market Value (US$ Mn) and Volume (Mn Units) Forecast, by Country, 2013(H) – 2028(H) Table 27: MEA Tubes Value (US$ Mn) and Volume (Mn Units) Forecast, by Product Type, 2013(H) – 2028(H) Table 28: MEA Tubes Value (US$ Mn) and Volume (Mn Units) Forecast, by Capacity, 2013(H) – 2028(H) Table 29: MEA Tubes Value (US$ Mn) and Volume (Mn Units) Forecast, by Closure Type, 2013(H) – 2028(H) Table 30: MEA Tubes Value (US$ Mn) and Volume (Mn Units) Forecast, by End-use, 2013(H) – 2028(H) Table 31: APAC Packaging Tubes Market Value (US$ Mn) and Volume (Mn Units) Forecast, by Country, 2013(H) – 2028(H) Table 32: APAC Tubes Value (US$ Mn) and Volume (Mn Units) Forecast, by Product Type, 2013(H) – 2028(H) Table 33: APAC Tubes Value (US$ Mn) and Volume (Mn Units) Forecast, by Capacity, 2013(H) – 2028(H) Table 34: APAC Tubes Value (US$ Mn) and Volume (Mn Units) Forecast, by Closure Type, 2013(H) – 2028(H) Table 35: APAC Tubes Value (US$ Mn) and Volume (Mn Units) Forecast, by End-use, 2013(H) – 2028(H) Table 36: Japan Tubes Value (US$ Mn) and Volume (Mn Units) Forecast, by Product Type, 2013(H) – 2028(H) Table 37: Japan Tubes Value (US$ Mn) and Volume (Mn Units) Forecast, by Capacity, 2013(H) – 2028(H) Table 38: Japan Tubes Value (US$ Mn) and Volume (Mn Units) Forecast, by Closure Type, 2013(H) – 2028(H) Table 39: Japan Tubes Value (US$ Mn) and Volume (Mn Units) Forecast, by End-use, 2013(H) – 2028(H)
Figure 01: Global Packaging Tubes Market, Market Share Analysis, by Product Type, 2022(E) & 2028(F) Figure 02: Global Packaging Tubes Market Attractiveness Index, by Product Type, 2022(E) – 2028(F) Figure 03: Global Packaging Tubes Market Incremental $ Opportunity Analysis, by Laminated Tubes Segment, 2022(E) – 2028(F) Figure 04: Global Packaging Tubes Market Share Analysis in 2022(E), by Laminated Tubes Sub-segments Figure 05: Global Packaging Tubes Market Incremental $ Opportunity Analysis, by Aluminium Tubes Segment, 2022(E) – 2028(F) Figure 06: Global Packaging Tubes Market Incremental $ Opportunity Analysis, by Plastic Tubes Segment, 2022(E) – 2028(F) Figure 07: Global Packaging Tubes Market, Market Share Analysis, by Capacity, 2022(E) & 2028(F) Figure 08: Global Packaging Tubes Market Attractiveness Index, by Capacity, 2022(E) – 2028(F) Figure 09: Global Packaging Tubes Market Incremental $ Opportunity Analysis, by Up to 50 ml Segment, 2022(E) – 2028(F) Figure 10: Global Packaging Tubes Market Incremental $ Opportunity Analysis, by 51 ml to 100 ml Segment, 2022(E) – 2028(F) Figure 11: Global Packaging Tubes Market Incremental $ Opportunity Analysis, by 101 ml to 150 ml Segment, 2022(E) – 2028(F) Figure 12: Global Packaging Tubes Market Incremental $ Opportunity Analysis, by Above 150 ml Segment, 2022(E) – 2028(F) Figure 13: Global Packaging Tubes Market, Market Share Analysis, by Closure Type, 2022(E) & 2028(F) Figure 14: Global Packaging Tubes Market Attractiveness Index, by Closure Type, 2022(E) – 2028(F) Figure 15: Global Packaging Tubes Market Incremental $ Opportunity Analysis, by Stand-up Cap Segment, 2022(E) – 2028(F) Figure 16: Global Packaging Tubes Market Incremental $ Opportunity Analysis, by Nozzle Cap Segment, 2022(E) – 2028(F) Figure 17: Global Packaging Tubes Market Incremental $ Opportunity Analysis, by Fez Cap Segment, 2022(E) – 2028(F) Figure 18: Global Packaging Tubes Market Incremental $ Opportunity Analysis, by Flip-top Cap Segment, 2022(E) – 2028(F) Figure 19: Global Packaging Tubes Market Incremental $ Opportunity Analysis, by Others Segment, 2022(E) – 2028(F) Figure 20: Global Packaging Tubes Market, Market Share Analysis, by End-use, 2022(E) & 2028(F) Figure 21: Global Packaging Tubes Market Attractiveness Index, by End-use, 2022(E) – 2028(F) Figure 22: Global Packaging Tubes Market Incremental $ Opportunity Analysis, by Cosmetics Segment, 2022(E) – 2028(F) Figure 23: Global Packaging Tubes Market Share Analysis, by Cosmetics Sub-segments, 2022(E) – 2028(F) Figure 24: Global Packaging Tubes Market Incremental $ Opportunity Analysis, by Commercial Segment, 2022(E) – 2028(F) Figure 25: Global Packaging Tubes Market Share Analysis, by Commercial Sub-segments Figure 26: Global Packaging Tubes Market Incremental $ Opportunity Analysis, by Oral Care Segment, 2022(E) – 2028(F) Figure 27: Global Packaging Tubes Market Incremental $ Opportunity Analysis, by Pharmaceuticals Segment, 2022(E) – 2028(F) Figure 28: Global Packaging Tubes Market Incremental $ Opportunity Analysis, by Home & personal care Segment, 2022(E) – 2028(F) Figure 29: Global Packaging Tubes Market Incremental $ Opportunity Analysis, by Food Segment, 2022(E) – 2028(F) Figure 30: Global Packaging Tubes Market Incremental $ Opportunity Analysis, by Others Segment, 2022(E) – 2028(F) Figure 31: Global Packaging Tubes Market, Market Share Analysis, by Region, 2022(E) & 2028(F) Figure 32: Global Packaging Tubes Market Attractiveness Index, by Region, 2022(E) – 2028(F) Figure 33: North America Packaging Tubes Market Share Analysis, by Product Type2021(A) Figure 34: North America Packaging Tubes Market Share Analysis, by Closure Type 2021(A) Figure 35: North America Packaging Tubes Market Share Analysis, by Capacity 2021(A) Figure 36: North America Packaging Tubes Market Share Analysis, by End-use 2021(A) Figure 37: North America Packaging Tubes Market Value (US$ Mn) and Volume (Units) analysis 2013(H) - 2021(A) Figure 38: North America Packaging Tubes Market Value (US$ Mn) and Volume (Units) Forecast, 2022(E) - 2028(F) Figure 39: North America Packaging Tubes Market Share Analysis, by Country, 2022(E) - 2028(F) Figure 40: North America Packaging Tubes Market Attractiveness Analysis, by Country, 2022(E)-2028(F) Figure 41: U.S. Packaging Tubes Market Incremental $ Opportunity Analysis, 2022(E) – 2028(F) Figure 42: Canada Packaging Tubes Market Incremental $ Opportunity Analysis, 2022(E) – 2028(F) Figure 43: North America Packaging Tubes Market, Market Share Analysis, by Product Type, 2022(E) & 2028(F) Figure 44: North America Packaging Tubes Market Attractiveness Index, by Product Type, 2022(E) – 2028(F) Figure 45: North America Packaging Tubes Market Incremental $ Opportunity Analysis, by Laminated Tubes Segment, 2022(E) – 2028(F) Figure 46: North America Packaging Tubes Market Share Analysis in 2022(E), by Laminated Tubes Sub-segments Figure 47: North America Packaging Tubes Market Incremental $ Opportunity Analysis, by Aluminium Tubes Segment, 2022(E) – 2028(F) Figure 48: North America Packaging Tubes Market Incremental $ Opportunity Analysis, by Plastic Tubes Segment, 2022(E) – 2028(F) Figure 49: North America Packaging Tubes Market, Market Share Analysis, by Capacity, 2022(E) & 2028(F) Figure 50: North America Packaging Tubes Market Attractiveness Index, by Capacity, 2022(E) – 2028(F) Figure 51: North America Packaging Tubes Market Incremental $ Opportunity Analysis, by Up to 50 ml Segment, 2022(E) – 2028(F) Figure 52: North America Packaging Tubes Market Incremental $ Opportunity Analysis, by 51 ml to 100 ml Segment, 2022(E) – 2028(F) Figure 53: North America Packaging Tubes Market Incremental $ Opportunity Analysis, by 101 ml to 150 ml Segment, 2022(E) – 2028(F) Figure 54: North America Packaging Tubes Market Incremental $ Opportunity Analysis, by Above 150 ml Segment, 2022(E) – 2028(F) Figure 55: North America Packaging Tubes Market, Market Share Analysis, by Closure Type, 2022(E) & 2028(F) Figure 56: North America Packaging Tubes Market Attractiveness Index, by Closure Type, 2022(E) – 2028(F) Figure 57: North America Packaging Tubes Market Incremental $ Opportunity Analysis, by Stand-up Cap Segment, 2022(E) – 2028(F) Figure 58: North America Packaging Tubes Market Incremental $ Opportunity Analysis, by Nozzle Cap Segment, 2022(E) – 2028(F) Figure 59: North America Packaging Tubes Market Incremental $ Opportunity Analysis, by Fez Cap Segment, 2022(E) – 2028(F) Figure 60: North America Packaging Tubes Market Incremental $ Opportunity Analysis, by Flip-top Cap Segment, 2022(E) – 2028(F) Figure 61: North America Packaging Tubes Market Incremental $ Opportunity Analysis, by Others Segment, 2022(E) – 2028(F) Figure 62: North America Packaging Tubes Market, Market Share Analysis, by End-use, 2022(E) & 2028(F) Figure 63: North America Packaging Tubes Market Attractiveness Index, by End-use, 2022(E) – 2028(F) Figure 64: North America Packaging Tubes Market Incremental $ Opportunity Analysis, by Cosmetics Segment, 2022(E) – 2028(F) Figure 65: North America Packaging Tubes Market Share Analysis in 2022(E), by Cosmetics Sub-segments Figure 66: North America Packaging Tubes Market Incremental $ Opportunity Analysis, by Commercial Segment, 2022(E) – 2028(F) Figure 67: North America Packaging Tubes Market Share Analysis in 2022(E), by Commercial Sub-segments Figure 68: North America Packaging Tubes Market Incremental $ Opportunity Analysis, by Oral Care Segment, 2022(E) – 2028(F) Figure 69: North America Packaging Tubes Market Incremental $ Opportunity Analysis, by Pharmaceuticals Segment, 2022(E) – 2028(F) Figure 70: North America Packaging Tubes Market Incremental $ Opportunity Analysis, by Home & personal care Segment, 2022(E) – 2028(F) Figure 71: North America Packaging Tubes Market Incremental $ Opportunity Analysis, by Food Segment, 2022(E) – 2028(F) Figure 72: North America Packaging Tubes Market Incremental $ Opportunity Analysis, by Others Segment, 2022(E) – 2028(F) Figure 73: Latin America Packaging Tubes Market Share Analysis, by Product Type 2021(A) Figure 74: Latin America Packaging Tubes Market Share Analysis, by Closure Type 2021(A) Figure 75: Latin America Packaging Tubes Market Share Analysis, by Capacity 2021(A) Figure 76: Latin America Packaging Tubes Market Share Analysis, by End-use 2021(A) Figure 77: Latin America Packaging Tubes Market Share Analysis, by Country 2021(A) Figure 78: Latin America Packaging Tubes Market Value (US$ Mn) and Volume (Units) analysis 2013(H) - 2021(A) Figure 79: Latin America Packaging Tubes Market Value (US$ Mn) and Volume (Units) Forecast, 2022(E) - 2028(F) Figure 80: Latin America Packaging Tubes Market Share Analysis, by Country, 2022(E) - 2028(F) Figure 81: Latin America Packaging Tubes Market Attractiveness Analysis, by Country, 2022(E)-2028(F), 2022(E) – 2028(F) Figure 82: Brazil Packaging Tubes Market Incremental $ Opportunity Analysis, 2022(E) – 2028(F) Figure 83: Mexico Packaging Tubes Market Incremental $ Opportunity Analysis, 2022(E) – 2028(F) Figure 84: Rest of Latin America Packaging Tubes Market Incremental $ Opportunity Analysis, 2022(E) – 2028(F) Figure 85: Latin America Packaging Tubes Market, Market Share Analysis, by Product Type, 2022(E) & 2028(F) Figure 86: Latin America Packaging Tubes Market Attractiveness Index, by Product Type, 2022(E) – 2028(F) Figure 87: Latin America Packaging Tubes Market Incremental $ Opportunity Analysis, by Laminated Tubes Segment, 2022(E) – 2028(F) Figure 88: Latin America Packaging Tubes Market Share Analysis in 2022(E), by Laminated Tubes Sub-segments Figure 89: Latin America Packaging Tubes Market Incremental $ Opportunity Analysis, by Aluminium Tubes Segment, 2022(E) – 2028(F) Figure 90: Latin America Packaging Tubes Market Incremental $ Opportunity Analysis, by Plastic Tubes Segment, 2022(E) – 2028(F) Figure 91: Latin America Packaging Tubes Market, Market Share Analysis, by Capacity, 2022(E) & 2028(F) Figure 92: Latin America Packaging Tubes Market Attractiveness Index, by Capacity, 2022(E) – 2028(F) Figure 93: Latin America Packaging Tubes Market Incremental $ Opportunity Analysis, by Up to 50 ml Segment, 2022(E) – 2028(F) Figure 94: Latin America Packaging Tubes Market Incremental $ Opportunity Analysis, by 51 ml to 100 ml Segment, 2022(E) – 2028(F) Figure 95: Latin America Packaging Tubes Market Incremental $ Opportunity Analysis, by 101 ml to 150 ml Segment, 2022(E) – 2028(F) Figure 96: Latin America Packaging Tubes Market Incremental $ Opportunity Analysis, by Above 150 ml Segment, 2022(E) – 2028(F) Figure 97: Latin America Packaging Tubes Market, Market Share Analysis, by Closure Type, 2022(E) & 2028(F) Figure 98: Latin America Packaging Tubes Market Attractiveness Index, by Closure Type, 2022(E) – 2028(F) Figure 99: Latin America Packaging Tubes Market Incremental $ Opportunity Analysis, by Stand-up Cap Segment, 2022(E) – 2028(F) Figure 100: Latin America Packaging Tubes Market Incremental $ Opportunity Analysis, by Nozzle Cap Segment, 2022(E) – 2028(F) Figure 101: Latin America Packaging Tubes Market Incremental $ Opportunity Analysis, by Fez Cap Segment, 2022(E) – 2028(F) Figure 102: Latin America Packaging Tubes Market Incremental $ Opportunity Analysis, by Flip-top Cap Segment, 2022(E) – 2028(F) Figure 103: Latin America Packaging Tubes Market Incremental $ Opportunity Analysis, by Others Segment, 2022(E) – 2028(F) Figure 104: Latin America Packaging Tubes Market, Market Share Analysis, by End-use, 2022(E) & 2028(F) Figure 105: Latin America Packaging Tubes Market Attractiveness Index, by End-use, 2022(E) – 2028(F) Figure 106: Latin America Packaging Tubes Market Incremental $ Opportunity Analysis, by Cosmetics Segment, 2022(E) – 2028(F) Figure 107: Latin America Packaging Tubes Market Share Analysis in 2022(E), by Cosmetics Sub-segments Figure 108: Latin America Packaging Tubes Market Incremental $ Opportunity Analysis, by Commercial Segment, 2022(E) – 2028(F) Figure 109: Latin America Packaging Tubes Market Share Analysis in 2022(E), by Commercial Sub-segments Figure 110: Latin America Packaging Tubes Market Incremental $ Opportunity Analysis, by Oral Care Segment, 2022(E) – 2028(F) Figure 111: Latin America Packaging Tubes Market Incremental $ Opportunity Analysis, by Pharmaceuticals Segment, 2022(E) – 2028(F) Figure 112: Latin America Packaging Tubes Market Incremental $ Opportunity Analysis, by Home & personal care Segment, 2022(E) – 2028(F) Figure 113: Latin America Packaging Tubes Market Incremental $ Opportunity Analysis, by Food Segment, 2022(E) – 2028(F) Figure 114: Latin America Packaging Tubes Market Incremental $ Opportunity Analysis, by Others Segment, 2022(E) – 2028(F) Figure 115: Western Europe Packaging Tubes Market Share Analysis, by Product Type 2021(A) Figure 116: Western Europe Packaging Tubes Market Share Analysis, by Closure Type 2021(A) Figure 117: Western Europe Packaging Tubes Market Share Analysis, by Capacity 2021(A) Figure 118: Western Europe Packaging Tubes Market Share Analysis, by End-use 2021(A) Figure 119: Western Europe Packaging Tubes Market Share Analysis, by Country 2021(A) Figure 120: Western Europe Packaging Tubes Market Value (US$ Mn) and Volume (Units) analysis 2013(H) - 2021(A) Figure 121: Western Europe Packaging Tubes Market Value (US$ Mn) and Volume (Units) Forecast, 2022(E) - 2028(F) Figure 122: Western Europe Packaging Tubes Market Share Analysis, by Country, 2022(E) - 2028(F) Figure 123: Western Europe Packaging Tubes Market Attractiveness Analysis, by Country, 2022(E)-2028(F), 2022(E) – 2028(F) Figure 124: Germany Packaging Tubes Market Incremental $ Opportunity Analysis, 2022(E) – 2028(F) Figure 125: Italy Packaging Tubes Market Incremental $ Opportunity Analysis, 2022(E) – 2028(F) Figure 126: France Packaging Tubes Market Incremental $ Opportunity Analysis, 2022(E) – 2028(F) Figure 127: UK Packaging Tubes Market Incremental $ Opportunity Analysis, 2022(E) – 2028(F) Figure 128: Spain Packaging Tubes Market Incremental $ Opportunity Analysis, 2022(E) – 2028(F) Figure 129: Benelux Packaging Tubes Market Incremental $ Opportunity Analysis, 2022(E) – 2028(F) Figure 130: Nordic Packaging Tubes Market Incremental $ Opportunity Analysis, 2022(E) – 2028(F) Figure 131: Rest of Western Europe Packaging Tubes Market Incremental $ Opportunity Analysis, 2022(E) – 2028(F) Figure 132: Western Europe Packaging Tubes Market, Market Share Analysis, by Product Type, 2022(E) & 2028(F) Figure 133: Western Europe Packaging Tubes Market Attractiveness Index, by Product Type, 2022(E) – 2028(F) Figure 134: Western Europe Packaging Tubes Market Incremental $ Opportunity Analysis, by Laminated Tubes Segment, 2022(E) – 2028(F) Figure 135: Western Europe Packaging Tubes Market Share Analysis in 2022(E), by Laminated Tubes Sub-segments Figure 136: Western Europe Packaging Tubes Market Incremental $ Opportunity Analysis, by Aluminium Tubes Segment, 2022(E) – 2028(F) Figure 137: Western Europe Packaging Tubes Market Incremental $ Opportunity Analysis, by Plastic Tubes Segment, 2022(E) – 2028(F) Figure 138: Western Europe Packaging Tubes Market, Market Share Analysis, by Capacity, 2022(E) & 2028(F) Figure 139: Western Europe Packaging Tubes Market Attractiveness Index, by Capacity, 2022(E) – 2028(F) Figure 140: Western Europe Packaging Tubes Market Incremental $ Opportunity Analysis, by Up to 50 ml Segment, 2022(E) – 2028(F) Figure 141: Western Europe Packaging Tubes Market Incremental $ Opportunity Analysis, by 51 ml to 100 ml Segment, 2022(E) – 2028(F) Figure 142: Western Europe Packaging Tubes Market Incremental $ Opportunity Analysis, by 101 ml to 150 ml Segment, 2022(E) – 2028(F) Figure 143: Western Europe Packaging Tubes Market Incremental $ Opportunity Analysis, by Above 150 ml Segment, 2022(E) – 2028(F) Figure 144: Western Europe Packaging Tubes Market, Market Share Analysis, by Closure Type, 2022(E) & 2028(F) Figure 145: Western Europe Packaging Tubes Market Attractiveness Index, by Closure Type, 2022(E) – 2028(F) Figure 146: Western Europe Packaging Tubes Market Incremental $ Opportunity Analysis, by Stand-up Cap Segment, 2022(E) – 2028(F) Figure 147: Western Europe Packaging Tubes Market Incremental $ Opportunity Analysis, by Nozzle Cap Segment, 2022(E) – 2028(F) Figure 148: Western Europe Packaging Tubes Market Incremental $ Opportunity Analysis, by Fez Cap Segment, 2022(E) – 2028(F) Figure 149: Western Europe Packaging Tubes Market Incremental $ Opportunity Analysis, by Flip-top Cap Segment, 2022(E) – 2028(F) Figure 150: Western Europe Packaging Tubes Market Incremental $ Opportunity Analysis, by Others Segment, 2022(E) – 2028(F) Figure 151: Western Europe Packaging Tubes Market, Market Share Analysis, by End-use, 2022(E) & 2028(F) Figure 152: Western Europe Packaging Tubes Market Attractiveness Index, by End-use, 2022(E) – 2028(F) Figure 153: Western Europe Packaging Tubes Market Incremental $ Opportunity Analysis, by Cosmetics Segment, 2022(E) – 2028(F) Figure 154: Western Europe Packaging Tubes Market Share Analysis in 2022(E), by Cosmetics Sub-segments Figure 155: Western Europe Packaging Tubes Market Incremental $ Opportunity Analysis, by Commercial Segment, 2022(E) – 2028(F) Figure 156: Western Europe Packaging Tubes Market Share Analysis in 2022(E), by Commercial Sub-segments Figure 157: Western Europe Packaging Tubes Market Incremental $ Opportunity Analysis, by Oral Care Segment, 2022(E) – 2028(F) Figure 158: Western Europe Packaging Tubes Market Incremental $ Opportunity Analysis, by Pharmaceuticals Segment, 2022(E) – 2028(F) Figure 159: Western Europe Packaging Tubes Market Incremental $ Opportunity Analysis, by Home & personal care Segment, 2022(E) – 2028(F) Figure 160: Western Europe Packaging Tubes Market Incremental $ Opportunity Analysis, by Food Segment, 2022(E) – 2028(F) Figure 161: Western Europe Packaging Tubes Market Incremental $ Opportunity Analysis, by Others Segment, 2022(E) – 2028(F) Figure 162: Eastern Europe Packaging Tubes Market Share Analysis, by Product Type 2021(A) Figure 163: Eastern Europe Packaging Tubes Market Share Analysis, by Closure Type 2021(A) Figure 164: Eastern Europe Packaging Tubes Market Share Analysis, by Capacity 2021(A) Figure 165: Eastern Europe Packaging Tubes Market Share Analysis, by End-use 2021(A) Figure 166: Eastern Europe Packaging Tubes Market Share Analysis, by Country 2021(A) Figure 167: Eastern Europe Packaging Tubes Market Value (US$ Mn) and Volume (Units) analysis 2013(H) - 2021(A) Figure 168: Eastern Europe Packaging Tubes Market Value (US$ Mn) and Volume (Units) Forecast, 2022(E) - 2028(F) Figure 169: Eastern Europe Packaging Tubes Market Share Analysis, by Country, 2022(E) - 2028(F) Figure 170: Eastern Europe Packaging Tubes Market Attractiveness Analysis, by Country, 2022(E)-2028(F), 2022(E) – 2028(F) Figure 171: Poland Packaging Tubes Market Incremental $ Opportunity Analysis, 2022(E) – 2028(F) Figure 172: Russia Packaging Tubes Market Incremental $ Opportunity Analysis, 2022(E) – 2028(F) Figure 173: Rest of Eastern Europe Packaging Tubes Market Incremental $ Opportunity Analysis, 2022(E) – 2028(F) Figure 174: Eastern Europe Packaging Tubes Market, Market Share Analysis, by Product Type, 2022(E) & 2028(F) Figure 175: Eastern Europe Packaging Tubes Market Attractiveness Index, by Product Type, 2022(E) – 2028(F) Figure 176: Eastern Europe Packaging Tubes Market Incremental $ Opportunity Analysis, by Laminated Tubes Segment, 2022(E) – 2028(F) Figure 177: Eastern Europe Packaging Tubes Market Share Analysis in 2022(E), by Laminated Tubes Sub-segments Figure 178: Eastern Europe Packaging Tubes Market Incremental $ Opportunity Analysis, by Aluminium Tubes Segment, 2022(E) – 2028(F) Figure 179: Eastern Europe Packaging Tubes Market Incremental $ Opportunity Analysis, by Plastic Tubes Segment, 2022(E) – 2028(F) Figure 180: Eastern Europe Packaging Tubes Market, Market Share Analysis, by Capacity, 2022(E) & 2028(F) Figure 181: Eastern Europe Packaging Tubes Market Attractiveness Index, by Capacity, 2022(E) – 2028(F) Figure 182: Eastern Europe Packaging Tubes Market Incremental $ Opportunity Analysis, by Up to 50 ml Segment, 2022(E) – 2028(F) Figure 183: Eastern Europe Packaging Tubes Market Incremental $ Opportunity Analysis, by 51 ml to 100 ml Segment, 2022(E) – 2028(F) Figure 184: Eastern Europe Packaging Tubes Market Incremental $ Opportunity Analysis, by 101 ml to 150 ml Segment, 2022(E) – 2028(F) Figure 185: Eastern Europe Packaging Tubes Market Incremental $ Opportunity Analysis, by Above 150 ml Segment, 2022(E) – 2028(F) Figure 186: Eastern Europe Packaging Tubes Market, Market Share Analysis, by Closure Type, 2022(E) & 2028(F) Figure 187: Eastern Europe Packaging Tubes Market Attractiveness Index, by Closure Type, 2022(E) – 2028(F) Figure 188: Eastern Europe Packaging Tubes Market Incremental $ Opportunity Analysis, by Stand-up Cap Segment, 2022(E) – 2028(F) Figure 189: Eastern Europe Packaging Tubes Market Incremental $ Opportunity Analysis, by Nozzle Cap Segment, 2022(E) – 2028(F) Figure 190: Eastern Europe Packaging Tubes Market Incremental $ Opportunity Analysis, by Fez Cap Segment, 2022(E) – 2028(F) Figure 191: Eastern Europe Packaging Tubes Market Incremental $ Opportunity Analysis, by Flip-top Cap Segment, 2022(E) – 2028(F) Figure 192: Eastern Europe Packaging Tubes Market Incremental $ Opportunity Analysis, by Others Segment, 2022(E) – 2028(F) Figure 193: Eastern Europe Packaging Tubes Market, Market Share Analysis, by End-use, 2022(E) & 2028(F) Figure 194: Eastern Europe Packaging Tubes Market Attractiveness Index, by End-use, 2022(E) – 2028(F) Figure 195: Eastern Europe Packaging Tubes Market Incremental $ Opportunity Analysis, by Cosmetics Segment, 2022(E) – 2028(F) Figure 196: Eastern Europe Packaging Tubes Market Share Analysis in 2022(E), by Cosmetics Sub-segments Figure 197: Eastern Europe Packaging Tubes Market Incremental $ Opportunity Analysis, by Commercial Segment, 2022(E) – 2028(F) Figure 198: Eastern Europe Packaging Tubes Market Share Analysis in 2022(E), by Commercial Sub-segments Figure 199: Eastern Europe Packaging Tubes Market Incremental $ Opportunity Analysis, by Oral Care Segment, 2022(E) – 2028(F) Figure 200: Eastern Europe Packaging Tubes Market Incremental $ Opportunity Analysis, by Pharmaceuticals Segment, 2022(E) – 2028(F) Figure 201: Eastern Europe Packaging Tubes Market Incremental $ Opportunity Analysis, by Home & personal care Segment, 2022(E) – 2028(F) Figure 202: Eastern Europe Packaging Tubes Market Incremental $ Opportunity Analysis, by Food Segment, 2022(E) – 2028(F) Figure 203: Eastern Europe Packaging Tubes Market Incremental $ Opportunity Analysis, by Others Segment, 2022(E) – 2028(F) Figure 204: MEA Packaging Tubes Market Share Analysis, by Product Type 2021(A) Figure 205: MEA Packaging Tubes Market Share Analysis, by Closure Type 2021(A) Figure 206: MEA Packaging Tubes Market Share Analysis, by Capacity 2021(A) Figure 207: MEA Packaging Tubes Market Share Analysis, by End-use 2021(A) Figure 208: MEA Packaging Tubes Market Share Analysis, by Country 2021(A) Figure 209: MEA Packaging Tubes Market Value (US$ Mn) and Volume (Units) analysis 2013(H) - 2021(A) Figure 210: MEA Packaging Tubes Market Value (US$ Mn) and Volume (Units) Forecast, 2022(E) - 2028(F) Figure 211: MEA Packaging Tubes Market Share Analysis, by Country, 2022(E) - 2028(F) Figure 212: MEA Packaging Tubes Market Attractiveness Analysis, by Country, 2022(E)-2028(F), 2022(E) – 2028(F) Figure 213: GCC Countries Packaging Tubes Market Incremental $ Opportunity Analysis, 2022(E) – 2028(F) Figure 214: South Africa Packaging Tubes Market Incremental $ Opportunity Analysis, 2022(E) – 2028(F) Figure 215: North Africa Packaging Tubes Market Incremental $ Opportunity Analysis, 2022(E) – 2028(F) Figure 216: Rest of MEA Packaging Tubes Market Incremental $ Opportunity Analysis, 2022(E) – 2028(F) Figure 217: MEA Packaging Tubes Market, Market Share Analysis, by Product Type, 2022(E) & 2028(F) Figure 218: MEA Packaging Tubes Market Attractiveness Index, by Product Type, 2022(E) – 2028(F) Figure 219: MEA Packaging Tubes Market Incremental $ Opportunity Analysis, by Laminated Tubes Segment, 2022(E) – 2028(F) Figure 220: MEA Packaging Tubes Market Share Analysis in 2022(E), by Laminated Tubes Sub-segments Figure 221: MEA Packaging Tubes Market Incremental $ Opportunity Analysis, by Aluminium Tubes Segment, 2022(E) – 2028(F) Figure 222: MEA Packaging Tubes Market Incremental $ Opportunity Analysis, by Plastic Tubes Segment, 2022(E) – 2028(F) Figure 223: MEA Packaging Tubes Market, Market Share Analysis, by Capacity, 2022(E) & 2028(F) Figure 224: MEA Packaging Tubes Market Attractiveness Index, by Capacity, 2022(E) – 2028(F) Figure 225: MEA Packaging Tubes Market Incremental $ Opportunity Analysis, by Up to 50 ml Segment, 2022(E) – 2028(F) Figure 226: MEA Packaging Tubes Market Incremental $ Opportunity Analysis, by 51 ml to 100 ml Segment, 2022(E) – 2028(F) Figure 227: MEA Packaging Tubes Market Incremental $ Opportunity Analysis, by 101 ml to 150 ml Segment, 2022(E) – 2028(F) Figure 228: MEA Packaging Tubes Market Incremental $ Opportunity Analysis, by Above 150 ml Segment, 2022(E) – 2028(F) Figure 229: MEA Packaging Tubes Market, Market Share Analysis, by Closure Type, 2022(E) & 2028(F) Figure 230: MEA Packaging Tubes Market Attractiveness Index, by Closure Type, 2022(E) – 2028(F) Figure 231: MEA Packaging Tubes Market Incremental $ Opportunity Analysis, by Stand-up Cap Segment, 2022(E) – 2028(F) Figure 232: MEA Packaging Tubes Market Incremental $ Opportunity Analysis, by Nozzle Cap Segment, 2022(E) – 2028(F) Figure 233: MEA Packaging Tubes Market Incremental $ Opportunity Analysis, by Fez Cap Segment, 2022(E) – 2028(F) Figure 234: MEA Packaging Tubes Market Incremental $ Opportunity Analysis, by Flip-top Cap Segment, 2022(E) – 2028(F) Figure 235: MEA Packaging Tubes Market Incremental $ Opportunity Analysis, by Others Segment, 2022(E) – 2028(F) Figure 236: MEA Packaging Tubes Market, Market Share Analysis, by End-use, 2022(E) & 2028(F) Figure 237: MEA Packaging Tubes Market Attractiveness Index, by End-use, 2022(E) – 2028(F) Figure 238: MEA Packaging Tubes Market Incremental $ Opportunity Analysis, by Cosmetics Segment, 2022(E) – 2028(F) Figure 239: MEA Packaging Tubes Market Share Analysis in 2022(E), by Cosmetics Sub-segments Figure 240: MEA Packaging Tubes Market Incremental $ Opportunity Analysis, by Commercial Segment, 2022(E) – 2028(F) Figure 241: MEA Packaging Tubes Market Share Analysis in 2022(E), by Commercial Sub-segments Figure 242: MEA Packaging Tubes Market Incremental $ Opportunity Analysis, by Oral Care Segment, 2022(E) – 2028(F) Figure 243: MEA Packaging Tubes Market Incremental $ Opportunity Analysis, by Pharmaceuticals Segment, 2022(E) – 2028(F) Figure 244: MEA Packaging Tubes Market Incremental $ Opportunity Analysis, by Home & personal care Segment, 2022(E) – 2028(F) Figure 245: MEA Packaging Tubes Market Incremental $ Opportunity Analysis, by Food Segment, 2022(E) – 2028(F) Figure 246: MEA Packaging Tubes Market Incremental $ Opportunity Analysis, by Others Segment, 2022(E) – 2028(F) Figure 247: APAC Packaging Tubes Market Share Analysis, by Product Type 2021(A) Figure 248: APAC Packaging Tubes Market Share Analysis, by Closure Type 2021(A) Figure 249: APAC Packaging Tubes Market Share Analysis, by Capacity 2021(A) Figure 250: APAC Packaging Tubes Market Share Analysis, by End-use 2021(A) Figure 251: APAC Packaging Tubes Market Share Analysis, by Country 2021(A) Figure 252: APAC Packaging Tubes Market Value (US$ Mn) and Volume (Units) analysis 2013(H) - 2021(A) Figure 253: APAC Packaging Tubes Market Value (US$ Mn) and Volume (Units) Forecast, 2022(E) - 2028(F) Figure 254: APAC Packaging Tubes Market Share Analysis, by Country, 2022(E) - 2028(F) Figure 255: APAC Packaging Tubes Market Attractiveness Analysis, by Country, 2022(E)-2028(F), 2022(E) – 2028(F) Figure 256: China Packaging Tubes Market Incremental $ Opportunity Analysis, 2022(E) – 2028(F) Figure 257: India Packaging Tubes Market Incremental $ Opportunity Analysis, 2022(E) – 2028(F) Figure 258: ASEAN Packaging Tubes Market Incremental $ Opportunity Analysis, 2022(E) – 2028(F) Figure 259: Australia & New Zealand Packaging Tubes Market Incremental $ Opportunity Analysis, 2022(E) – 2028(F) Figure 260: Rest of APAC Packaging Tubes Market Incremental $ Opportunity Analysis, 2022(E) – 2028(F) Figure 261: APAC Packaging Tubes Market, Market Share Analysis, by Product Type, 2022(E) & 2028(F) Figure 262: APAC Packaging Tubes Market Attractiveness Index, by Product Type, 2022(E) – 2028(F) Figure 263: APAC Packaging Tubes Market Incremental $ Opportunity Analysis, by Laminated Tubes Segment, 2022(E) – 2028(F) Figure 264: APAC Packaging Tubes Market Share Analysis in 2022(E), by Laminated Tubes Sub-segments Figure 265: APAC Packaging Tubes Market Incremental $ Opportunity Analysis, by Aluminium Tubes Segment, 2022(E) – 2028(F) Figure 266: APAC Packaging Tubes Market Incremental $ Opportunity Analysis, by Plastic Tubes Segment, 2022(E) – 2028(F) Figure 267: APAC Packaging Tubes Market, Market Share Analysis, by Capacity, 2022(E) & 2028(F) Figure 268: APAC Packaging Tubes Market Attractiveness Index, by Capacity, 2022(E) – 2028(F) Figure 269: APAC Packaging Tubes Market Incremental $ Opportunity Analysis, by Up to 50 ml Segment, 2022(E) – 2028(F) Figure 270: APAC Packaging Tubes Market Incremental $ Opportunity Analysis, by 51 ml to 100 ml Segment, 2022(E) – 2028(F) Figure 271: APAC Packaging Tubes Market Incremental $ Opportunity Analysis, by 101 ml to 150 ml Segment, 2022(E) – 2028(F) Figure 272: APAC Packaging Tubes Market Incremental $ Opportunity Analysis, by Above 150 ml Segment, 2022(E) – 2028(F) Figure 273: APAC Packaging Tubes Market, Market Share Analysis, by Closure Type, 2022(E) & 2028(F) Figure 274: APAC Packaging Tubes Market Attractiveness Index, by Closure Type, 2022(E) – 2028(F) Figure 275: APAC Packaging Tubes Market Incremental $ Opportunity Analysis, by Stand-up Cap Segment, 2022(E) – 2028(F) Figure 276: APAC Packaging Tubes Market Incremental $ Opportunity Analysis, by Nozzle Cap Segment, 2022(E) – 2028(F) Figure 277: APAC Packaging Tubes Market Incremental $ Opportunity Analysis, by Fez Cap Segment, 2022(E) – 2028(F) Figure 278: APAC Packaging Tubes Market Incremental $ Opportunity Analysis, by Flip-top Cap Segment, 2022(E) – 2028(F) Figure 279: APAC Packaging Tubes Market Incremental $ Opportunity Analysis, by Others Segment, 2022(E) – 2028(F) Figure 280: APAC Packaging Tubes Market, Market Share Analysis, by End-use, 2022(E) & 2028(F) Figure 281: APAC Packaging Tubes Market Attractiveness Index, by End-use, 2022(E) – 2028(F) Figure 282: APAC Packaging Tubes Market Incremental $ Opportunity Analysis, by Cosmetics Segment, 2022(E) – 2028(F) Figure 283: APAC Packaging Tubes Market Share Analysis in 2022(E), by Cosmetics Sub-segments Figure 284: APAC Packaging Tubes Market Incremental $ Opportunity Analysis, by Commercial Segment, 2022(E) – 2028(F) Figure 285: APAC Packaging Tubes Market Share Analysis in 2022(E), by Commercial Sub-segments Figure 286: APAC Packaging Tubes Market Incremental $ Opportunity Analysis, by Oral Care Segment, 2022(E) – 2028(F) Figure 287: APAC Packaging Tubes Market Incremental $ Opportunity Analysis, by Pharmaceuticals Segment, 2022(E) – 2028(F) Figure 288: APAC Packaging Tubes Market Incremental $ Opportunity Analysis, by Home & personal care Segment, 2022(E) – 2028(F) Figure 289: APAC Packaging Tubes Market Incremental $ Opportunity Analysis, by Food Segment, 2022(E) – 2028(F) Figure 290: APAC Packaging Tubes Market Incremental $ Opportunity Analysis, by Others Segment, 2022(E) – 2028(F) Figure 291: Japan Packaging Tubes Market Share Analysis, by Product Type 2021(A) Figure 292: Japan Packaging Tubes Market Share Analysis, by Closure Type 2021(A) Figure 293: Japan Packaging Tubes Market Share Analysis, by Capacity 2021(A) Figure 294: Japan Packaging Tubes Market Share Analysis, by End-use 2021(A) Figure 295: Japan Packaging Tubes Market Value (US$ Mn) and Volume (Units) analysis 2013(H) - 2021(A) Figure 296: Japan Packaging Tubes Market Value (US$ Mn) and Volume (Units) Forecast, 2022(E) - 2028(F) Figure 297: Japan Packaging Tubes Market, Market Share Analysis, by Product Type, 2022(E) & 2028(F) Figure 298: Japan Packaging Tubes Market Attractiveness Index, by Product Type, 2022(E) – 2028(F) Figure 299: Japan Packaging Tubes Market Incremental $ Opportunity Analysis, by Laminated Tubes Segment, 2022(E) – 2028(F) Figure 300: Japan Packaging Tubes Market Share Analysis in 2022(E), by Laminated Tubes Sub-segments Figure 301: Japan Packaging Tubes Market Incremental $ Opportunity Analysis, by Aluminium Tubes Segment, 2022(E) – 2028(F) Figure 302: Japan Packaging Tubes Market Incremental $ Opportunity Analysis, by Plastic Tubes Segment, 2022(E) – 2028(F) Figure 303: Japan Packaging Tubes Market, Market Share Analysis, by Capacity, 2022(E) & 2028(F) Figure 304: Japan Packaging Tubes Market Attractiveness Index, by Capacity, 2022(E) – 2028(F) Figure 305: Japan Packaging Tubes Market Incremental $ Opportunity Analysis, by Up to 50 ml Segment, 2022(E) – 2028(F) Figure 306: Japan Packaging Tubes Market Incremental $ Opportunity Analysis, by 51 ml to 100 ml Segment, 2022(E) – 2028(F) Figure 307: Japan Packaging Tubes Market Incremental $ Opportunity Analysis, by 101 ml to 150 ml Segment, 2022(E) – 2028(F) Figure 308: Japan Packaging Tubes Market Incremental $ Opportunity Analysis, by Above 150 ml Segment, 2022(E) – 2028(F) Figure 309: Japan Packaging Tubes Market, Market Share Analysis, by Closure Type, 2022(E) & 2028(F) Figure 310: Japan Packaging Tubes Market Attractiveness Index, by Closure Type, 2022(E) – 2028(F) Figure 311: Japan Packaging Tubes Market Incremental $ Opportunity Analysis, by Stand-up Cap Segment, 2022(E) – 2028(F) Figure 312: Japan Packaging Tubes Market Incremental $ Opportunity Analysis, by Nozzle Cap Segment, 2022(E) – 2028(F) Figure 313: Japan Packaging Tubes Market Incremental $ Opportunity Analysis, by Fez Cap Segment, 2022(E) – 2028(F) Figure 314: Japan Packaging Tubes Market Incremental $ Opportunity Analysis, by Flip-top Cap Segment, 2022(E) – 2028(F) Figure 315: Japan Packaging Tubes Market Incremental $ Opportunity Analysis, by Others Segment, 2022(E) – 2028(F) Figure 316: Japan Packaging Tubes Market, Market Share Analysis, by End-use, 2022(E) & 2028(F) Figure 317: Japan Packaging Tubes Market Attractiveness Index, by End-use, 2022(E) – 2028(F) Figure 318: Japan Packaging Tubes Market Incremental $ Opportunity Analysis, by Cosmetics Segment, 2022(E) – 2028(F) Figure 319: Japan Packaging Tubes Market Share Analysis in 2022(E), by Cosmetics Sub-segments Figure 320: Japan Packaging Tubes Market Incremental $ Opportunity Analysis, by Commercial Segment, 2022(E) – 2028(F) Figure 321: Japan Packaging Tubes Market Share Analysis in 2022(E), by Commercial Sub-segments Figure 322: Japan Packaging Tubes Market Incremental $ Opportunity Analysis, by Oral Care Segment, 2022(E) – 2028(F) Figure 323: Japan Packaging Tubes Market Incremental $ Opportunity Analysis, by Pharmaceuticals Segment, 2022(E) – 2028(F) Figure 324: Japan Packaging Tubes Market Incremental $ Opportunity Analysis, by Home & personal care Segment, 2022(E) – 2028(F) Figure 325: Japan Packaging Tubes Market Incremental $ Opportunity Analysis, by Food Segment, 2022(E) – 2028(F) Figure 326: Japan Packaging Tubes Market Incremental $ Opportunity Analysis, by Others Segment, 2022(E) – 2028(F)
Recommendations
Explore Packaging Insights
View Reports