Halal Cosmetics Market
Analysis of the Halal Cosmetics Market by Skin Care, Body Care, Hair Care, Makeup, and Fragrance
Vegan and Cruelty Free Skincare, A Blue Ocean of Potential- Dive into the Competitive Landscape and Market Opportunities with FMI
Halal Cosmetics Market Outlook (2023 to 2033)
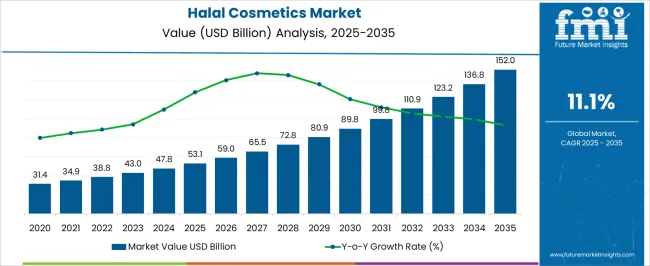
The global halal cosmetics market is anticipated to generate revenues of US$ 42.65 billion in 2023. Demand for halal cosmetics is projected to develop at a CAGR of 11.6% and reach US$ 127.8 billion by 2033.
Market Drivers Proliferating the Halal Cosmetics Adoption
The halal cosmetics sector is experiencing significant growth and presenting a unique outlook in the beauty and personal care industry. With a focus on products that adhere to Islamic principles and values, the market is expanding as consumers seek halal-certified cosmetic products that align with their religious and ethical beliefs.
- Key drivers include the increasing Muslim population globally, coupled with a rising awareness of Halal-certified products. This trend is fueled by factors such as a growing middle-class Muslim consumer base, urbanization, and changing lifestyles.
- The demand for halal cosmetics extends beyond Muslim consumers, as individuals from diverse backgrounds are embracing halal products due to their perceived safety, ethical sourcing, and natural ingredients.
- The market outlook is promising, as industry players focus on product innovation, research and development, and stringent halal certification processes. Companies are investing in developing a wide range of halal-compliant beauty and personal care products, including skincare, haircare, makeup, and fragrances.
- Market continues to evolve, untapped opportunities are emerging, including the expansion of halal cosmetics into mainstream retail channels, online platforms, and global markets.
Emerging Opportunities in the Halal Cosmetics Industry
- Increased Muslim population: The rising Muslim population globally, especially in countries with growing economies, creates a larger consumer base for halal cosmetics.
- Shifting consumer preferences: Consumers are increasingly seeking ethical and sustainable beauty products, driving the demand for halal cosmetics that align with their values.
- Regulatory support: Governments in some countries are implementing regulations and standards to support the halal cosmetics industry, providing a favorable environment for growth.
- Rise of halal certification bodies: The establishment of reputable halal certification bodies and organizations helps ensure the authenticity and credibility of halal cosmetics, boosting consumer confidence.
- Investment in research and development: Companies are investing in research and development to innovate and create new formulations, ingredients, and technologies for halal cosmetics.
- Consumer awareness and education: Increased awareness and education campaigns about the benefits of halal cosmetics are driving consumer interest and fostering market growth.
- Collaboration with Islamic organizations: Partnerships with Islamic organizations and institutions help strengthen the credibility of halal cosmetics and enhance market penetration.
- Tourism and travel industry opportunities: The tourism sector provides opportunities for halal cosmetics companies to cater to Muslim travelers' needs and preferences.
- Halal beauty influencers: The emergence of Halal beauty influencers and bloggers has created a platform for promoting and endorsing halal cosmetics, reaching a wider audience. Leveraging social media platforms and digital marketing strategies allows companies to connect with consumers, build brand awareness, and drive sales.
What are the Challenges Present in the Industry?
- Lack of standardized halal certification: The absence of globally standardized halal certification processes and regulations create challenges in ensuring consistent halal compliance across different regions and markets.
- Ingredient sourcing and traceability: Ensuring the halal status of ingredients throughout the supply chain is challenging, particularly for complex formulations and multinational companies sourcing from various suppliers.
- Consumer perception and awareness: Educating consumers about the benefits and authenticity of halal cosmetics is a challenge, as misconceptions or lack of awareness hinder market acceptance.
- Cultural and regional variations: Meeting the diverse preferences and cultural expectations of consumers across different regions limits the market, requiring customization and localization of product offerings.
- Counterfeit and non-compliant products: The presence of counterfeit or falsely labeled halal cosmetics in the market undermines consumer trust and poses challenges for genuine halal brands.
- Regulatory complexities: Navigating varying regulatory frameworks and requirements across different countries and regions adds complexity to product registration, labeling, and compliance processes.
- Limited distribution channels: Accessing and expanding distribution channels, especially in non-Muslim-majority regions, pose challenges in reaching target consumers and expanding market reach.
Attributes | Details |
---|---|
Halal Cosmetics Market CAGR (2023 to 2033) | 11.6% |
Halal Cosmetics Market Size (2023) | US$ 42.65 billion |
Halal Cosmetics Market Size (2033) | US$ 127.8 billion |
Don't pay for what you don't need
Customize your report by selecting specific countries or regions and save 30%!
Historical Expansion vs. Halal Cosmetics Industry Future Analysis (2018 to 2022 vs. 2023 to 2033)
Attributes | Details |
---|---|
Market CAGR (2018 to 2022) | 9.2% |
Market Share (2018) | US$ 26.87 billion |
Market Share (2022) | US$ 38.21 billion |
From 2018 to 2022, the halal cosmetics sector experienced significant growth, driven by increasing consumer awareness, expanding Muslim population, and demand for ethical beauty products. Companies expanded their product portfolios, invested in R&D, and capitalized on digital marketing and e-commerce platforms.
Looking ahead from 2023 to 2033, the market is expected to continue its upward trajectory. Key trends include product innovation, collaboration with Islamic organizations, regulatory harmonization, market expansion in non-Muslim-majority regions, and a focus on sustainability. Digital marketing, partnerships, and eco-friendly practices are vital for reaching consumers and ensuring market competitiveness.
Natural And Environmentally Friendly Cosmetics Are Becoming Increasingly Popular
- The global demand for natural and plant-based products has been gradually increasing over the last few decades. The demand for halal cosmetics has increased in recent years, as customers become more aware of sustainable living habits and the environmental challenges related to non-halal cosmetic items.
- Natural cosmetics and personal care products are required for a healthy lifestyle. In this regard, Halal-approved cosmetics are gaining popularity because they are generally made with natural components (without employing animal fat or harmful chemicals).
- To compete in the cosmetics industry, many firms provide cosmetic and personal care products that contain natural ingredients, such as plant extracts and minerals, and are vegan or halal certified.
Comparative View of the Market
Halal Cosmetics Market:
Attributes | Halal Cosmetics Market |
---|---|
CAGR (2023 to 2033) | 11.6% |
Market Value (2033) | US$ 127.80 billion |
Growth Factor | Surging desire for personal grooming |
Opportunity | Rising purchasing power |
Trends | Demand for eco-friendly products |
Halal Nutraceuticals and Vaccines Market:
Attributes | Halal Nutraceuticals and Vaccines Market |
---|---|
CAGR (2023 to 2033) | 4.2% |
Market Value (2033) | US$ 141.35 billion |
Growth Factor | Surging application in the food and beverage industry |
Opportunity | Rising application in digestive health |
Trends | Rising campaigns for consumer awareness |
Halal Food Market:
Attributes | Halal Food Market |
---|---|
CAGR (2023 to 2033) | 5.6% |
Market Value (2033) | US$ 3,000 billion |
Growth Factor | Rising demand for organic ingredients |
Opportunity | Shift toward healthy and convenient food |
Trends | Availability of grocery delivery options |
Regional Analysis
United States Halal Cosmetics Market Attract New Entrants
- The United States is expected to lead the North American halal cosmetics industry during the forecast period, attracting new entrants and capitalizing on business potential.
- There is a growing demand for vegan beauty and body products in the United States. This creates an opportunity for halal cosmetics manufacturers to develop cruelty-free brands and appeal to a wider consumer base.
- Manufacturers are expanding their focus beyond female cosmetics, targeting other segments, such as children, as consumer sentiment against animal testing gains traction.
- Natural cosmetics are also gaining popularity among consumers and manufacturers in the United States.
Asia Pacific Halal Cosmetics Industry Outlook:
- The Asia Pacific region is projected to dominate the global halal cosmetics sector by 2032, driven by the expanding Muslim population in Southeast Asian countries.
- Countries like India, Indonesia, and Malaysia are among the top spenders on halal beauty products, with increased expenditure and growing awareness about animal welfare and veganism driving market growth in the region.
Growth Outlook of the Halal Cosmetics Industry in Europe:
- The European market for halal cosmetics and personal care products is gradually expanding, with Germany adopting a cruelty-free culture and witnessing increasing demand for halal cosmetics.
- Germany, with its significant Muslim population, is still in the early stages of halal cosmetics business development due to limited awareness.
- The restricted sales channel and lesser understanding and trust of halal labeling compared to other product categories pose challenges for market players in Europe.
- German halal-certified brand VIE Halal is playing a significant role in shaping the halal trend both offline and online in the German market.
Get the data you need at a Fraction of the cost
Personalize your report by choosing insights you need
and save 40%!
Category-Wise Insights
Which Product Category Dominates the Halal Cosmetics Market?
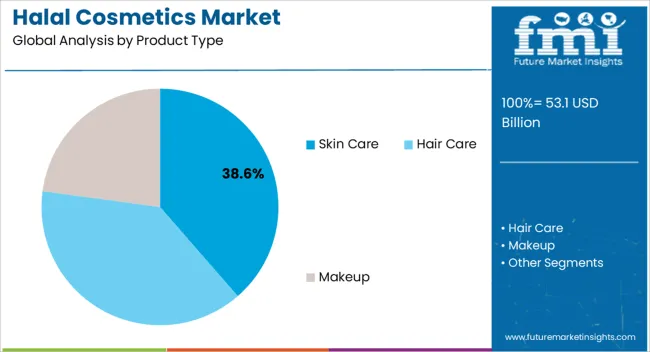
Halal skin care products are expected to dominate the halal cosmetics industry during the forecast period, driven by their widespread acceptance and high demand. They hold a significant share in terms of both volume and value. Additionally, the rising demand for sustainable, organic, vegan, and natural products has further fueled the popularity of halal skin care products. This trend is expected to continue, indicating the strong position of halal skin care products in the market.
Which End User Contributes the Most to the Halal Cosmetics Revenue Stream?
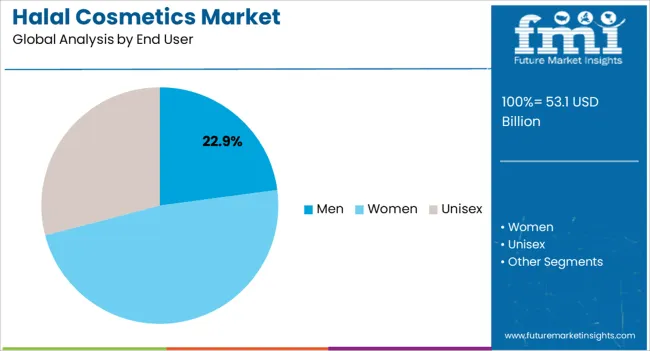
Both men and women prioritize halal skin care products as an essential part of their daily routines, contributing to the market's growth. Halal cosmetics have gained significant interest among millennials, who are increasingly seeking sustainable, organic, vegan, and natural products. The acceptance of halal cosmetics is a global trend, with demand across all demographics, indicating a promising future for the market.
Role of eCommerce in Evolving the Halal Cosmetics Market
- E-commerce has transformed business operations worldwide, with the COVID-19 pandemic accelerating its growth and adoption.
- The convenience and accessibility of online shopping have attracted a broader population, including those previously unfamiliar with e-commerce.
- There are ample opportunities for collaboration between halal cosmetics companies and online platforms to enhance consumer engagement and tailor products to meet their needs.
- Collaborations with internet forums and portals provide valuable insights into consumer preferences, leading to product improvements and increased brand visibility.
- Web portals partnering with well-known halal cosmetic brands attract a larger audience and benefit from the association.
How Halal Cosmetics Start-ups are Performing in the Market?
In the halal cosmetics Industry, there is a growing presence of startups and innovative firms that are introducing halal-certified cosmetics and makeup products, compliant with Islamic law. These companies are actively managing halal labeling and certification processes to cater to ingredient-conscious consumers.
To ensure their products are truly halal, they are utilizing halal ingredients and adopting halal packaging practices. A notable example is Amara Cosmetics, a halal-certified company that produces cosmetics approved by the Islamic Food and Nutrition Council of America (IFANCA). Their products are manufactured and packaged in California, adhering to Islamic law guidelines.
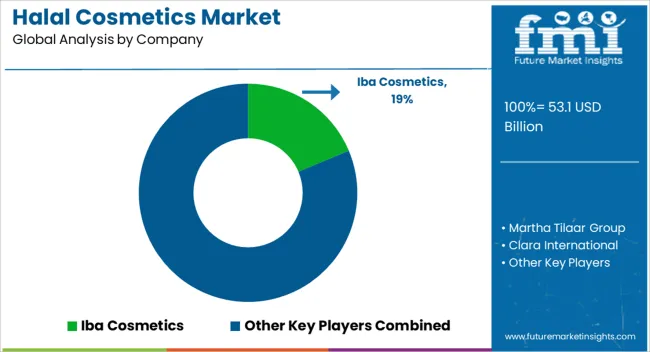
Competition Landscape
Halal Cosmetics Manufacturers Focusing on Brand Building for High Market Share
Key players in the halal cosmetics industry are employing a variety of techniques in order to thrive in a highly competitive climate. Companies are concentrating on innovations and advances to stay ahead of consumer demands, in order to build brand names and thrive in a competitive climate.
Halal cosmetics market players are also focused on merger and acquisition strategies in order to maximize their business operations and increase their in-house expertise. Companies are also actively participating in strategic alliances and partnerships to achieve a competitive edge through expanded corporate reach and services. Aside from them, new launches continue to be in high demand.
Recent Developments in the Market include:
- In August 2020, two ex-L'Oreal employees began producing halal-certified cosmetics. Shade Beauty was formed in Dubai and has already released 15 halal-certified, clean, PETA-approved, vegan, and cruelty-free matte liquid lipsticks.
- Kao Corporation, a Japanese manufacturer of halal-approved cosmetics, worked with Lion Corporation in August 2021 to develop recyclable packaging and reduce the planet's plastic footprint. Lion Corporation is a detergent, soap, pharmaceutical, and oral hygiene product maker.
Key players
- Iba Cosmetics
- Martha Tilaar Group
- Clara International
- Kao Corporation
- Andalou Naturals
- Ivy Beauty Corporation Sdn Bhd
- Nature’s Dream
- Prolab Cosmetics
- Inglot Cosmetics
- One Pure
- Talent Cosmetics
Key Segments
By Product Type:
- Skin Care
- Creams & Lotions
- Face Cleanser
- Others
- Hair Care
- Shampoo
- Conditioner
- Hair Oil
- Others
- Makeup
- Facial Products
- Eye Products
- Lip Products
- Nail Products
- Body Care
- Soaps
- Shower Gels
- Lotions
- Others
- Fragrance
By End User:
- Men
- Women
- Unisex
By Sales Channel:
- Hypermarkets/Supermarkets
- Convenience Stores
- Specialty Stores
- Multi-brand Stores
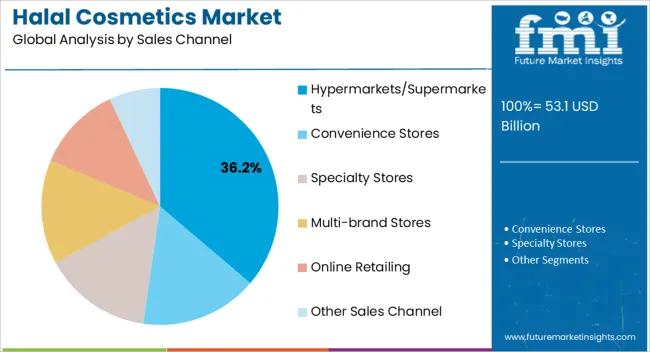
- Online Retailing
- Other Sales Channel
By Region:
- North America
- Latin America
- Europe
- South Asia
- East Asia
- Middle East & Africa (MEA)
- Oceania
Frequently Asked Questions
Which Factors are Driving the Halal Cosmetics Market?
Shifting consumers preferences and halal influencers are driving the global market.
How Much can Halal Cosmetics Market Grow by 2033?
The global market is projecting a significant CAGR of 11.6% by 2033.
What is the Current Halal Cosmetics Market Valuation?
The market is estimated to secure a valuation of US$ 42.65 million in 2023.
How Big will the Halal Cosmetics Market by 2033?
The market is estimated to reach US$ 127.8 million by 2033.
Which Application Segment Holds Lucrative Opportunities?
The men & women segment holds high revenue potential.
Table of Content
1. Executive Summary 1.1. Global Market Outlook 1.2. Demand-side Trends 1.3. Supply-side Trends 1.4. Technology Roadmap Analysis 1.5. Analysis and Recommendations 2. Market Overview 2.1. Market Coverage / Taxonomy 2.2. Market Definition / Scope / Limitations 3. Market Background 3.1. Market Dynamics 3.1.1. Drivers 3.1.2. Restraints 3.1.3. Opportunity 3.1.4. Trends 3.2. Scenario Forecast 3.2.1. Demand in Optimistic Scenario 3.2.2. Demand in Likely Scenario 3.2.3. Demand in Conservative Scenario 3.3. Opportunity Map Analysis 3.4. Product Life Cycle Analysis 3.5. Supply Chain Analysis 3.5.1. Supply Side Participants and their Roles 3.5.1.1. Producers 3.5.1.2. Mid-Level Participants (Traders/ Agents/ Brokers) 3.5.1.3. Wholesalers and Distributors 3.5.2. Value Added and Value Created at Node in the Supply Chain 3.5.3. List of Raw Material Suppliers 3.5.4. List of Existing and Potential Buyer’s 3.6. Investment Feasibility Matrix 3.7. Value Chain Analysis 3.7.1. Profit Margin Analysis 3.7.2. Wholesalers and Distributors 3.7.3. Retailers 3.8. PESTLE and Porter’s Analysis 3.9. Regulatory Landscape 3.9.1. By Key Regions 3.9.2. By Key Countries 3.10. Regional Parent Market Outlook 3.11. Production and Consumption Statistics 3.12. Import and Export Statistics 4. Global Market Analysis 2018 to 2022 and Forecast, 2023 to 2033 4.1. Historical Market Size Value (US$ Million) & Volume (Units) Analysis, 2018 to 2022 4.2. Current and Future Market Size Value (US$ Million) & Volume (Units) Projections, 2023 to 2033 4.2.1. Y-o-Y Growth Trend Analysis 4.2.2. Absolute $ Opportunity Analysis 5. Global Market Analysis 2018 to 2022 and Forecast 2023 to 2033, By Product Type 5.1. Introduction / Key Findings 5.2. Historical Market Size Value (US$ Million) & Volume (Units) Analysis By Product Type, 2018 to 2022 5.3. Current and Future Market Size Value (US$ Million) & Volume (Units) Analysis and Forecast By Product Type, 2023 to 2033 5.3.1. Personal Care Products 5.3.2. Color Cosmetics 5.3.3. Fragrances 5.4. Y-o-Y Growth Trend Analysis By Product Type, 2018 to 2022 5.5. Absolute $ Opportunity Analysis By Product Type, 2023 to 2033 6. Global Market Analysis 2018 to 2022 and Forecast 2023 to 2033, By Application 6.1. Introduction / Key Findings 6.2. Historical Market Size Value (US$ Million) & Volume (Units) Analysis By Application, 2018 to 2022 6.3. Current and Future Market Size Value (US$ Million) & Volume (Units) Analysis and Forecast By Application, 2023 to 2033 6.3.1. Hair Care 6.3.2. Skin Care 6.3.3. Face Care 6.3.4. Beauty Care 6.4. Y-o-Y Growth Trend Analysis By Application, 2018 to 2022 6.5. Absolute $ Opportunity Analysis By Application, 2023 to 2033 7. Global Market Analysis 2018 to 2022 and Forecast 2023 to 2033, By Distribution Channel 7.1. Introduction / Key Findings 7.2. Historical Market Size Value (US$ Million) & Volume (Units) Analysis By Distribution Channel, 2018 to 2022 7.3. Current and Future Market Size Value (US$ Million) & Volume (Units) Analysis and Forecast By Distribution Channel, 2023 to 2033 7.3.1. Offline 7.3.2. Online 7.4. Y-o-Y Growth Trend Analysis By Distribution Channel, 2018 to 2022 7.5. Absolute $ Opportunity Analysis By Distribution Channel, 2023 to 2033 8. Global Market Analysis 2018 to 2022 and Forecast 2023 to 2033, By Region 8.1. Introduction 8.2. Historical Market Size Value (US$ Million) & Volume (Units) Analysis By Region, 2018 to 2022 8.3. Current Market Size Value (US$ Million) & Volume (Units) Analysis and Forecast By Region, 2023 to 2033 8.3.1. North America 8.3.2. Latin America 8.3.3. Western Europe 8.3.4. Eastern Europe 8.3.5. South Asia and Pacific 8.3.6. East Asia 8.3.7. Middle East and Africa 8.4. Market Attractiveness Analysis By Region 9. North America Market Analysis 2018 to 2022 and Forecast 2023 to 2033, By Country 9.1. Historical Market Size Value (US$ Million) & Volume (Units) Trend Analysis By Market Taxonomy, 2018 to 2022 9.2. Market Size Value (US$ Million) & Volume (Units) Forecast By Market Taxonomy, 2023 to 2033 9.2.1. By Country 9.2.1.1. U.S. 9.2.1.2. Canada 9.2.2. By Product Type 9.2.3. By Application 9.2.4. By Distribution Channel 9.3. Market Attractiveness Analysis 9.3.1. By Country 9.3.2. By Product Type 9.3.3. By Application 9.3.4. By Distribution Channel 9.4. Key Takeaways 10. Latin America Market Analysis 2018 to 2022 and Forecast 2023 to 2033, By Country 10.1. Historical Market Size Value (US$ Million) & Volume (Units) Trend Analysis By Market Taxonomy, 2018 to 2022 10.2. Market Size Value (US$ Million) & Volume (Units) Forecast By Market Taxonomy, 2023 to 2033 10.2.1. By Country 10.2.1.1. Brazil 10.2.1.2. Mexico 10.2.1.3. Rest of Latin America 10.2.2. By Product Type 10.2.3. By Application 10.2.4. By Distribution Channel 10.3. Market Attractiveness Analysis 10.3.1. By Country 10.3.2. By Product Type 10.3.3. By Application 10.3.4. By Distribution Channel 10.4. Key Takeaways 11. Western Europe Market Analysis 2018 to 2022 and Forecast 2023 to 2033, By Country 11.1. Historical Market Size Value (US$ Million) & Volume (Units) Trend Analysis By Market Taxonomy, 2018 to 2022 11.2. Market Size Value (US$ Million) & Volume (Units) Forecast By Market Taxonomy, 2023 to 2033 11.2.1. By Country 11.2.1.1. Germany 11.2.1.2. U.K. 11.2.1.3. France 11.2.1.4. Spain 11.2.1.5. Italy 11.2.1.6. Rest of Western Europe 11.2.2. By Product Type 11.2.3. By Application 11.2.4. By Distribution Channel 11.3. Market Attractiveness Analysis 11.3.1. By Country 11.3.2. By Product Type 11.3.3. By Application 11.3.4. By Distribution Channel 11.4. Key Takeaways 12. Eastern Europe Market Analysis 2018 to 2022 and Forecast 2023 to 2033, By Country 12.1. Historical Market Size Value (US$ Million) & Volume (Units) Trend Analysis By Market Taxonomy, 2018 to 2022 12.2. Market Size Value (US$ Million) & Volume (Units) Forecast By Market Taxonomy, 2023 to 2033 12.2.1. By Country 12.2.1.1. Poland 12.2.1.2. Russia 12.2.1.3. Czech Republic 12.2.1.4. Romania 12.2.1.5. Rest of Eastern Europe 12.2.2. By Product Type 12.2.3. By Application 12.2.4. By Distribution Channel 12.3. Market Attractiveness Analysis 12.3.1. By Country 12.3.2. By Product Type 12.3.3. By Application 12.3.4. By Distribution Channel 12.4. Key Takeaways 13. South Asia and Pacific Market Analysis 2018 to 2022 and Forecast 2023 to 2033, By Country 13.1. Historical Market Size Value (US$ Million) & Volume (Units) Trend Analysis By Market Taxonomy, 2018 to 2022 13.2. Market Size Value (US$ Million) & Volume (Units) Forecast By Market Taxonomy, 2023 to 2033 13.2.1. By Country 13.2.1.1. India 13.2.1.2. Bangladesh 13.2.1.3. Australia 13.2.1.4. New Zealand 13.2.1.5. Rest of South Asia and Pacific 13.2.2. By Product Type 13.2.3. By Application 13.2.4. By Distribution Channel 13.3. Market Attractiveness Analysis 13.3.1. By Country 13.3.2. By Product Type 13.3.3. By Application 13.3.4. By Distribution Channel 13.4. Key Takeaways 14. East Asia Market Analysis 2018 to 2022 and Forecast 2023 to 2033, By Country 14.1. Historical Market Size Value (US$ Million) & Volume (Units) Trend Analysis By Market Taxonomy, 2018 to 2022 14.2. Market Size Value (US$ Million) & Volume (Units) Forecast By Market Taxonomy, 2023 to 2033 14.2.1. By Country 14.2.1.1. China 14.2.1.2. Japan 14.2.1.3. South Korea 14.2.2. By Product Type 14.2.3. By Application 14.2.4. By Distribution Channel 14.3. Market Attractiveness Analysis 14.3.1. By Country 14.3.2. By Product Type 14.3.3. By Application 14.3.4. By Distribution Channel 14.4. Key Takeaways 15. Middle East and Africa Market Analysis 2018 to 2022 and Forecast 2023 to 2033, By Country 15.1. Historical Market Size Value (US$ Million) & Volume (Units) Trend Analysis By Market Taxonomy, 2018 to 2022 15.2. Market Size Value (US$ Million) & Volume (Units) Forecast By Market Taxonomy, 2023 to 2033 15.2.1. By Country 15.2.1.1. GCC Countries 15.2.1.2. South Africa 15.2.1.3. Israel 15.2.1.4. Rest of MEA 15.2.2. By Product Type 15.2.3. By Application 15.2.4. By Distribution Channel 15.3. Market Attractiveness Analysis 15.3.1. By Country 15.3.2. By Product Type 15.3.3. By Application 15.3.4. By Distribution Channel 15.4. Key Takeaways 16. Key Countries Market Analysis 16.1. U.S. 16.1.1. Pricing Analysis 16.1.2. Market Share Analysis, 2022 16.1.2.1. By Product Type 16.1.2.2. By Application 16.1.2.3. By Distribution Channel 16.2. Canada 16.2.1. Pricing Analysis 16.2.2. Market Share Analysis, 2022 16.2.2.1. By Product Type 16.2.2.2. By Application 16.2.2.3. By Distribution Channel 16.3. Brazil 16.3.1. Pricing Analysis 16.3.2. Market Share Analysis, 2022 16.3.2.1. By Product Type 16.3.2.2. By Application 16.3.2.3. By Distribution Channel 16.4. Mexico 16.4.1. Pricing Analysis 16.4.2. Market Share Analysis, 2022 16.4.2.1. By Product Type 16.4.2.2. By Application 16.4.2.3. By Distribution Channel 16.5. Germany 16.5.1. Pricing Analysis 16.5.2. Market Share Analysis, 2022 16.5.2.1. By Product Type 16.5.2.2. By Application 16.5.2.3. By Distribution Channel 16.6. U.K. 16.6.1. Pricing Analysis 16.6.2. Market Share Analysis, 2022 16.6.2.1. By Product Type 16.6.2.2. By Application 16.6.2.3. By Distribution Channel 16.7. France 16.7.1. Pricing Analysis 16.7.2. Market Share Analysis, 2022 16.7.2.1. By Product Type 16.7.2.2. By Application 16.7.2.3. By Distribution Channel 16.8. Spain 16.8.1. Pricing Analysis 16.8.2. Market Share Analysis, 2022 16.8.2.1. By Product Type 16.8.2.2. By Application 16.8.2.3. By Distribution Channel 16.9. Italy 16.9.1. Pricing Analysis 16.9.2. Market Share Analysis, 2022 16.9.2.1. By Product Type 16.9.2.2. By Application 16.9.2.3. By Distribution Channel 16.10. Poland 16.10.1. Pricing Analysis 16.10.2. Market Share Analysis, 2022 16.10.2.1. By Product Type 16.10.2.2. By Application 16.10.2.3. By Distribution Channel 16.11. Russia 16.11.1. Pricing Analysis 16.11.2. Market Share Analysis, 2022 16.11.2.1. By Product Type 16.11.2.2. By Application 16.11.2.3. By Distribution Channel 16.12. Czech Republic 16.12.1. Pricing Analysis 16.12.2. Market Share Analysis, 2022 16.12.2.1. By Product Type 16.12.2.2. By Application 16.12.2.3. By Distribution Channel 16.13. Romania 16.13.1. Pricing Analysis 16.13.2. Market Share Analysis, 2022 16.13.2.1. By Product Type 16.13.2.2. By Application 16.13.2.3. By Distribution Channel 16.14. India 16.14.1. Pricing Analysis 16.14.2. Market Share Analysis, 2022 16.14.2.1. By Product Type 16.14.2.2. By Application 16.14.2.3. By Distribution Channel 16.15. Bangladesh 16.15.1. Pricing Analysis 16.15.2. Market Share Analysis, 2022 16.15.2.1. By Product Type 16.15.2.2. By Application 16.15.2.3. By Distribution Channel 16.16. Australia 16.16.1. Pricing Analysis 16.16.2. Market Share Analysis, 2022 16.16.2.1. By Product Type 16.16.2.2. By Application 16.16.2.3. By Distribution Channel 16.17. New Zealand 16.17.1. Pricing Analysis 16.17.2. Market Share Analysis, 2022 16.17.2.1. By Product Type 16.17.2.2. By Application 16.17.2.3. By Distribution Channel 16.18. China 16.18.1. Pricing Analysis 16.18.2. Market Share Analysis, 2022 16.18.2.1. By Product Type 16.18.2.2. By Application 16.18.2.3. By Distribution Channel 16.19. Japan 16.19.1. Pricing Analysis 16.19.2. Market Share Analysis, 2022 16.19.2.1. By Product Type 16.19.2.2. By Application 16.19.2.3. By Distribution Channel 16.20. South Korea 16.20.1. Pricing Analysis 16.20.2. Market Share Analysis, 2022 16.20.2.1. By Product Type 16.20.2.2. By Application 16.20.2.3. By Distribution Channel 16.21. GCC Countries 16.21.1. Pricing Analysis 16.21.2. Market Share Analysis, 2022 16.21.2.1. By Product Type 16.21.2.2. By Application 16.21.2.3. By Distribution Channel 16.22. South Africa 16.22.1. Pricing Analysis 16.22.2. Market Share Analysis, 2022 16.22.2.1. By Product Type 16.22.2.2. By Application 16.22.2.3. By Distribution Channel 16.23. Israel 16.23.1. Pricing Analysis 16.23.2. Market Share Analysis, 2022 16.23.2.1. By Product Type 16.23.2.2. By Application 16.23.2.3. By Distribution Channel 17. Market Structure Analysis 17.1. Competition Dashboard 17.2. Competition Benchmarking 17.3. Market Share Analysis of Top Players 17.3.1. By Regional 17.3.2. By Product Type 17.3.3. By Application 17.3.4. By Distribution Channel 18. Competition Analysis 18.1. Competition Deep Dive 18.1.1. Ivy Beauty Corporation Sdn Bhd 18.1.1.1. Overview 18.1.1.2. Product Portfolio 18.1.1.3. Profitability by Market Segments 18.1.1.4. Sales Footprint 18.1.1.5. Strategy Overview 18.1.1.5.1. Marketing Strategy 18.1.1.5.2. Product Strategy 18.1.1.5.3. Channel Strategy 18.1.2. Iba Cosmetics 18.1.2.1. Overview 18.1.2.2. Product Portfolio 18.1.2.3. Profitability by Market Segments 18.1.2.4. Sales Footprint 18.1.2.5. Strategy Overview 18.1.2.5.1. Marketing Strategy 18.1.2.5.2. Product Strategy 18.1.2.5.3. Channel Strategy 18.1.3. Talent Cosmetics 18.1.3.1. Overview 18.1.3.2. Product Portfolio 18.1.3.3. Profitability by Market Segments 18.1.3.4. Sales Footprint 18.1.3.5. Strategy Overview 18.1.3.5.1. Marketing Strategy 18.1.3.5.2. Product Strategy 18.1.3.5.3. Channel Strategy 18.1.4. Clara International Beauty Group 18.1.4.1. Overview 18.1.4.2. Product Portfolio 18.1.4.3. Profitability by Market Segments 18.1.4.4. Sales Footprint 18.1.4.5. Strategy Overview 18.1.4.5.1. Marketing Strategy 18.1.4.5.2. Product Strategy 18.1.4.5.3. Channel Strategy 18.1.5. Kao Corporation 18.1.5.1. Overview 18.1.5.2. Product Portfolio 18.1.5.3. Profitability by Market Segments 18.1.5.4. Sales Footprint 18.1.5.5. Strategy Overview 18.1.5.5.1. Marketing Strategy 18.1.5.5.2. Product Strategy 18.1.5.5.3. Channel Strategy 18.1.6. Amara Halal Cosmetics 18.1.6.1. Overview 18.1.6.2. Product Portfolio 18.1.6.3. Profitability by Market Segments 18.1.6.4. Sales Footprint 18.1.6.5. Strategy Overview 18.1.6.5.1. Marketing Strategy 18.1.6.5.2. Product Strategy 18.1.6.5.3. Channel Strategy 18.1.7. INIKA Organic 18.1.7.1. Overview 18.1.7.2. Product Portfolio 18.1.7.3. Profitability by Market Segments 18.1.7.4. Sales Footprint 18.1.7.5. Strategy Overview 18.1.7.5.1. Marketing Strategy 18.1.7.5.2. Product Strategy 18.1.7.5.3. Channel Strategy 18.1.8. Elaheh Halal 18.1.8.1. Overview 18.1.8.2. Product Portfolio 18.1.8.3. Profitability by Market Segments 18.1.8.4. Sales Footprint 18.1.8.5. Strategy Overview 18.1.8.5.1. Marketing Strategy 18.1.8.5.2. Product Strategy 18.1.8.5.3. Channel Strategy 18.1.9. Flora & Noor 18.1.9.1. Overview 18.1.9.2. Product Portfolio 18.1.9.3. Profitability by Market Segments 18.1.9.4. Sales Footprint 18.1.9.5. Strategy Overview 18.1.9.5.1. Marketing Strategy 18.1.9.5.2. Product Strategy 18.1.9.5.3. Channel Strategy 18.1.10. Martha Tilaar Group 18.1.10.1. Overview 18.1.10.2. Product Portfolio 18.1.10.3. Profitability by Market Segments 18.1.10.4. Sales Footprint 18.1.10.5. Strategy Overview 18.1.10.5.1. Marketing Strategy 18.1.10.5.2. Product Strategy 18.1.10.5.3. Channel Strategy 19. Assumptions & Acronyms Used 20. Research Methodology
Don't pay for what you don't need
Customize your report by selecting specific countries or regions and save 30%!
List of Tables
Table 1: Global Market Value (US$ Million) Forecast by Region, 2018 to 2033 Table 2: Global Market Volume (Units) Forecast by Region, 2018 to 2033 Table 3: Global Market Value (US$ Million) Forecast by Product Type, 2018 to 2033 Table 4: Global Market Volume (Units) Forecast by Product Type, 2018 to 2033 Table 5: Global Market Value (US$ Million) Forecast by Application, 2018 to 2033 Table 6: Global Market Volume (Units) Forecast by Application, 2018 to 2033 Table 7: Global Market Value (US$ Million) Forecast by Distribution Channel, 2018 to 2033 Table 8: Global Market Volume (Units) Forecast by Distribution Channel, 2018 to 2033 Table 9: North America Market Value (US$ Million) Forecast by Country, 2018 to 2033 Table 10: North America Market Volume (Units) Forecast by Country, 2018 to 2033 Table 11: North America Market Value (US$ Million) Forecast by Product Type, 2018 to 2033 Table 12: North America Market Volume (Units) Forecast by Product Type, 2018 to 2033 Table 13: North America Market Value (US$ Million) Forecast by Application, 2018 to 2033 Table 14: North America Market Volume (Units) Forecast by Application, 2018 to 2033 Table 15: North America Market Value (US$ Million) Forecast by Distribution Channel, 2018 to 2033 Table 16: North America Market Volume (Units) Forecast by Distribution Channel, 2018 to 2033 Table 17: Latin America Market Value (US$ Million) Forecast by Country, 2018 to 2033 Table 18: Latin America Market Volume (Units) Forecast by Country, 2018 to 2033 Table 19: Latin America Market Value (US$ Million) Forecast by Product Type, 2018 to 2033 Table 20: Latin America Market Volume (Units) Forecast by Product Type, 2018 to 2033 Table 21: Latin America Market Value (US$ Million) Forecast by Application, 2018 to 2033 Table 22: Latin America Market Volume (Units) Forecast by Application, 2018 to 2033 Table 23: Latin America Market Value (US$ Million) Forecast by Distribution Channel, 2018 to 2033 Table 24: Latin America Market Volume (Units) Forecast by Distribution Channel, 2018 to 2033 Table 25: Western Europe Market Value (US$ Million) Forecast by Country, 2018 to 2033 Table 26: Western Europe Market Volume (Units) Forecast by Country, 2018 to 2033 Table 27: Western Europe Market Value (US$ Million) Forecast by Product Type, 2018 to 2033 Table 28: Western Europe Market Volume (Units) Forecast by Product Type, 2018 to 2033 Table 29: Western Europe Market Value (US$ Million) Forecast by Application, 2018 to 2033 Table 30: Western Europe Market Volume (Units) Forecast by Application, 2018 to 2033 Table 31: Western Europe Market Value (US$ Million) Forecast by Distribution Channel, 2018 to 2033 Table 32: Western Europe Market Volume (Units) Forecast by Distribution Channel, 2018 to 2033 Table 33: Eastern Europe Market Value (US$ Million) Forecast by Country, 2018 to 2033 Table 34: Eastern Europe Market Volume (Units) Forecast by Country, 2018 to 2033 Table 35: Eastern Europe Market Value (US$ Million) Forecast by Product Type, 2018 to 2033 Table 36: Eastern Europe Market Volume (Units) Forecast by Product Type, 2018 to 2033 Table 37: Eastern Europe Market Value (US$ Million) Forecast by Application, 2018 to 2033 Table 38: Eastern Europe Market Volume (Units) Forecast by Application, 2018 to 2033 Table 39: Eastern Europe Market Value (US$ Million) Forecast by Distribution Channel, 2018 to 2033 Table 40: Eastern Europe Market Volume (Units) Forecast by Distribution Channel, 2018 to 2033 Table 41: South Asia and Pacific Market Value (US$ Million) Forecast by Country, 2018 to 2033 Table 42: South Asia and Pacific Market Volume (Units) Forecast by Country, 2018 to 2033 Table 43: South Asia and Pacific Market Value (US$ Million) Forecast by Product Type, 2018 to 2033 Table 44: South Asia and Pacific Market Volume (Units) Forecast by Product Type, 2018 to 2033 Table 45: South Asia and Pacific Market Value (US$ Million) Forecast by Application, 2018 to 2033 Table 46: South Asia and Pacific Market Volume (Units) Forecast by Application, 2018 to 2033 Table 47: South Asia and Pacific Market Value (US$ Million) Forecast by Distribution Channel, 2018 to 2033 Table 48: South Asia and Pacific Market Volume (Units) Forecast by Distribution Channel, 2018 to 2033 Table 49: East Asia Market Value (US$ Million) Forecast by Country, 2018 to 2033 Table 50: East Asia Market Volume (Units) Forecast by Country, 2018 to 2033 Table 51: East Asia Market Value (US$ Million) Forecast by Product Type, 2018 to 2033 Table 52: East Asia Market Volume (Units) Forecast by Product Type, 2018 to 2033 Table 53: East Asia Market Value (US$ Million) Forecast by Application, 2018 to 2033 Table 54: East Asia Market Volume (Units) Forecast by Application, 2018 to 2033 Table 55: East Asia Market Value (US$ Million) Forecast by Distribution Channel, 2018 to 2033 Table 56: East Asia Market Volume (Units) Forecast by Distribution Channel, 2018 to 2033 Table 57: Middle East and Africa Market Value (US$ Million) Forecast by Country, 2018 to 2033 Table 58: Middle East and Africa Market Volume (Units) Forecast by Country, 2018 to 2033 Table 59: Middle East and Africa Market Value (US$ Million) Forecast by Product Type, 2018 to 2033 Table 60: Middle East and Africa Market Volume (Units) Forecast by Product Type, 2018 to 2033 Table 61: Middle East and Africa Market Value (US$ Million) Forecast by Application, 2018 to 2033 Table 62: Middle East and Africa Market Volume (Units) Forecast by Application, 2018 to 2033 Table 63: Middle East and Africa Market Value (US$ Million) Forecast by Distribution Channel, 2018 to 2033 Table 64: Middle East and Africa Market Volume (Units) Forecast by Distribution Channel, 2018 to 2033
List of Charts
Figure 1: Global Market Value (US$ Million) by Product Type, 2023 to 2033 Figure 2: Global Market Value (US$ Million) by Application, 2023 to 2033 Figure 3: Global Market Value (US$ Million) by Distribution Channel, 2023 to 2033 Figure 4: Global Market Value (US$ Million) by Region, 2023 to 2033 Figure 5: Global Market Value (US$ Million) Analysis by Region, 2018 to 2033 Figure 6: Global Market Volume (Units) Analysis by Region, 2018 to 2033 Figure 7: Global Market Value Share (%) and BPS Analysis by Region, 2023 to 2033 Figure 8: Global Market Y-o-Y Growth (%) Projections by Region, 2023 to 2033 Figure 9: Global Market Value (US$ Million) Analysis by Product Type, 2018 to 2033 Figure 10: Global Market Volume (Units) Analysis by Product Type, 2018 to 2033 Figure 11: Global Market Value Share (%) and BPS Analysis by Product Type, 2023 to 2033 Figure 12: Global Market Y-o-Y Growth (%) Projections by Product Type, 2023 to 2033 Figure 13: Global Market Value (US$ Million) Analysis by Application, 2018 to 2033 Figure 14: Global Market Volume (Units) Analysis by Application, 2018 to 2033 Figure 15: Global Market Value Share (%) and BPS Analysis by Application, 2023 to 2033 Figure 16: Global Market Y-o-Y Growth (%) Projections by Application, 2023 to 2033 Figure 17: Global Market Value (US$ Million) Analysis by Distribution Channel, 2018 to 2033 Figure 18: Global Market Volume (Units) Analysis by Distribution Channel, 2018 to 2033 Figure 19: Global Market Value Share (%) and BPS Analysis by Distribution Channel, 2023 to 2033 Figure 20: Global Market Y-o-Y Growth (%) Projections by Distribution Channel, 2023 to 2033 Figure 21: Global Market Attractiveness by Product Type, 2023 to 2033 Figure 22: Global Market Attractiveness by Application, 2023 to 2033 Figure 23: Global Market Attractiveness by Distribution Channel, 2023 to 2033 Figure 24: Global Market Attractiveness by Region, 2023 to 2033 Figure 25: North America Market Value (US$ Million) by Product Type, 2023 to 2033 Figure 26: North America Market Value (US$ Million) by Application, 2023 to 2033 Figure 27: North America Market Value (US$ Million) by Distribution Channel, 2023 to 2033 Figure 28: North America Market Value (US$ Million) by Country, 2023 to 2033 Figure 29: North America Market Value (US$ Million) Analysis by Country, 2018 to 2033 Figure 30: North America Market Volume (Units) Analysis by Country, 2018 to 2033 Figure 31: North America Market Value Share (%) and BPS Analysis by Country, 2023 to 2033 Figure 32: North America Market Y-o-Y Growth (%) Projections by Country, 2023 to 2033 Figure 33: North America Market Value (US$ Million) Analysis by Product Type, 2018 to 2033 Figure 34: North America Market Volume (Units) Analysis by Product Type, 2018 to 2033 Figure 35: North America Market Value Share (%) and BPS Analysis by Product Type, 2023 to 2033 Figure 36: North America Market Y-o-Y Growth (%) Projections by Product Type, 2023 to 2033 Figure 37: North America Market Value (US$ Million) Analysis by Application, 2018 to 2033 Figure 38: North America Market Volume (Units) Analysis by Application, 2018 to 2033 Figure 39: North America Market Value Share (%) and BPS Analysis by Application, 2023 to 2033 Figure 40: North America Market Y-o-Y Growth (%) Projections by Application, 2023 to 2033 Figure 41: North America Market Value (US$ Million) Analysis by Distribution Channel, 2018 to 2033 Figure 42: North America Market Volume (Units) Analysis by Distribution Channel, 2018 to 2033 Figure 43: North America Market Value Share (%) and BPS Analysis by Distribution Channel, 2023 to 2033 Figure 44: North America Market Y-o-Y Growth (%) Projections by Distribution Channel, 2023 to 2033 Figure 45: North America Market Attractiveness by Product Type, 2023 to 2033 Figure 46: North America Market Attractiveness by Application, 2023 to 2033 Figure 47: North America Market Attractiveness by Distribution Channel, 2023 to 2033 Figure 48: North America Market Attractiveness by Country, 2023 to 2033 Figure 49: Latin America Market Value (US$ Million) by Product Type, 2023 to 2033 Figure 50: Latin America Market Value (US$ Million) by Application, 2023 to 2033 Figure 51: Latin America Market Value (US$ Million) by Distribution Channel, 2023 to 2033 Figure 52: Latin America Market Value (US$ Million) by Country, 2023 to 2033 Figure 53: Latin America Market Value (US$ Million) Analysis by Country, 2018 to 2033 Figure 54: Latin America Market Volume (Units) Analysis by Country, 2018 to 2033 Figure 55: Latin America Market Value Share (%) and BPS Analysis by Country, 2023 to 2033 Figure 56: Latin America Market Y-o-Y Growth (%) Projections by Country, 2023 to 2033 Figure 57: Latin America Market Value (US$ Million) Analysis by Product Type, 2018 to 2033 Figure 58: Latin America Market Volume (Units) Analysis by Product Type, 2018 to 2033 Figure 59: Latin America Market Value Share (%) and BPS Analysis by Product Type, 2023 to 2033 Figure 60: Latin America Market Y-o-Y Growth (%) Projections by Product Type, 2023 to 2033 Figure 61: Latin America Market Value (US$ Million) Analysis by Application, 2018 to 2033 Figure 62: Latin America Market Volume (Units) Analysis by Application, 2018 to 2033 Figure 63: Latin America Market Value Share (%) and BPS Analysis by Application, 2023 to 2033 Figure 64: Latin America Market Y-o-Y Growth (%) Projections by Application, 2023 to 2033 Figure 65: Latin America Market Value (US$ Million) Analysis by Distribution Channel, 2018 to 2033 Figure 66: Latin America Market Volume (Units) Analysis by Distribution Channel, 2018 to 2033 Figure 67: Latin America Market Value Share (%) and BPS Analysis by Distribution Channel, 2023 to 2033 Figure 68: Latin America Market Y-o-Y Growth (%) Projections by Distribution Channel, 2023 to 2033 Figure 69: Latin America Market Attractiveness by Product Type, 2023 to 2033 Figure 70: Latin America Market Attractiveness by Application, 2023 to 2033 Figure 71: Latin America Market Attractiveness by Distribution Channel, 2023 to 2033 Figure 72: Latin America Market Attractiveness by Country, 2023 to 2033 Figure 73: Western Europe Market Value (US$ Million) by Product Type, 2023 to 2033 Figure 74: Western Europe Market Value (US$ Million) by Application, 2023 to 2033 Figure 75: Western Europe Market Value (US$ Million) by Distribution Channel, 2023 to 2033 Figure 76: Western Europe Market Value (US$ Million) by Country, 2023 to 2033 Figure 77: Western Europe Market Value (US$ Million) Analysis by Country, 2018 to 2033 Figure 78: Western Europe Market Volume (Units) Analysis by Country, 2018 to 2033 Figure 79: Western Europe Market Value Share (%) and BPS Analysis by Country, 2023 to 2033 Figure 80: Western Europe Market Y-o-Y Growth (%) Projections by Country, 2023 to 2033 Figure 81: Western Europe Market Value (US$ Million) Analysis by Product Type, 2018 to 2033 Figure 82: Western Europe Market Volume (Units) Analysis by Product Type, 2018 to 2033 Figure 83: Western Europe Market Value Share (%) and BPS Analysis by Product Type, 2023 to 2033 Figure 84: Western Europe Market Y-o-Y Growth (%) Projections by Product Type, 2023 to 2033 Figure 85: Western Europe Market Value (US$ Million) Analysis by Application, 2018 to 2033 Figure 86: Western Europe Market Volume (Units) Analysis by Application, 2018 to 2033 Figure 87: Western Europe Market Value Share (%) and BPS Analysis by Application, 2023 to 2033 Figure 88: Western Europe Market Y-o-Y Growth (%) Projections by Application, 2023 to 2033 Figure 89: Western Europe Market Value (US$ Million) Analysis by Distribution Channel, 2018 to 2033 Figure 90: Western Europe Market Volume (Units) Analysis by Distribution Channel, 2018 to 2033 Figure 91: Western Europe Market Value Share (%) and BPS Analysis by Distribution Channel, 2023 to 2033 Figure 92: Western Europe Market Y-o-Y Growth (%) Projections by Distribution Channel, 2023 to 2033 Figure 93: Western Europe Market Attractiveness by Product Type, 2023 to 2033 Figure 94: Western Europe Market Attractiveness by Application, 2023 to 2033 Figure 95: Western Europe Market Attractiveness by Distribution Channel, 2023 to 2033 Figure 96: Western Europe Market Attractiveness by Country, 2023 to 2033 Figure 97: Eastern Europe Market Value (US$ Million) by Product Type, 2023 to 2033 Figure 98: Eastern Europe Market Value (US$ Million) by Application, 2023 to 2033 Figure 99: Eastern Europe Market Value (US$ Million) by Distribution Channel, 2023 to 2033 Figure 100: Eastern Europe Market Value (US$ Million) by Country, 2023 to 2033 Figure 101: Eastern Europe Market Value (US$ Million) Analysis by Country, 2018 to 2033 Figure 102: Eastern Europe Market Volume (Units) Analysis by Country, 2018 to 2033 Figure 103: Eastern Europe Market Value Share (%) and BPS Analysis by Country, 2023 to 2033 Figure 104: Eastern Europe Market Y-o-Y Growth (%) Projections by Country, 2023 to 2033 Figure 105: Eastern Europe Market Value (US$ Million) Analysis by Product Type, 2018 to 2033 Figure 106: Eastern Europe Market Volume (Units) Analysis by Product Type, 2018 to 2033 Figure 107: Eastern Europe Market Value Share (%) and BPS Analysis by Product Type, 2023 to 2033 Figure 108: Eastern Europe Market Y-o-Y Growth (%) Projections by Product Type, 2023 to 2033 Figure 109: Eastern Europe Market Value (US$ Million) Analysis by Application, 2018 to 2033 Figure 110: Eastern Europe Market Volume (Units) Analysis by Application, 2018 to 2033 Figure 111: Eastern Europe Market Value Share (%) and BPS Analysis by Application, 2023 to 2033 Figure 112: Eastern Europe Market Y-o-Y Growth (%) Projections by Application, 2023 to 2033 Figure 113: Eastern Europe Market Value (US$ Million) Analysis by Distribution Channel, 2018 to 2033 Figure 114: Eastern Europe Market Volume (Units) Analysis by Distribution Channel, 2018 to 2033 Figure 115: Eastern Europe Market Value Share (%) and BPS Analysis by Distribution Channel, 2023 to 2033 Figure 116: Eastern Europe Market Y-o-Y Growth (%) Projections by Distribution Channel, 2023 to 2033 Figure 117: Eastern Europe Market Attractiveness by Product Type, 2023 to 2033 Figure 118: Eastern Europe Market Attractiveness by Application, 2023 to 2033 Figure 119: Eastern Europe Market Attractiveness by Distribution Channel, 2023 to 2033 Figure 120: Eastern Europe Market Attractiveness by Country, 2023 to 2033 Figure 121: South Asia and Pacific Market Value (US$ Million) by Product Type, 2023 to 2033 Figure 122: South Asia and Pacific Market Value (US$ Million) by Application, 2023 to 2033 Figure 123: South Asia and Pacific Market Value (US$ Million) by Distribution Channel, 2023 to 2033 Figure 124: South Asia and Pacific Market Value (US$ Million) by Country, 2023 to 2033 Figure 125: South Asia and Pacific Market Value (US$ Million) Analysis by Country, 2018 to 2033 Figure 126: South Asia and Pacific Market Volume (Units) Analysis by Country, 2018 to 2033 Figure 127: South Asia and Pacific Market Value Share (%) and BPS Analysis by Country, 2023 to 2033 Figure 128: South Asia and Pacific Market Y-o-Y Growth (%) Projections by Country, 2023 to 2033 Figure 129: South Asia and Pacific Market Value (US$ Million) Analysis by Product Type, 2018 to 2033 Figure 130: South Asia and Pacific Market Volume (Units) Analysis by Product Type, 2018 to 2033 Figure 131: South Asia and Pacific Market Value Share (%) and BPS Analysis by Product Type, 2023 to 2033 Figure 132: South Asia and Pacific Market Y-o-Y Growth (%) Projections by Product Type, 2023 to 2033 Figure 133: South Asia and Pacific Market Value (US$ Million) Analysis by Application, 2018 to 2033 Figure 134: South Asia and Pacific Market Volume (Units) Analysis by Application, 2018 to 2033 Figure 135: South Asia and Pacific Market Value Share (%) and BPS Analysis by Application, 2023 to 2033 Figure 136: South Asia and Pacific Market Y-o-Y Growth (%) Projections by Application, 2023 to 2033 Figure 137: South Asia and Pacific Market Value (US$ Million) Analysis by Distribution Channel, 2018 to 2033 Figure 138: South Asia and Pacific Market Volume (Units) Analysis by Distribution Channel, 2018 to 2033 Figure 139: South Asia and Pacific Market Value Share (%) and BPS Analysis by Distribution Channel, 2023 to 2033 Figure 140: South Asia and Pacific Market Y-o-Y Growth (%) Projections by Distribution Channel, 2023 to 2033 Figure 141: South Asia and Pacific Market Attractiveness by Product Type, 2023 to 2033 Figure 142: South Asia and Pacific Market Attractiveness by Application, 2023 to 2033 Figure 143: South Asia and Pacific Market Attractiveness by Distribution Channel, 2023 to 2033 Figure 144: South Asia and Pacific Market Attractiveness by Country, 2023 to 2033 Figure 145: East Asia Market Value (US$ Million) by Product Type, 2023 to 2033 Figure 146: East Asia Market Value (US$ Million) by Application, 2023 to 2033 Figure 147: East Asia Market Value (US$ Million) by Distribution Channel, 2023 to 2033 Figure 148: East Asia Market Value (US$ Million) by Country, 2023 to 2033 Figure 149: East Asia Market Value (US$ Million) Analysis by Country, 2018 to 2033 Figure 150: East Asia Market Volume (Units) Analysis by Country, 2018 to 2033 Figure 151: East Asia Market Value Share (%) and BPS Analysis by Country, 2023 to 2033 Figure 152: East Asia Market Y-o-Y Growth (%) Projections by Country, 2023 to 2033 Figure 153: East Asia Market Value (US$ Million) Analysis by Product Type, 2018 to 2033 Figure 154: East Asia Market Volume (Units) Analysis by Product Type, 2018 to 2033 Figure 155: East Asia Market Value Share (%) and BPS Analysis by Product Type, 2023 to 2033 Figure 156: East Asia Market Y-o-Y Growth (%) Projections by Product Type, 2023 to 2033 Figure 157: East Asia Market Value (US$ Million) Analysis by Application, 2018 to 2033 Figure 158: East Asia Market Volume (Units) Analysis by Application, 2018 to 2033 Figure 159: East Asia Market Value Share (%) and BPS Analysis by Application, 2023 to 2033 Figure 160: East Asia Market Y-o-Y Growth (%) Projections by Application, 2023 to 2033 Figure 161: East Asia Market Value (US$ Million) Analysis by Distribution Channel, 2018 to 2033 Figure 162: East Asia Market Volume (Units) Analysis by Distribution Channel, 2018 to 2033 Figure 163: East Asia Market Value Share (%) and BPS Analysis by Distribution Channel, 2023 to 2033 Figure 164: East Asia Market Y-o-Y Growth (%) Projections by Distribution Channel, 2023 to 2033 Figure 165: East Asia Market Attractiveness by Product Type, 2023 to 2033 Figure 166: East Asia Market Attractiveness by Application, 2023 to 2033 Figure 167: East Asia Market Attractiveness by Distribution Channel, 2023 to 2033 Figure 168: East Asia Market Attractiveness by Country, 2023 to 2033 Figure 169: Middle East and Africa Market Value (US$ Million) by Product Type, 2023 to 2033 Figure 170: Middle East and Africa Market Value (US$ Million) by Application, 2023 to 2033 Figure 171: Middle East and Africa Market Value (US$ Million) by Distribution Channel, 2023 to 2033 Figure 172: Middle East and Africa Market Value (US$ Million) by Country, 2023 to 2033 Figure 173: Middle East and Africa Market Value (US$ Million) Analysis by Country, 2018 to 2033 Figure 174: Middle East and Africa Market Volume (Units) Analysis by Country, 2018 to 2033 Figure 175: Middle East and Africa Market Value Share (%) and BPS Analysis by Country, 2023 to 2033 Figure 176: Middle East and Africa Market Y-o-Y Growth (%) Projections by Country, 2023 to 2033 Figure 177: Middle East and Africa Market Value (US$ Million) Analysis by Product Type, 2018 to 2033 Figure 178: Middle East and Africa Market Volume (Units) Analysis by Product Type, 2018 to 2033 Figure 179: Middle East and Africa Market Value Share (%) and BPS Analysis by Product Type, 2023 to 2033 Figure 180: Middle East and Africa Market Y-o-Y Growth (%) Projections by Product Type, 2023 to 2033 Figure 181: Middle East and Africa Market Value (US$ Million) Analysis by Application, 2018 to 2033 Figure 182: Middle East and Africa Market Volume (Units) Analysis by Application, 2018 to 2033 Figure 183: Middle East and Africa Market Value Share (%) and BPS Analysis by Application, 2023 to 2033 Figure 184: Middle East and Africa Market Y-o-Y Growth (%) Projections by Application, 2023 to 2033 Figure 185: Middle East and Africa Market Value (US$ Million) Analysis by Distribution Channel, 2018 to 2033 Figure 186: Middle East and Africa Market Volume (Units) Analysis by Distribution Channel, 2018 to 2033 Figure 187: Middle East and Africa Market Value Share (%) and BPS Analysis by Distribution Channel, 2023 to 2033 Figure 188: Middle East and Africa Market Y-o-Y Growth (%) Projections by Distribution Channel, 2023 to 2033 Figure 189: Middle East and Africa Market Attractiveness by Product Type, 2023 to 2033 Figure 190: Middle East and Africa Market Attractiveness by Application, 2023 to 2033 Figure 191: Middle East and Africa Market Attractiveness by Distribution Channel, 2023 to 2033 Figure 192: Middle East and Africa Market Attractiveness by Country, 2023 to 2033
Recommendations
Explore Consumer Product Insights
View Reports