Halal Ingredient Market Size and Share Forecast Outlook 2025 to 2035

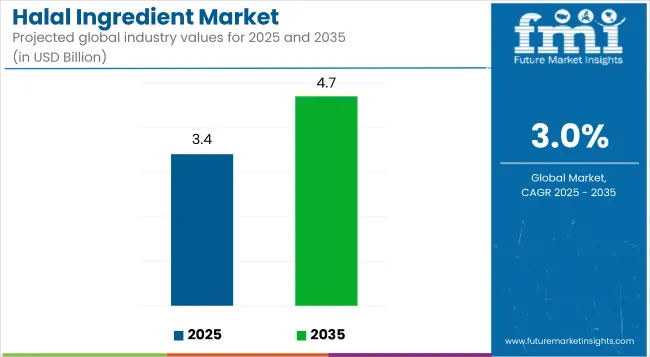
The global halal ingredient market is projected to grow from USD 3.4 billion in 2025 to USD 4.7 billion by 2035, reflecting a CAGR of 3%.
Quick Stats for Halal Ingredient Market

  • Market Value (2025): USD 3.4 billion
  • Forecast Value (2035): USD 4.7 billion
  • Forecast CAGR (2025 to 2035): 3%
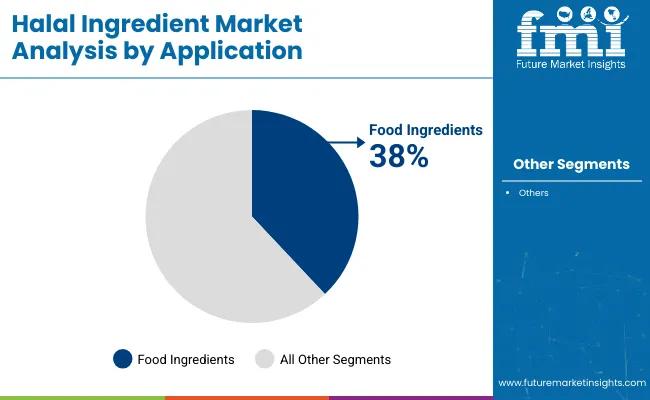
  • Key Application Segment in 2025: Food Ingredients (38% Market Share)
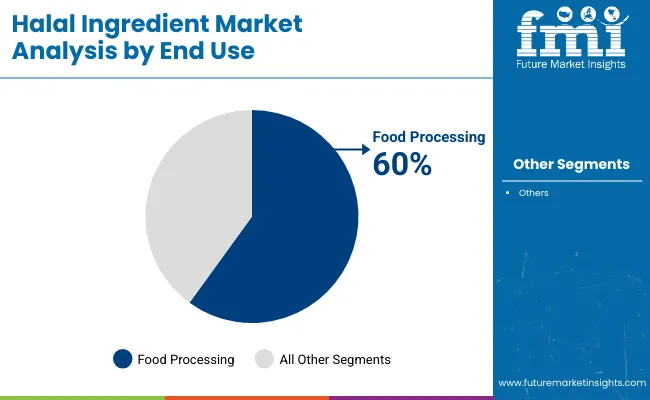
  • Top End-Use segment: Food Processing (60% Market Share)
  • Top Growth Region: Asia Pacific (Fastest-growing market in Japan with a 6.5% CAGR)

Halal Ingredient Market

Metric Value
Market Size (2025) USD 3.4 billion
Forecast Value (2035) USD 4.7 billion
CAGR (2025 to 2035) 3%

The market growth is driven by an increasing demand for halal-certified food and beverages and growing consumer awareness regarding ethical sourcing and sustainability. In addition, the growing popularity of halal ingredients, driven by the perception of high quality and safety, is further expanding the market.

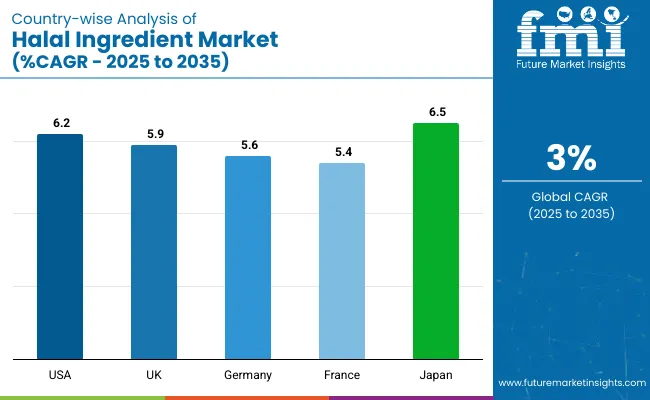
The USA will remain the largest contributor to the growth of the halal ingredient market, expanding at a CAGR of 6.2%. Meanwhile, Japan is anticipated to register the fastest growth at 6.5% CAGR, closely followed by the UK, growing at a CAGR of 5.9%. Food ingredients by application segment account for 38% of the market share, while by end-use segment, food processing holds a prominent market share of 60% in 2025.

The halal ingredient market holds varying shares across its parent industries. It accounts for approximately 8% of the global food ingredients market, driven by rising halal-certified packaged foods. In the beverage ingredients market, halal ingredients capture nearly 6%, largely due to demand for juices, soft drinks, and nutritional beverages.

Within the cosmetics ingredients market, halal-certified inputs represent around 4%, as ethical beauty trends rise. In the pharmaceutical ingredients space, the share stands at 3%, with growing emphasis on halal APIs and excipients. Across the clean label and ethical ingredients markets, halal makes up roughly 7% and 6%, respectively.

Looking forward, the halal ingredient market is set to witness innovations in product offerings, especially in plant-based ingredients and functional foods. Governments worldwide are continuing to support halal certification through legislation and regulations that facilitate smooth market operations.

Additionally, the growing emphasis on sustainability and traceability will further shape the future of the halal ingredient market. Companies are expected to strengthen their presence in both mature and emerging markets, especially in regions like Southeast Asia and the Middle East.

Analyzing Halal Ingredient Market by Top Investment Segments

The market is divided into several key applications, end-use, and regional segments. The application segments include food ingredients (which encompasses sauces and marinades, thickening agents, sugar substitutes, flavors, and other food ingredients), beverage (covering coffee, tea, concentrated beverages and juices, soft drinks, and health and nutritional drinks), cosmetic Industry (which includes body and skin care, oral care, fragrance, and hair care), pharmaceutical (encompassing active pharma ingredients and excipients), and others (covering additional miscellaneous sectors).

The end-use segments include HoReCa (hotels, restaurants, and catering) and food processing. By region, it covers North America, Latin America, Western Europe, South Asia and the Pacific, East Asia, the Middle East and Africa.
By Application, Food Ingredients Account for 38% of the Market Share in 2025

Halal Ingredient Market Analysis By Application

In the halal ingredient market, food ingredients lead the application segment with a projected 38% market share in 2025. The demand is driven by their extensive use in sauces, marinades, flavors, and sugar substitutes that cater to the rising consumption of halal-certified packaged foods and culinary products.

The shift toward clean-label, compliant formulations across processed and frozen foods is further propelling growth in this segment, especially in Southeast Asia, the Middle East, and parts of Europe.
  • Halal sauces and marinades are essential in ready meals and meat preparations
  • Sugar substitutes and flavors are in high demand due to clean-label trends
  • Beverage applications are expanding, especially in nutritional and energy drinks
  • Cosmetic and pharmaceutical use of halal ingredients is gaining steady momentum

By End Use, Food Processing Accounts for 60% of the Market Share in 2025

Halal Ingredient Market Analysis By End Use

In the halal ingredient market, the food processing segment is projected to dominate the end-use category, capturing a 60% market share in 2025. This dominance is attributed to the rising demand for mass-produced halal-certified products in packaged foods, snacks, beverages, and ready-to-eat meals.

With the expansion of halal food exports and stricter compliance requirements across processing facilities, manufacturers are investing significantly in halal-certified ingredients to meet regulatory and consumer expectations.

  • Growth is fueled by demand for halal-certified packaged and convenience foods
  • Manufacturers are focusing on global halal certification for wider export reach
  • HoReCa segment follows due to demand in restaurants, catering, and institutional kitchens
  • Food processing companies are prioritizing ingredient transparency and traceability

Top Halal Ingredient Market Dynamics

Recent Trends in the Halal Ingredient Market

  • Rising demand for halal-certified beauty and personal care products.
  • Increasing popularity of halal functional and nutritional beverages.
  • Growth in halal-compliant pharmaceutical formulations across emerging markets.
  • Surge in e-commerce channels for halal packaged and processed foods.

Key Challenges in the Halal Ingredient Market
  • Lack of standardized global halal certification systems.
  • High cost of ingredient sourcing and compliance verification.
  • Complexity in maintaining halal integrity across cross-border supply chains.

Analyzing Top Countries Producing, Distributing, and Supplying Halal Ingredients

Country Wise Analysis Of Halal Ingredient Market

Among the leading countries in the halal ingredient market, Japan is projected to witness the fastest growth with a CAGR of 6.5% from 2025 to 2035, driven by halal tourism and export expansion. The USA follows closely with a 6.2% CAGR, fueled by a growing disposable incomeand rising clean-label preferences.

The UK market is set to grow at 5.9%, backed by a strong halal retail presence. Germany and France are expected to expand at 5.6% and 5.4%, respectively, due to their large immigrant bases and evolving consumer demands. Overall, East Asia and North America show the strongest momentum.

The report covers an in-depth analysis of 40+ countries; five top-performing OECD countries are highlighted below.

United States Halal Ingredients Market Analysis

The halal ingredient revenue in the USA is expected to grow at a CAGR of 6.2% from 2025 to 2035. The country shows increasing demand for halal-certified food and personal care products due to growing awareness about clean-label and ethical sourcing. Leading food manufacturers are expanding their halal portfolios to tap into this demographic.

  • Increasing popularity of halal-certified convenience and frozen foods.
  • Growing diversity of the USA consumer base.
  • Expanding private label halal product offerings in supermarkets.

Halal Ingredients Demand Analysis in the United Kingdom

The halal ingredient market in the UK is projected to expand at a CAGR of 5.9% between 2025 and 2035. The demand for halal-certified ingredients is rising across food, beverages, cosmetics, and pharmaceuticals. Supermarkets and foodservice providers are rapidly integrating halal-certified products into their offerings.

  • Rising demand for halal skincare and ethical beauty products.
  • Supportive regulatory environment for halal certification.
  • Strong presence of halal-certified fast food and retail chains.

Germany Halal Ingredients Sales Analysis

There venue from halal ingredients in Germany is estimated to rise at a CAGR of 5.6% from 2025 to 2035. The country’s large immigrant population and increasing emphasis on food safety and traceability are creating favorable conditions for halal-certified food and beverage ingredients. German manufacturers are also investing in halal compliance to cater to domestic and export markets, particularly in the Middle East and Asia.

  • High demand for processed halal meats and sauces.
  • Export-focused halal ingredient manufacturing base.
  • Increasing use of halal ingredients in functional beverages.

Halal Ingredients Market Analysis in France

The sales of halal ingredients in France are expected to register a CAGR of 5.4% from 2025 to 2035. An evolving consumer preference for traceable, clean-label food and cosmetic products is driving market momentum. Halal-certified bakery items, flavorings, and nutraceuticals are gaining traction. Furthermore, French retailers are expanding their halal portfolios, supported by dedicated halal aisles in major supermarkets.

  • Expansion of halal bakery and confectionery segments.
  • Strong urban demand in Paris and other major cities.
  • Growing export of halal-certified cosmetics to the MENA region.

Japan Halal Ingredients Demand Analysis

The halal ingredient market in Japan is forecast to flourish at a CAGR of 6.5% from 2025 to 2035, making it one of the fastest-growing markets in East Asia. The country is actively improving halal infrastructure to cater to rising inbound tourism. Japanese firms are developing halal-certified food additives, sauces, and skincare products to serve both domestic and regional demand.

  • Government-backed halal tourism and certification initiatives.
  • Rising demand for halal convenience meals and sauces.
  • Export growth to Southeast Asia and the Middle East regions.

Leading Halal Ingredient Suppliers

The market is moderately fragmented, with both multinational corporations and regional players actively competing across the food, beverage, cosmetic, and pharmaceutical sectors. Major companies like Nestlé S.A., ADM, Ingredion, BASF SE, and Givaudan are leveraging their R&D capabilities, global supply chains, and certification partnerships to expand halal-compliant portfolios and penetrate high-growth markets.

These players focus on expanding halal offerings in dairy alternatives, flavor systems, functional food ingredients, and clean-label additives to stay competitive.

Leading companies are emphasizing strategic collaborations with halal certification bodies, regional production facility expansions, and product innovation tailored for diverse halal applications. For instance, ADM and Ingredion are investing in plant-based halal protein sources, while Givaudan and Kerry are focusing on halal-certified sensory solutions.

Pricing competitiveness, local sourcing, and sustainability are other key areas driving differentiation. Multinational players are also forming alliances with Islamic councils and regulatory institutions to streamline product approvals in Southeast Asia and the Middle East.

Recent Halal Ingredients Industry News

In June 2025, Ingredion extended its long-standing partnership with Univar Solutions to include distribution of functional starches, proteins, and stevia sweeteners.

Halal Ingredients Market Report Scope

Report Attributes Details
Current Total Market Size (2025) USD 3.4 billion
Projected Market Size (2035) USD 4.7 billion
CAGR (2025 to 2035) 3%
Base Year for Estimation 2024
Historical Period 2020 to 2024
Projections Period 2025 to 2035
Market Analysis Parameters Revenue in USD billions/Volume in kilotons
By Application Food Ingredients (Sauces & Marinades, Thickening Agents, Sugar Substitutes, Flavors, Others), Beverages (Coffee, Tea, Concentrated Beverages and Juices, Soft Drinks, Health and Nutritional Drinks), Cosmetic Industry (Body & Skin Care, Oral Care, Fragrance, Hair Care), Pharmaceutical (Active Pharma Ingredients, Excipients)
By End Use HoReCa, Food Processing
Regions Covered North America, Latin America, Western Europe, South Asia and Pacific, East Asia, Middle East and Africa
Countries Covered United States, Canada, United Kingdom, Germany, France, China, Japan, South Korea, Brazil, Australia
Key Players Nestlé S.A., ADM (Archer Daniels Midland), Ingredion, AB Mauri Malaysia Sdn. Bhd, BASF SE, Ashland Inc., Givaudan, Kerry, Kingherbs Limited
Additional Attributes Dollar sales by value, market share analysis by region, and country-wise analysis

Key Segmentation

By Application:

Various applications of the product are food ingredients, the beverage industry, the cosmetic industry, and the pharmaceutical. The food ingredients segment is further divided into thickening agents, sauces and marinades, flavors, sugar substitutes, and others.

The beverage industry is segmented into coffee, tea, concentrated beverages, and juices, soft drinks, and health and nutritional drinks. The cosmetic industry is categorized into body and skin care, oral care, fragrance, and hair care. The pharmaceutical sector further is bifurcated into active pharma ingredients and excipients.

By End Use:

In terms of end use, the industry is bifurcated into HoReCa and food processing.

By Region:

Halal ingredient market analysis has been carried out in key countries of North America, Latin America, Europe, East Asia, South Asia, the Middle East and Africa, and Oceania.

Table of Content

  1. Executive Summary
    • Global Market Outlook
    • Demand-side Trends
    • Supply-side Trends
    • Technology Roadmap Analysis
    • Analysis and Recommendations
  2. Market Overview
    • Market Coverage/Taxonomy
    • Market Definition/Scope/Limitations
  3. Market Background
    • Market Dynamics
      • Drivers
      • Restraints
      • Opportunity
      • Trends
    • Scenario Forecast
      • Demand in Optimistic Scenario
      • Demand in Likely Scenario
      • Demand in Conservative Scenario
    • Opportunity Map Analysis
    • Product Life Cycle Analysis
    • Supply Chain Analysis
      • Supply Side Participants and their Roles
        • Producers
        • Mid-Level Participants (Traders/ Agents/ Brokers)
        • Wholesalers and Distributors
      • Value Added and Value Created at Node in the Supply Chain
      • List of Raw Material Suppliers
      • List of Existing and Potential Buyer’s
    • Investment Feasibility Matrix
    • Value Chain Analysis
      • Profit Margin Analysis
      • Wholesalers and Distributors
      • Retailers
    • PESTLE and Porter’s Analysis
    • Regulatory Landscape
      • By Key Regions
      • By Key Countries
    • Regional Parent Market Outlook
    • Production and Consumption Statistics
    • Import and Export Statistics
  4. Global Market Analysis 2020 to 2024 and Forecast, 2025 to 2035
    • Historical Market Size Value (USD Billion) & Volume (kilotons) Analysis, 2020 to 2024
    • Current and Future Market Size Value (USD Billion) & Volume (kilotons) Projections, 2025 to 2035
      • Y-o-Y Growth Trend Analysis
      • Absolute $ Opportunity Analysis
  5. Global Market Pricing Analysis 2020 to 2024 and Forecast 2025 to 2035
  6. Global Market Analysis 2020 to 2024 and Forecast 2025 to 2035, By Application
    • Introduction/Key Findings
    • Historical Market Size Value (USD Billion) & Volume (kilotons) Analysis By Application, 2020 to 2024
    • Current and Future Market Size Value (USD Billion) & Volume (kilotons) Analysis and Forecast By Application, 2025 to 2035
      • Food Ingredients
        • Sauces and Marinades
        • Thickening Agents
        • Sugar Substitutes
        • Flavors
        • Other Food Ingredients
      • Beverage
        • Coffee
        • Tea
        • Concentrated Beverages and Juices
        • Soft drinks
        • Health and nutritional drinks
      • Cosmetic Industry
        • Body and skin care
        • Oral care
        • Fragrance
        • Hair care
      • Pharmaceutical
        • Active Pharma Ingredients
        • Excipients
    • Y-o-Y Growth Trend Analysis By Application, 2020 to 2024
    • Absolute $ Opportunity Analysis By Application, 2025 to 2035
  7. Global Market Analysis 2020 to 2024 and Forecast 2025 to 2035, By End Use
    • Introduction/Key Findings
    • Historical Market Size Value (USD Billion) & Volume (kilotons) Analysis By End Use, 2020 to 2024
    • Current and Future Market Size Value (USD Billion) & Volume (kilotons) Analysis and Forecast By End Use, 2025 to 2035
      • HoReCa
      • Food Processing
    • Y-o-Y Growth Trend Analysis By End Use, 2020 to 2024
    • Absolute $ Opportunity Analysis By End Use, 2025 to 2035
  8. Global Market Analysis 2020 to 2024 and Forecast 2025 to 2035, By Region
    • Introduction
    • Historical Market Size Value (USD Billion) & Volume (kilotons) Analysis By Region, 2020 to 2024
    • Current Market Size Value (USD Billion) & Volume (kilotons) Analysis and Forecast By Region, 2025 to 2035
      • North America
      • Latin America
      • Western Europe
      • Eastern Europe
      • East Asia
      • South Asia & Pacific
      • Middle East and Africa
    • Market Attractiveness Analysis By Region
  9. North America Market Analysis 2020 to 2024 and Forecast 2025 to 2035, By Country
    • Historical Market Size Value (USD Billion) & Volume (kilotons) Trend Analysis By Market Taxonomy, 2020 to 2024
    • Market Size Value (USD Billion) & Volume (kilotons) Forecast By Market Taxonomy, 2025 to 2035
      • By Country
        • USA
        • Canada
        • Mexico
      • By Application
      • By End Use
    • Market Attractiveness Analysis
      • By Country
      • By Application
      • By End Use
    • Key Takeaways
  10. Latin America Market Analysis 2020 to 2024 and Forecast 2025 to 2035, By Country
    • Historical Market Size Value (USD Billion) & Volume (kilotons) Trend Analysis By Market Taxonomy, 2020 to 2024
    • Market Size Value (USD Billion) & Volume (kilotons) Forecast By Market Taxonomy, 2025 to 2035
      • By Country
        • Brazil
        • Argentina
        • Rest of LATAM
      • By Application
      • By End Use
    • Market Attractiveness Analysis
      • By Country
      • By Application
      • By End Use
    • Key Takeaways
  11. Western Europe Market Analysis 2020 to 2024 and Forecast 2025 to 2035, By Country
    • Historical Market Size Value (USD Billion) & Volume (kilotons) Trend Analysis By Market Taxonomy, 2020 to 2024
    • Market Size Value (USD Billion) & Volume (kilotons) Forecast By Market Taxonomy, 2025 to 2035
      • By Country
        • Germany
        • Italy
        • France
        • UK
        • Spain
        • BENELUX
        • Nordic
        • Rest of W.Europe
      • By Application
      • By End Use
    • Market Attractiveness Analysis
      • By Country
      • By Application
      • By End Use
    • Key Takeaways
  12. Eastern Europe Market Analysis 2020 to 2024 and Forecast 2025 to 2035, By Country
    • Historical Market Size Value (USD Billion) & Volume (kilotons) Trend Analysis By Market Taxonomy, 2020 to 2024
    • Market Size Value (USD Billion) & Volume (kilotons) Forecast By Market Taxonomy, 2025 to 2035
      • By Country
        • Russia
        • Hungary
        • Poland
        • Balkan & Baltics
        • Rest of E. Europe
      • By Application
      • By End Use
    • Market Attractiveness Analysis
      • By Country
      • By Application
      • By End Use
    • Key Takeaways
  13. East Asia Market Analysis 2020 to 2024 and Forecast 2025 to 2035, By Country
    • Historical Market Size Value (USD Billion) & Volume (kilotons) Trend Analysis By Market Taxonomy, 2020 to 2024
    • Market Size Value (USD Billion) & Volume (kilotons) Forecast By Market Taxonomy, 2025 to 2035
      • By Country
        • China
        • Japan
        • South Korea
      • By Application
      • By End Use
    • Market Attractiveness Analysis
      • By Country
      • By Application
      • By End Use
    • Key Takeaways
  14. South Asia & Pacific Market Analysis 2020 to 2024 and Forecast 2025 to 2035, By Country
    • Historical Market Size Value (USD Billion) & Volume (kilotons) Trend Analysis By Market Taxonomy, 2020 to 2024
    • Market Size Value (USD Billion) & Volume (kilotons) Forecast By Market Taxonomy, 2025 to 2035
      • By Country
        • India
        • Australia & New Zealand
        • ASEAN
        • Rest of SAP
      • By Application
      • By End Use
    • Market Attractiveness Analysis
      • By Country
      • By Application
      • By End Use
    • Key Takeaways
  15. Middle East and Africa Market Analysis 2020 to 2024 and Forecast 2025 to 2035, By Country
    • Historical Market Size Value (USD Billion) & Volume (kilotons) Trend Analysis By Market Taxonomy, 2020 to 2024
    • Market Size Value (USD Billion) & Volume (kilotons) Forecast By Market Taxonomy, 2025 to 2035
      • By Country
        • GCC Countries
        • Northern Africa
        • South Africa
        • Turkiye
        • Rest of MEA
      • By Application
      • By End Use
    • Market Attractiveness Analysis
      • By Country
      • By Application
      • By End Use
    • Key Takeaways
  16. Key Countries Market Analysis
    • USA
      • Pricing Analysis
      • Market Share Analysis, 2024
        • By Application
        • By End Use
    • Canada
      • Pricing Analysis
      • Market Share Analysis, 2024
        • By Application
        • By End Use
    • Brazil
      • Pricing Analysis
      • Market Share Analysis, 2024
        • By Application
        • By End Use
    • Mexico
      • Pricing Analysis
      • Market Share Analysis, 2024
        • By Application
        • By End Use
    • Argentina
      • Pricing Analysis
      • Market Share Analysis, 2024
        • By Application
        • By End Use
  17. Market Structure Analysis
    • Competition Dashboard
    • Competition Benchmarking
    • Market Share Analysis of Top Players
      • By Regional
      • By Application
      • By End Use
  18. Competition Analysis
    • Competition Deep Dive
      • Nestlé S.A
        • Overview
        • Product Portfolio
        • Profitability by Market Segments (Product/Age /Sales Channel/Region)
        • Sales Footprint
        • Strategy Overview
          • Marketing Strategy
          • Product Strategy
          • Channel Strategy
      • ADM (Archer Daniels Midland)
        • Overview
        • Product Portfolio
        • Profitability by Market Segments (Product/Age /Sales Channel/Region)
        • Sales Footprint
        • Strategy Overview
          • Marketing Strategy
          • Product Strategy
          • Channel Strategy
      • Ingredion
        • Overview
        • Product Portfolio
        • Profitability by Market Segments (Product/Age /Sales Channel/Region)
        • Sales Footprint
        • Strategy Overview
          • Marketing Strategy
          • Product Strategy
          • Channel Strategy
      • AB Mauri Malaysia Sdn. Bhd
        • Overview
        • Product Portfolio
        • Profitability by Market Segments (Product/Age /Sales Channel/Region)
        • Sales Footprint
        • Strategy Overview
          • Marketing Strategy
          • Product Strategy
          • Channel Strategy
      • BASF SE
        • Overview
        • Product Portfolio
        • Profitability by Market Segments (Product/Age /Sales Channel/Region)
        • Sales Footprint
        • Strategy Overview
          • Marketing Strategy
          • Product Strategy
          • Channel Strategy
      • Ashland Inc.
        • Overview
        • Product Portfolio
        • Profitability by Market Segments (Product/Age /Sales Channel/Region)
        • Sales Footprint
        • Strategy Overview
          • Marketing Strategy
          • Product Strategy
          • Channel Strategy
      • Givaudan
        • Overview
        • Product Portfolio
        • Profitability by Market Segments (Product/Age /Sales Channel/Region)
        • Sales Footprint
        • Strategy Overview
          • Marketing Strategy
          • Product Strategy
          • Channel Strategy
      • Kerry
        • Overview
        • Product Portfolio
        • Profitability by Market Segments (Product/Age /Sales Channel/Region)
        • Sales Footprint
        • Strategy Overview
          • Marketing Strategy
          • Product Strategy
          • Channel Strategy
      • Kingherbs Limited
        • Overview
        • Product Portfolio
        • Profitability by Market Segments (Product/Age /Sales Channel/Region)
        • Sales Footprint
        • Strategy Overview
          • Marketing Strategy
          • Product Strategy
          • Channel Strategy
  19. Assumptions & Acronyms Used
  20. Research Methodology

List of Tables

  • Table 1: Global Market Value (USD Billion) Forecast by Region, 2020-2035
  • Table 2: Global Market Volume (kilotons) Forecast by Region, 2020-2035
  • Table 3: Global Market Value (USD Billion) Forecast by Application, 2020-2035
  • Table 4: Global Market Volume (kilotons) Forecast by Application, 2020-2035
  • Table 5: Global Market Value (USD Billion) Forecast by End Use, 2020-2035
  • Table 6: Global Market Volume (kilotons) Forecast by End Use, 2020-2035
  • Table 7: North America Market Value (USD Billion) Forecast by Country, 2020-2035
  • Table 8: North America Market Volume (kilotons) Forecast by Country, 2020-2035
  • Table 9: North America Market Value (USD Billion) Forecast by Application, 2020-2035
  • Table 10: North America Market Volume (kilotons) Forecast by Application, 2020-2035
  • Table 11: North America Market Value (USD Billion) Forecast by End Use, 2020-2035
  • Table 12: North America Market Volume (kilotons) Forecast by End Use, 2020-2035
  • Table 13: Latin America Market Value (USD Billion) Forecast by Country, 2020-2035
  • Table 14: Latin America Market Volume (kilotons) Forecast by Country, 2020-2035
  • Table 15: Latin America Market Value (USD Billion) Forecast by Application, 2020-2035
  • Table 16: Latin America Market Volume (kilotons) Forecast by Application, 2020-2035
  • Table 17: Latin America Market Value (USD Billion) Forecast by End Use, 2020-2035
  • Table 18: Latin America Market Volume (kilotons) Forecast by End Use, 2020-2035
  • Table 19: Western Europe Market Value (USD Billion) Forecast by Country, 2020-2035
  • Table 20: Western Europe Market Volume (kilotons) Forecast by Country, 2020-2035
  • Table 21: Western Europe Market Value (USD Billion) Forecast by Application, 2020-2035
  • Table 22: Western Europe Market Volume (kilotons) Forecast by Application, 2020-2035
  • Table 23: Western Europe Market Value (USD Billion) Forecast by End Use, 2020-2035
  • Table 24: Western Europe Market Volume (kilotons) Forecast by End Use, 2020-2035
  • Table 25: Eastern Europe Market Value (USD Billion) Forecast by Country, 2020-2035
  • Table 26: Eastern Europe Market Volume (kilotons) Forecast by Country, 2020-2035
  • Table 27: Eastern Europe Market Value (USD Billion) Forecast by Application, 2020-2035
  • Table 28: Eastern Europe Market Volume (kilotons) Forecast by Application, 2020-2035
  • Table 29: Eastern Europe Market Value (USD Billion) Forecast by End Use, 2020-2035
  • Table 30: Eastern Europe Market Volume (kilotons) Forecast by End Use, 2020-2035
  • Table 31: East Asia Market Value (USD Billion) Forecast by Country, 2020-2035
  • Table 32: East Asia Market Volume (kilotons) Forecast by Country, 2020-2035
  • Table 33: East Asia Market Value (USD Billion) Forecast by Application, 2020-2035
  • Table 34: East Asia Market Volume (kilotons) Forecast by Application, 2020-2035
  • Table 35: East Asia Market Value (USD Billion) Forecast by End Use, 2020-2035
  • Table 36: East Asia Market Volume (kilotons) Forecast by End Use, 2020-2035
  • Table 37: South Asia & Pacific Market Value (USD Billion) Forecast by Country, 2020-2035
  • Table 38: South Asia & Pacific Market Volume (kilotons) Forecast by Country, 2020-2035
  • Table 39: South Asia & Pacific Market Value (USD Billion) Forecast by Application, 2020-2035
  • Table 40: South Asia & Pacific Market Volume (kilotons) Forecast by Application, 2020-2035
  • Table 41: South Asia & Pacific Market Value (USD Billion) Forecast by End Use, 2020-2035
  • Table 42: South Asia & Pacific Market Volume (kilotons) Forecast by End Use, 2020-2035
  • Table 43: Middle East and Africa Market Value (USD Billion) Forecast by Country, 2020-2035
  • Table 44: Middle East and Africa Market Volume (kilotons) Forecast by Country, 2020-2035
  • Table 45: Middle East and Africa Market Value (USD Billion) Forecast by Application, 2020-2035
  • Table 46: Middle East and Africa Market Volume (kilotons) Forecast by Application, 2020-2035
  • Table 47: Middle East and Africa Market Value (USD Billion) Forecast by End Use, 2020-2035
  • Table 48: Middle East and Africa Market Volume (kilotons) Forecast by End Use, 2020-2035

List of Figures

  • Figure 1: Global Market Volume (kilotons) Forecast 2020-2035
  • Figure 2: Global Market Pricing Analysis
  • Figure 3: Global Market Value (USD Billion) Forecast 2020-2035
  • Figure 4: Global Market Value Share and BPS Analysis by Application, 2025 and 2035
  • Figure 5: Global Market Y-o-Y Growth Comparison by Application, 2025-2035
  • Figure 6: Global Market Attractiveness Analysis by Application
  • Figure 7: Global Market Value Share and BPS Analysis by End Use, 2025 and 2035
  • Figure 8: Global Market Y-o-Y Growth Comparison by End Use, 2025-2035
  • Figure 9: Global Market Attractiveness Analysis by End Use
  • Figure 10: Global Market Value (USD Billion) Share and BPS Analysis by Region, 2025 and 2035
  • Figure 11: Global Market Y-o-Y Growth Comparison by Region, 2025-2035
  • Figure 12: Global Market Attractiveness Analysis by Region
  • Figure 13: North America Market Incremental $ Opportunity, 2025-2035
  • Figure 14: Latin America Market Incremental $ Opportunity, 2025-2035
  • Figure 15: Western Europe Market Incremental $ Opportunity, 2025-2035
  • Figure 16: Eastern Europe Market Incremental $ Opportunity, 2025-2035
  • Figure 17: East Asia Market Incremental $ Opportunity, 2025-2035
  • Figure 18: South Asia & Pacific Market Incremental $ Opportunity, 2025-2035
  • Figure 19: Middle East and Africa Market Incremental $ Opportunity, 2025-2035
  • Figure 20: North America Market Value Share and BPS Analysis by Country, 2025 and 2035
  • Figure 21: North America Market Value Share and BPS Analysis by Application, 2025 and 2035
  • Figure 22: North America Market Y-o-Y Growth Comparison by Application, 2025-2035
  • Figure 23: North America Market Attractiveness Analysis by Application
  • Figure 24: North America Market Value Share and BPS Analysis by End Use, 2025 and 2035
  • Figure 25: North America Market Y-o-Y Growth Comparison by End Use, 2025-2035
  • Figure 26: North America Market Attractiveness Analysis by End Use
  • Figure 27: Latin America Market Value Share and BPS Analysis by Country, 2025 and 2035
  • Figure 28: Latin America Market Value Share and BPS Analysis by Application, 2025 and 2035
  • Figure 29: Latin America Market Y-o-Y Growth Comparison by Application, 2025-2035
  • Figure 30: Latin America Market Attractiveness Analysis by Application
  • Figure 31: Latin America Market Value Share and BPS Analysis by End Use, 2025 and 2035
  • Figure 32: Latin America Market Y-o-Y Growth Comparison by End Use, 2025-2035
  • Figure 33: Latin America Market Attractiveness Analysis by End Use
  • Figure 34: Western Europe Market Value Share and BPS Analysis by Country, 2025 and 2035
  • Figure 35: Western Europe Market Value Share and BPS Analysis by Application, 2025 and 2035
  • Figure 36: Western Europe Market Y-o-Y Growth Comparison by Application, 2025-2035
  • Figure 37: Western Europe Market Attractiveness Analysis by Application
  • Figure 38: Western Europe Market Value Share and BPS Analysis by End Use, 2025 and 2035
  • Figure 39: Western Europe Market Y-o-Y Growth Comparison by End Use, 2025-2035
  • Figure 40: Western Europe Market Attractiveness Analysis by End Use
  • Figure 41: Eastern Europe Market Value Share and BPS Analysis by Country, 2025 and 2035
  • Figure 42: Eastern Europe Market Value Share and BPS Analysis by Application, 2025 and 2035
  • Figure 43: Eastern Europe Market Y-o-Y Growth Comparison by Application, 2025-2035
  • Figure 44: Eastern Europe Market Attractiveness Analysis by Application
  • Figure 45: Eastern Europe Market Value Share and BPS Analysis by End Use, 2025 and 2035
  • Figure 46: Eastern Europe Market Y-o-Y Growth Comparison by End Use, 2025-2035
  • Figure 47: Eastern Europe Market Attractiveness Analysis by End Use
  • Figure 48: East Asia Market Value Share and BPS Analysis by Country, 2025 and 2035
  • Figure 49: East Asia Market Value Share and BPS Analysis by Application, 2025 and 2035
  • Figure 50: East Asia Market Y-o-Y Growth Comparison by Application, 2025-2035
  • Figure 51: East Asia Market Attractiveness Analysis by Application
  • Figure 52: East Asia Market Value Share and BPS Analysis by End Use, 2025 and 2035
  • Figure 53: East Asia Market Y-o-Y Growth Comparison by End Use, 2025-2035
  • Figure 54: East Asia Market Attractiveness Analysis by End Use
  • Figure 55: South Asia & Pacific Market Value Share and BPS Analysis by Country, 2025 and 2035
  • Figure 56: South Asia & Pacific Market Value Share and BPS Analysis by Application, 2025 and 2035
  • Figure 57: South Asia & Pacific Market Y-o-Y Growth Comparison by Application, 2025-2035
  • Figure 58: South Asia & Pacific Market Attractiveness Analysis by Application
  • Figure 59: South Asia & Pacific Market Value Share and BPS Analysis by End Use, 2025 and 2035
  • Figure 60: South Asia & Pacific Market Y-o-Y Growth Comparison by End Use, 2025-2035
  • Figure 61: South Asia & Pacific Market Attractiveness Analysis by End Use
  • Figure 62: Middle East and Africa Market Value Share and BPS Analysis by Country, 2025 and 2035
  • Figure 63: Middle East and Africa Market Value Share and BPS Analysis by Application, 2025 and 2035
  • Figure 64: Middle East and Africa Market Y-o-Y Growth Comparison by Application, 2025-2035
  • Figure 65: Middle East and Africa Market Attractiveness Analysis by Application
  • Figure 66: Middle East and Africa Market Value Share and BPS Analysis by End Use, 2025 and 2035
  • Figure 67: Middle East and Africa Market Y-o-Y Growth Comparison by End Use, 2025-2035
  • Figure 68: Middle East and Africa Market Attractiveness Analysis by End Use
  • Figure 69: Global Market - Tier Structure Analysis
  • Figure 70: Global Market - Company Share Analysis

Frequently Asked Questions

What is the projected size of the halal ingredient market in 2025?

The market size is valued at USD 3.4 billion in 2025.

What is the outlook on halal ingredient demand by 2035?

The market is projected to reach USD 4.7 billion by 2035, expanding at a CAGR of 3%.

Which application segment leads the halal ingredient market in 2025?

Food ingredients are expected to dominate with a 38% market share in 2025.

Which end-use sector contributes the highest revenue in the halal ingredient market?

Food processing is projected to lead with a 60% share in 2025.

Which country is expected to show the fastest growth in halal ingredient demand?

Japan is anticipated to grow at the highest CAGR of 6.5% through 2035.

Explore Similar Insights

Future Market Insights

Halal Ingredient Market