Bean Ingredients Market Size, Share, and Forecast Outlook 2025 to 2035

The bean ingredients market is projected to be valued at USD 3 billion in 2025 and expected to expand to USD 4.6 billion by 2035, growing at a CAGR of 4.3% between 2025 and 2035. The adoption of legumes in food processing has continued to expand, supported by advances in functional fractionation and dry extrusion preprocessing.
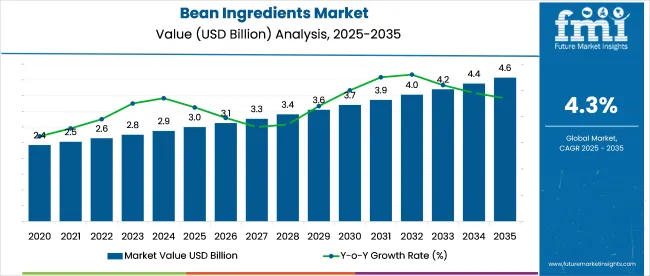
Quick Stats of Bean Ingredients Market

  • Market Value (2025): USD 3 billion
  • Forecast Value (2035): USD 4.6 billion
  • Forecast CAGR (2025 to 2035): 4.3%
  • Leading Segment in 2025: Conventional (52.6% share)
  • Key Growth Region: Asia Pacific (India is the fastest growing market with 6.6%)
  • Key Players: Cargill, Incorporated, Olam International, Archer Daniels Midland Company, MARA GLOBAL FOODS, Faribault Foods, Inc., Globeways Canada, Inc., The Organic Collective Limited, BETTER BEAN COMPANY, Inland Empire Foods, and Vermont Bean Crafters.

Bean Ingredients Market Market Value Analysis

Metric Value
Industry Size (2025E) USD 3 billion
Industry Value (2035F) USD 4.6 billion
CAGR (2025 to 2035) 4.3%

This approach has enabled producers to isolate polyphenols, oligosaccharides, and other micronutrient-rich subcomponents alongside protein and fiber. These derivatives are being incorporated into edible systems and non-food applications such as cosmetic emulsifiers and biodegradable packaging films. As a result, commercial applications are being diversified beyond traditional consumption formats, reshaping supply chains across both food and industrial ingredient sectors.

The bean ingredients market accounts for varying shares within its parent markets. It contributes approximately 18.5% to the pulse ingredients market, given its focus on black beans, chickpeas, and lentils. Within the broader plant-based ingredients space, its share is estimated at 6.2%, driven by its use in meat substitutes and snacks.

In the functional food ingredients category, bean-based formulations represent nearly 4.7%, owing to their fiber, protein, and micronutrient profile. The contribution to the food additives market remains marginal at around 1.8%, given its limited role beyond nutrition. In the specialty ingredients market, products account for close to 3.5%, primarily linked to gluten-free and allergen-free product applications. These shares highlight the market’s strategic but niche position across interrelated ingredient domains.

Midwestern ethanol biorefineries have retrofitted idle steeping tanks to hydro-fracture pulse hulls, enabling recovery of oligosaccharide-rich soluble that previously entered low-value feed channels. This adaptation, using surplus enzymes from adjacent corn wet-milling lines, now yields a syrup standardized at 22 °Bx. Beverage formulators are incorporating this syrup as a prebiotic ingredient, pricing it nearly 11% below imported chicory inulin.

Residual fiber cakes from the process are torrefied on-site into porous biochar, which serves as a filtration aid in bean protein isolate production, reducing the need for diatomaceous earth by about 7%. This integrated system is helping bean ingredient processors stabilize margins and reduce volatility tied to starch and fuel input costs.

Analysis of Bean Ingredients Market by Top Investment Segments

Conventional bean ingredients lead the product type segment due to their cost-efficiency and broad applicability in food manufacturing. Processed food production remains the dominant end-use, with growing interest in coffee-based applications. Modern trade drives distribution, while online platforms emerge as hubs.
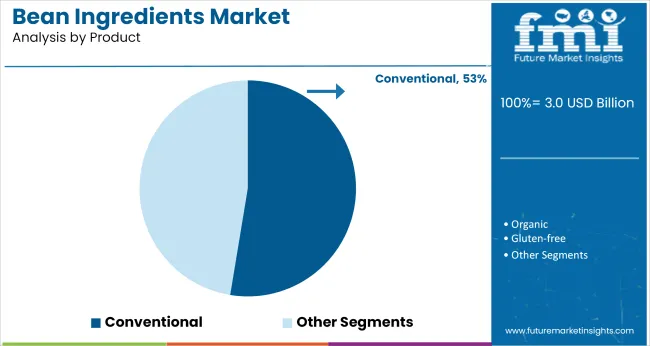
Conventional Products Dominate Product Type Segment with 52.6% Share

Bean Ingredients Market Analysis By Product

Conventional bean ingredients are expected to grow the leading share, accounting for 52.6% of total value in 2025. This dominance is supported by their widespread availability, established supply chains, and cost-efficiency in large-scale food manufacturing.
  • Conventional variants are used extensively in processed food categories, particularly in snacks and ready meals, where price sensitivity remains high.
  • While organic and gluten-free alternatives attract niche health-conscious consumers, it is the allergen-free sub-segment that is beginning to see meaningful traction, especially in developed markets where food intolerances and mandatory labeling have elevated consumer demand.
  • Despite formulation challenges, allergen-free products are being adopted in bakery and infant nutrition, carving out a specialized yet fast-expanding position in the industry.

Processed Food Production Leads, Coffee-Based Applications Expand

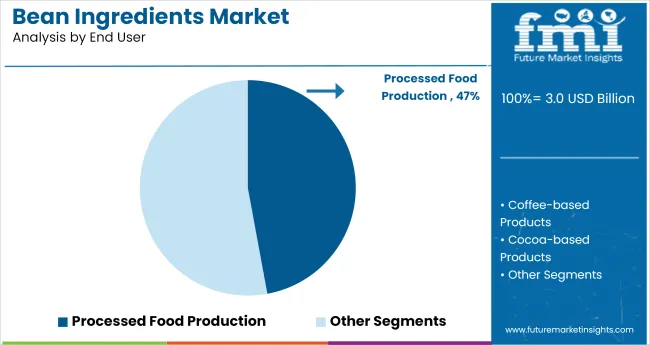
Bean Ingredients Market Analysis By End User

Processed food production is projected to contribute the highest share, estimated at 47.1%, within the usage landscape. This segment includes applications in snacks, soups, ready meals, and plant-based protein products.
  • Bean ingredients serve as cost-effective protein enhancers, fiber boosters, and binding agents in processed formulations.
  • The demand from large-scale food manufacturers continues to rise due to the scalability and extended shelf life of bean-based inputs.
  • Coffee-based product formulations have emerged as a growing sub-segment, particularly in protein-infused cold brews and ready-to-drink beverages.

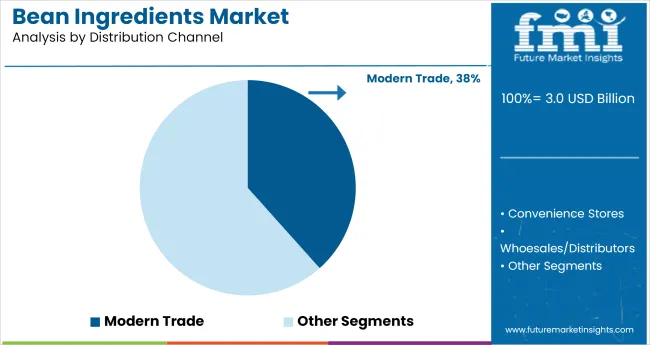
By Distribution Channel, Online Segment Accounts for Over 38.4% Share

Bean Ingredients Market Analysis By Distribution Channel

Modern trade is projected to capture the largest share at 38.4% in 2025, led by retail chains, supermarkets, and hypermarkets that offer broad product assortments and favorable shelf placements for bean-based products.

  • Shelf-ready packs of lentil flours and chickpea snacks are performing well in high-footfall retail environments.
  • The online sales sub-segment has begun to create a strong foothold, especially for niche categories like organic and allergen-free bean ingredients.
  • Direct-to-consumer models, subscription kits, and influencer-driven wellness platforms are making it easier to introduce novel product formats to targeted audiences.

Top Bean Ingredients Market Dynamics

Bean ingredients are gaining traction due to their cost-efficiency, shelf stability, and adaptability in clean-label reformulations. Evolving consumer preferences and regulatory pressures are accelerating, especially in allergen-free and hybrid formulations.

Cost-Efficiency and Supply Chain Resilience

The consistent demand for cost-effective, protein-dense ingredients has driven reliance on beans across mainstream food manufacturing. Bean ingredients are favored for their dual functionality, nutritional and structural, which reduces the need for synthetic additives. The ability to locally source beans in key agrarian economies ensures stable procurement, insulating producers from volatility in animal protein markets.

Manufacturers are also leveraging in applications demanding longer shelf life, such as ambient snacks and dry mixes, which adds commercial appeal. The shift toward reformulating products with label-friendly ingredients continues to make beans an essential input.

  • Bean ingredients reduce reliance on synthetic food additives
  • Local sourcing stabilizes supply chains and pricing
  • High shelf life improves storage, logistics, and distribution

Consumer Behavior and Regulatory Pressures Drive

Growing consumer focus on dietary fiber, clean labels, and allergen-free products has redefined the use case of product beyond protein alone. With rising intolerance awareness, especially across North America and Europe, demand for non-soy, gluten-free, and legume-based alternatives is accelerating.

Regulatory frameworks are also influencing product development by enforcing transparency in sourcing and ingredient disclosure. These conditions create a favorable environment for beans as they align with nutritional claims without compromising affordability. Innovation is also being observed in hybrid formulations, combining beans with ancient grains or pulses to enhance texture and nutrient absorption.
  • Rising food allergies increase demand for clean, bean-based formats
  • Policy mandates encourage transparent, compliant ingredient sourcing
  • Hybrid ingredient mixes expand bean application across food types

Top Countries Processing, Exporting, and Expanding Bean Ingredients Demand

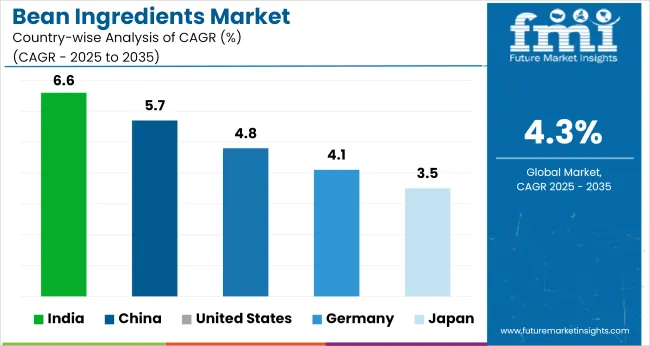
Bean Ingredients Market Cagr Analysis By Country

Country CAGR (2025 to 2035)
United States 4.8%
Germany 4.1%
Japan 3.5%
China 5.7%
India 6.6%

Global demand for bean ingredients is projected to rise at a 4.3% CAGR from 2025 to 2035. India, a BRICS member, outpaces the global average with 5.9% growth, supported by strong demand for protein-rich flours, extruded snack bases, and bakery blends. Regional clusters in Maharashtra and Madhya Pradesh are scaling pulse milling operations to serve domestic and Gulf buyers. China grows at 4.7%, fueled by expansion in meat alternatives and prebiotic-rich formulations for beverages.

ASEAN nations, including Thailand and Myanmar, average 4.4%, driven by regional trade in mung bean starches and sprout-based powders used in noodles and desserts. The United States, part of the OECD, tracks at 3.8%, slightly below global levels, due to input price volatility and substitution toward lentil and pea bases. Germany stands at 3.5%, reflecting saturation in meat analog categories and EFSA constraints on novel claims. UK demand slows to 3.1% amid reformulation fatigue and cost-led SKU rationalization.

The report covers a detailed analysis of 40+ countries and the top five countries have been shared as a reference.

Growth Analysis of Bean Ingredients Market in the United States

The USA bean ingredients market is projected to register a 4.8% CAGR during the forecast period. Growth is being fueled by steady reformulation work across major snack and ready-meal categories, where bean flours and concentrates replace animal proteins without compromising texture. Domestic pulse cultivation under the USDA’s supportive crop-rotation programs has strengthened procurement reliability and narrowed cost spreads versus imported soy.

Retailers are positioning bean-based items as nutrient-dense alternatives in center-store aisles, and foodservice chains are trialing legume blends in burgers and soups to meet menu-calorie targets. Continuous shelf-life studies by mid-sized processors have improved the handling of product, making them practical for large-batch production. Marketing messages now emphasize the fiber-protein combination, resonating with health-conscious households and dietitians.

  • Domestic pulse cultivation secures raw-material supply
  • R&D grants accelerate high-moisture extrusion capacity
  • Label-friendly reformulation aligns with FDA sodium-reduction goals

Demand Forecast for Bean Ingredients Market in China

China’s bean ingredients market is expected to grow at a 5.7% CAGR from 2025 to 2035. Expansion is underpinned by national nutrition guidelines that promote plant-derived proteins amid concerns about meat self-sufficiency. Provincial governments have funded processing clusters that integrate cleaning, milling, and isolation of pulse proteins, lowering entry barriers for beverage and noodle brands.

Demand also rides on e-commerce platforms that spotlight bean-based breakfast powders and children’s snacks, tapping tier-2 and tier-3 urban consumers seeking convenient nutrition. Domestic soy processors are diversifying into mung, adzuki, and chickpea inputs to hedge against price swings in oilseed crush margins. Export-oriented manufacturers see opportunities in Southeast Asia for ready-to-eat bean desserts.

  • Processing parks reduce logistics and milling costs
  • eCommerce drives adoption of instant bean beverages
  • Diversified pulse portfolio hedges against soy-price volatility

Analysis of Bean Ingredients Market in India

India’s bean ingredients market is forecast to advance at a 6.6% CAGR during the forecast period. A large vegetarian base favors beans as familiar staples, yet rising incomes have shifted consumption toward packaged snacks, instant mixes, and fortified flours that rely on pulse concentrates for protein claims.

Government procurement under the National Food Security Mission maintains consistent raw-material pricing, encouraging processors to expand extrusion and spray-drying capacity. Food Safety and Standards Authority of India guidelines on front-of-pack nutrition labeling have spurred brand investments in high-fiber, low-fat formulations using chickpea and lentil fractions. Export demand from GCC countries for gluten-free bean snacks adds an external growth lever.

  • Government procurement stabilizes pulse availability and pricing
  • Extrusion facilities broaden ready-to-eat pulse snack offerings
  • Front-of-pack labeling standards elevate high-protein bean blends

Bean Ingredients Market Growth Outlook in Japan

Japan’s bean ingredients sector is projected to record a 3.5% CAGR between 2025 and 2035. An aging population with a focus on gut health and muscle maintenance drives steady demand for high-protein, low-fat foods, prompting manufacturers to blend bean proteins into convenience-store meals and functional beverages.

Limited arable land necessitates import agreements with Canada and Myanmar for adzuki and mung beans, ensuring raw-material continuity. Advanced wet-fractionation technology in coastal plants yields ultra-fine bean powders suited to clear drinks and energy gels, formats popular with active seniors. Regulatory frameworks that restrict certain allergen disclosures further support the inclusion of bean derivatives over soy in niche applications.

  • Import pacts guarantee steady adzuki and mung bean flow
  • Wet-fractionation enables high-clarity bean protein beverages
  • Convenience-store channels showcase legume-infused ready meals

Future Outlook for Bean Ingredients Market in Germany

Germany is anticipated to grow at a 4.1% CAGR in bean ingredients, driven by diet shifts toward lower-impact proteins and strong demand for fiber enrichment in bakery and meat-alternative segments. Federal funding for pulse-processing pilot plants has streamlined dehulling, micronization, and texturizing steps, cutting production costs for small and mid-sized firms.

Supermarket chains promote bean-based cold cuts and spreads under their climate-friendly ranges, with QR codes linking to farm-level sourcing data. Food engineers are blending fava and navy bean proteins with wheat gluten to improve bite in sausages, a formulation now adopted by leading deli brands.
  • Pilot plants enhance processing yields and cost control
  • Retailer climate-oriented ranges favor bean-rich deli items
  • Bean-wheat blends improve texture in plant-based sausages

Leading Bean Ingredients Suppliers

Bean Ingredients Market Analysis By Company

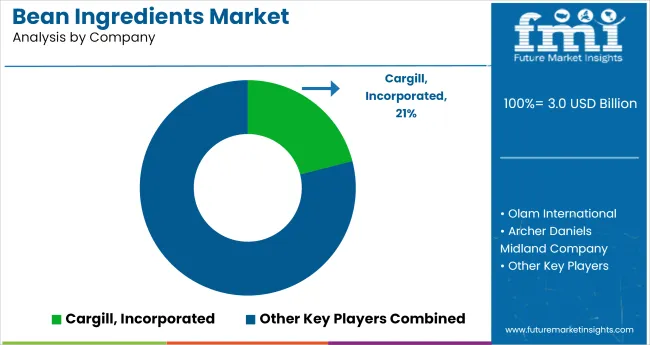
Key companies such as Cargill, Incorporated, Olam International, and Archer Daniels Midland Company drive bulk processing, pulse isolation, and cross-category formulation. Mid-sized innovators like MARA GLOBAL FOODS, Faribault Foods, Inc., and Globeways Canada, Inc. focus on pulse-based ready meals, organic flours, and protein concentrates.

The Organic Collective Limited and BETTER BEAN COMPANY specialize in non-GMO and allergen-free bean pastes and refrigerated items. Emerging players like Inland Empire Foods and Vermont Bean Crafters serve niche markets with craft-style blends and regional pulse-based offerings, highlighting the market’s balance between industrial scale and culinary.

Leading Players

  • Cargill, Incorporated
  • Olam International
  • Archer Daniels Midland Company
  • MARA GLOBAL FOODS
  • Faribault Foods, Inc.
  • Globeways Canada, Inc
  • The Organic Collective Limited
  • BETTER BEAN COMPANY
  • Inland Empire Foods
  • Vermont Bean Crafters

Report Coverage and Scope Summary

Report Attributes Details
Market Size (2025) USD 3.0 billion
Projected Market Size (2035) USD 4.6 billion
CAGR (2025 to 2035) 4.3%
Base Year for Estimation 2024
Historical Period 2020 to 2024
Projections Period 2025 to 2035
Quantitative Units USD billion for value and volume in metric tons
Product Type Analyzed (Segment 1) Organic, Conventional, Gluten-Free, and Allergen-Free Bean Ingredients.
End User Industry Analyzed (Segment 2) Coffee-Based Products, Processed Food Production, Cocoa-Based Products, and Residential or Commercial Purposes.
Distribution Channel Analyzed (Segment 3) Convenience Stores, Modern Trade, Wholesalers Or Distributors, Online Sales, and Other Sales Channels.
Regions Covered North America, Europe, Asia Pacific, Middle East & Africa, Latin America
Countries Covered United States, Canada, Germany, United Kingdom, France, Italy, Spain, China, Japan, South Korea, India, Australia, Brazil, Mexico, Argentina, Saudi Arabia, UAE, South Africa
Key Players Cargill, Incorporated, Olam International, Archer Daniels Midland Company, MARA GLOBAL FOODS, Faribault Foods, Inc., Globeways Canada, Inc., The Organic Collective Limited, BETTER BEAN COMPANY, Inland Empire Foods, and Vermont Bean Crafters.
Additional Attributes Dollar sales, share by product type, end use, and region, demand trends, sourcing costs, processing, competitor positioning, retail penetration, and future growth pockets.

Key Segments

By Product Type:

The industry is segmented into organic, conventional, gluten-free, and allergen-free bean ingredients.

By End Use Industry:

The key end users include coffee-based products, processed food production, cocoa-based products, and residential or commercial purposes.

By Distribution Channel:

The industry finds applications in convenience stores, modern trade, wholesalers or distributors, online sales, and other sales channels.

By Region:

The industry covers regions including North America, Europe, Asia Pacific, Latin America, and the Middle East & Africa.

Table of Content

  1. Executive Summary
    • Global Market Outlook
    • Demand-side Trends
    • Supply-side Trends
    • Technology Roadmap Analysis
    • Analysis and Recommendations
  2. Market Overview
    • Market Coverage / Taxonomy
    • Market Definition / Scope / Limitations
  3. Market Background
    • Market Dynamics
      • Drivers
      • Restraints
      • Opportunity
      • Trends
    • Scenario Forecast
      • Demand in Optimistic Scenario
      • Demand in Likely Scenario
      • Demand in Conservative Scenario
    • Opportunity Map Analysis
    • Product Life Cycle Analysis
    • Supply Chain Analysis
      • Supply Side Participants and their Roles
        • Producers
        • Mid-Level Participants (Traders/ Agents/ Brokers)
        • Wholesalers and Distributors
      • Value Added and Value Created at Node in the Supply Chain
      • List of Raw Material Suppliers
      • List of Existing and Potential Buyer’s
    • Investment Feasibility Matrix
    • Value Chain Analysis
      • Profit Margin Analysis
      • Wholesalers and Distributors
      • Retailers
    • PESTLE and Porter’s Analysis
    • Regulatory Landscape
      • By Key Regions
      • By Key Countries
    • Regional Parent Market Outlook
    • Production and Consumption Statistics
    • Import and Export Statistics
  4. Global Market Analysis 2020 to 2024 and Forecast, 2025 to 2035
    • Historical Market Size Value (USD Billion) & Volume in (Metric tons) Analysis, 2020 to 2024
    • Current and Future Market Size Value (USD Billion) & Volume in (Metric tons) Projections, 2025 to 2035
      • Y-o-Y Growth Trend Analysis
      • Absolute $ Opportunity Analysis
  5. Global Market Pricing Analysis 2020 to 2024 and Forecast 2025 to 2035
  6. Global Market Analysis 2020 to 2024 and Forecast 2025 to 2035, By Product Type
    • Introduction / Key Findings
    • Historical Market Size Value (USD Billion) & Volume in (Metric tons) Analysis By Product Type, 2020 to 2024
    • Current and Future Market Size Value (USD Billion) & Volume in (Metric tons) Analysis and Forecast By Product Type, 2025 to 2035
      • Organic
      • Conventional
      • Gluten Free
      • Allergen Free
    • Y-o-Y Growth Trend Analysis By Product Type, 2020 to 2024
    • Absolute $ Opportunity Analysis By Product Type, 2025 to 2035
  7. Global Market Analysis 2020 to 2024 and Forecast 2025 to 2035, By End Use Industry
    • Introduction / Key Findings
    • Historical Market Size Value (USD Billion) & Volume in (Metric tons) Analysis By End Use Industry, 2020 to 2024
    • Current and Future Market Size Value (USD Billion) & Volume in (Metric tons) Analysis and Forecast By End Use Industry, 2025 to 2035
      • Coffee-based products
      • Processed Food Production
      • Cocoa-based products
      • Residential/Commercial purpose
    • Y-o-Y Growth Trend Analysis By End Use Industry, 2020 to 2024
    • Absolute $ Opportunity Analysis By End Use Industry, 2025 to 2035
  8. Global Market Analysis 2020 to 2024 and Forecast 2025 to 2035, By Distribution Channel
    • Introduction / Key Findings
    • Historical Market Size Value (USD Billion) & Volume in (Metric tons) Analysis By Distribution Channel, 2020 to 2024
    • Current and Future Market Size Value (USD Billion) & Volume in (Metric tons) Analysis and Forecast By Distribution Channel, 2025 to 2035
      • Convenience Stores
      • Modern Trade
      • Wholesaler/Distributor
      • Online Sales
      • Other Sales Channel
    • Y-o-Y Growth Trend Analysis By Distribution Channel, 2020 to 2024
    • Absolute $ Opportunity Analysis By Distribution Channel, 2025 to 2035
  9. Global Market Analysis 2020 to 2024 and Forecast 2025 to 2035, By Region
    • Introduction
    • Historical Market Size Value (USD Billion) & Volume in (Metric tons) Analysis By Region, 2020 to 2024
    • Current Market Size Value (USD Billion) & Volume in (Metric tons) Analysis and Forecast By Region, 2025 to 2035
      • North America
      • Latin America
      • Western Europe
      • Eastern Europe
      • East Asia
      • South Asia & Pacific
      • Middle East and Africa
    • Market Attractiveness Analysis By Region
  10. North America Market Analysis 2020 to 2024 and Forecast 2025 to 2035, By Country
    • Historical Market Size Value (USD Billion) & Volume in (Metric tons) Trend Analysis By Market Taxonomy, 2020 to 2024
    • Market Size Value (USD Billion) & Volume in (Metric tons) Forecast By Market Taxonomy, 2025 to 2035
      • By Country
        • USA
        • Canada
        • Mexico
      • By Product Type
      • By End Use Industry
      • By Distribution Channel
    • Market Attractiveness Analysis
      • By Country
      • By Product Type
      • By End Use Industry
      • By Distribution Channel
    • Key Takeaways
  11. Latin America Market Analysis 2020 to 2024 and Forecast 2025 to 2035, By Country
    • Historical Market Size Value (USD Billion) & Volume in (Metric tons) Trend Analysis By Market Taxonomy, 2020 to 2024
    • Market Size Value (USD Billion) & Volume in (Metric tons) Forecast By Market Taxonomy, 2025 to 2035
      • By Country
        • Brazil
        • Argentina
        • Rest of LATAM
      • By Product Type
      • By End Use Industry
      • By Distribution Channel
    • Market Attractiveness Analysis
      • By Country
      • By Product Type
      • By End Use Industry
      • By Distribution Channel
    • Key Takeaways
  12. Western Europe Market Analysis 2020 to 2024 and Forecast 2025 to 2035, By Country
    • Historical Market Size Value (USD Billion) & Volume in (Metric tons) Trend Analysis By Market Taxonomy, 2020 to 2024
    • Market Size Value (USD Billion) & Volume in (Metric tons) Forecast By Market Taxonomy, 2025 to 2035
      • By Country
        • Germany
        • Italy
        • France
        • UK
        • Spain
        • BENELUX
        • Nordic
        • Rest of W.Europe
      • By Product Type
      • By End Use Industry
      • By Distribution Channel
    • Market Attractiveness Analysis
      • By Country
      • By Product Type
      • By End Use Industry
      • By Distribution Channel
    • Key Takeaways
  13. Eastern Europe Market Analysis 2020 to 2024 and Forecast 2025 to 2035, By Country
    • Historical Market Size Value (USD Billion) & Volume in (Metric tons) Trend Analysis By Market Taxonomy, 2020 to 2024
    • Market Size Value (USD Billion) & Volume in (Metric tons) Forecast By Market Taxonomy, 2025 to 2035
      • By Country
        • Russia
        • Hungary
        • Poland
        • Balkan & Baltics
        • Rest of E. Europe
      • By Product Type
      • By End Use Industry
      • By Distribution Channel
    • Market Attractiveness Analysis
      • By Country
      • By Product Type
      • By End Use Industry
      • By Distribution Channel
    • Key Takeaways
  14. East Asia Market Analysis 2020 to 2024 and Forecast 2025 to 2035, By Country
    • Historical Market Size Value (USD Billion) & Volume in (Metric tons) Trend Analysis By Market Taxonomy, 2020 to 2024
    • Market Size Value (USD Billion) & Volume in (Metric tons) Forecast By Market Taxonomy, 2025 to 2035
      • By Country
        • China
        • Japan
        • South Korea
      • By Product Type
      • By End Use Industry
      • By Distribution Channel
    • Market Attractiveness Analysis
      • By Country
      • By Product Type
      • By End Use Industry
      • By Distribution Channel
    • Key Takeaways
  15. South Asia & Pacific Market Analysis 2020 to 2024 and Forecast 2025 to 2035, By Country
    • Historical Market Size Value (USD Billion) & Volume in (Metric tons) Trend Analysis By Market Taxonomy, 2020 to 2024
    • Market Size Value (USD Billion) & Volume in (Metric tons) Forecast By Market Taxonomy, 2025 to 2035
      • By Country
        • India
        • Australia & New Zealand
        • ASEAN
        • Rest of SAP
      • By Product Type
      • By End Use Industry
      • By Distribution Channel
    • Market Attractiveness Analysis
      • By Country
      • By Product Type
      • By End Use Industry
      • By Distribution Channel
    • Key Takeaways
  16. Middle East and Africa Market Analysis 2020 to 2024 and Forecast 2025 to 2035, By Country
    • Historical Market Size Value (USD Billion) & Volume in (Metric tons) Trend Analysis By Market Taxonomy, 2020 to 2024
    • Market Size Value (USD Billion) & Volume in (Metric tons) Forecast By Market Taxonomy, 2025 to 2035
      • By Country
        • GCC Countries
        • Northern Africa
        • South Africa
        • Turkiye
        • Rest of MEA
      • By Product Type
      • By End Use Industry
      • By Distribution Channel
    • Market Attractiveness Analysis
      • By Country
      • By Product Type
      • By End Use Industry
      • By Distribution Channel
    • Key Takeaways
  17. Key Countries Market Analysis
    • USA
      • Pricing Analysis
      • Market Share Analysis, 2024
        • By Product Type
        • By End Use Industry
        • By Distribution Channel
    • Canada
      • Pricing Analysis
      • Market Share Analysis, 2024
        • By Product Type
        • By End Use Industry
        • By Distribution Channel
    • Brazil
      • Pricing Analysis
      • Market Share Analysis, 2024
        • By Product Type
        • By End Use Industry
        • By Distribution Channel
    • Mexico
      • Pricing Analysis
      • Market Share Analysis, 2024
        • By Product Type
        • By End Use Industry
        • By Distribution Channel
    • Argentina
      • Pricing Analysis
      • Market Share Analysis, 2024
        • By Product Type
        • By End Use Industry
        • By Distribution Channel
  18. Market Structure Analysis
    • Competition Dashboard
    • Competition Benchmarking
    • Market Share Analysis of Top Players
      • By Regional
      • By Product Type
      • By End Use Industry
      • By Distribution Channel
  19. Competition Analysis
    • Competition Deep Dive
      • Cargill, Incorporated
        • Overview
        • Product Portfolio
        • Profitability by Market Segments (Product/Age /Sales Channel/Region)
        • Sales Footprint
        • Strategy Overview
          • Marketing Strategy
          • Product Strategy
          • Channel Strategy
      • Olam International
        • Overview
        • Product Portfolio
        • Profitability by Market Segments (Product/Age /Sales Channel/Region)
        • Sales Footprint
        • Strategy Overview
          • Marketing Strategy
          • Product Strategy
          • Channel Strategy
      • Archer Daniels Midland Company
        • Overview
        • Product Portfolio
        • Profitability by Market Segments (Product/Age /Sales Channel/Region)
        • Sales Footprint
        • Strategy Overview
          • Marketing Strategy
          • Product Strategy
          • Channel Strategy
      • MARA GLOBAL FOODS
        • Overview
        • Product Portfolio
        • Profitability by Market Segments (Product/Age /Sales Channel/Region)
        • Sales Footprint
        • Strategy Overview
          • Marketing Strategy
          • Product Strategy
          • Channel Strategy
      • Faribault Foods, Inc.
        • Overview
        • Product Portfolio
        • Profitability by Market Segments (Product/Age /Sales Channel/Region)
        • Sales Footprint
        • Strategy Overview
          • Marketing Strategy
          • Product Strategy
          • Channel Strategy
      • Globeways Canada, Inc
        • Overview
        • Product Portfolio
        • Profitability by Market Segments (Product/Age /Sales Channel/Region)
        • Sales Footprint
        • Strategy Overview
          • Marketing Strategy
          • Product Strategy
          • Channel Strategy
      • The Organic Collective Limited
        • Overview
        • Product Portfolio
        • Profitability by Market Segments (Product/Age /Sales Channel/Region)
        • Sales Footprint
        • Strategy Overview
          • Marketing Strategy
          • Product Strategy
          • Channel Strategy
      • BETTER BEAN COMPANY
        • Overview
        • Product Portfolio
        • Profitability by Market Segments (Product/Age /Sales Channel/Region)
        • Sales Footprint
        • Strategy Overview
          • Marketing Strategy
          • Product Strategy
          • Channel Strategy
      • Inland Empire Foods
        • Overview
        • Product Portfolio
        • Profitability by Market Segments (Product/Age /Sales Channel/Region)
        • Sales Footprint
        • Strategy Overview
          • Marketing Strategy
          • Product Strategy
          • Channel Strategy
      • Vermont Bean Crafters
        • Overview
        • Product Portfolio
        • Profitability by Market Segments (Product/Age /Sales Channel/Region)
        • Sales Footprint
        • Strategy Overview
          • Marketing Strategy
          • Product Strategy
          • Channel Strategy
  20. Assumptions & Acronyms Used
  21. Research Methodology

List of Tables

  • Table 1: Global Market Value (USD Billion) Forecast by Region, 2020-2035
  • Table 2: Global Market Volume in (Metric tons) Forecast by Region, 2020-2035
  • Table 3: Global Market Value (USD Billion) Forecast by Product Type, 2020-2035
  • Table 4: Global Market Volume in (Metric tons) Forecast by Product Type, 2020-2035
  • Table 5: Global Market Value (USD Billion) Forecast by End Use Industry, 2020-2035
  • Table 6: Global Market Volume in (Metric tons) Forecast by End Use Industry, 2020-2035
  • Table 7: Global Market Value (USD Billion) Forecast by Distribution Channel, 2020-2035
  • Table 8: Global Market Volume in (Metric tons) Forecast by Distribution Channel, 2020-2035
  • Table 9: North America Market Value (USD Billion) Forecast by Country, 2020-2035
  • Table 10: North America Market Volume in (Metric tons) Forecast by Country, 2020-2035
  • Table 11: North America Market Value (USD Billion) Forecast by Product Type, 2020-2035
  • Table 12: North America Market Volume in (Metric tons) Forecast by Product Type, 2020-2035
  • Table 13: North America Market Value (USD Billion) Forecast by End Use Industry, 2020-2035
  • Table 14: North America Market Volume in (Metric tons) Forecast by End Use Industry, 2020-2035
  • Table 15: North America Market Value (USD Billion) Forecast by Distribution Channel, 2020-2035
  • Table 16: North America Market Volume in (Metric tons) Forecast by Distribution Channel, 2020-2035
  • Table 17: Latin America Market Value (USD Billion) Forecast by Country, 2020-2035
  • Table 18: Latin America Market Volume in (Metric tons) Forecast by Country, 2020-2035
  • Table 19: Latin America Market Value (USD Billion) Forecast by Product Type, 2020-2035
  • Table 20: Latin America Market Volume in (Metric tons) Forecast by Product Type, 2020-2035
  • Table 21: Latin America Market Value (USD Billion) Forecast by End Use Industry, 2020-2035
  • Table 22: Latin America Market Volume in (Metric tons) Forecast by End Use Industry, 2020-2035
  • Table 23: Latin America Market Value (USD Billion) Forecast by Distribution Channel, 2020-2035
  • Table 24: Latin America Market Volume in (Metric tons) Forecast by Distribution Channel, 2020-2035
  • Table 25: Western Europe Market Value (USD Billion) Forecast by Country, 2020-2035
  • Table 26: Western Europe Market Volume in (Metric tons) Forecast by Country, 2020-2035
  • Table 27: Western Europe Market Value (USD Billion) Forecast by Product Type, 2020-2035
  • Table 28: Western Europe Market Volume in (Metric tons) Forecast by Product Type, 2020-2035
  • Table 29: Western Europe Market Value (USD Billion) Forecast by End Use Industry, 2020-2035
  • Table 30: Western Europe Market Volume in (Metric tons) Forecast by End Use Industry, 2020-2035
  • Table 31: Western Europe Market Value (USD Billion) Forecast by Distribution Channel, 2020-2035
  • Table 32: Western Europe Market Volume in (Metric tons) Forecast by Distribution Channel, 2020-2035
  • Table 33: Eastern Europe Market Value (USD Billion) Forecast by Country, 2020-2035
  • Table 34: Eastern Europe Market Volume in (Metric tons) Forecast by Country, 2020-2035
  • Table 35: Eastern Europe Market Value (USD Billion) Forecast by Product Type, 2020-2035
  • Table 36: Eastern Europe Market Volume in (Metric tons) Forecast by Product Type, 2020-2035
  • Table 37: Eastern Europe Market Value (USD Billion) Forecast by End Use Industry, 2020-2035
  • Table 38: Eastern Europe Market Volume in (Metric tons) Forecast by End Use Industry, 2020-2035
  • Table 39: Eastern Europe Market Value (USD Billion) Forecast by Distribution Channel, 2020-2035
  • Table 40: Eastern Europe Market Volume in (Metric tons) Forecast by Distribution Channel, 2020-2035
  • Table 41: East Asia Market Value (USD Billion) Forecast by Country, 2020-2035
  • Table 42: East Asia Market Volume in (Metric tons) Forecast by Country, 2020-2035
  • Table 43: East Asia Market Value (USD Billion) Forecast by Product Type, 2020-2035
  • Table 44: East Asia Market Volume in (Metric tons) Forecast by Product Type, 2020-2035
  • Table 45: East Asia Market Value (USD Billion) Forecast by End Use Industry, 2020-2035
  • Table 46: East Asia Market Volume in (Metric tons) Forecast by End Use Industry, 2020-2035
  • Table 47: East Asia Market Value (USD Billion) Forecast by Distribution Channel, 2020-2035
  • Table 48: East Asia Market Volume in (Metric tons) Forecast by Distribution Channel, 2020-2035
  • Table 49: South Asia & Pacific Market Value (USD Billion) Forecast by Country, 2020-2035
  • Table 50: South Asia & Pacific Market Volume in (Metric tons) Forecast by Country, 2020-2035
  • Table 51: South Asia & Pacific Market Value (USD Billion) Forecast by Product Type, 2020-2035
  • Table 52: South Asia & Pacific Market Volume in (Metric tons) Forecast by Product Type, 2020-2035
  • Table 53: South Asia & Pacific Market Value (USD Billion) Forecast by End Use Industry, 2020-2035
  • Table 54: South Asia & Pacific Market Volume in (Metric tons) Forecast by End Use Industry, 2020-2035
  • Table 55: South Asia & Pacific Market Value (USD Billion) Forecast by Distribution Channel, 2020-2035
  • Table 56: South Asia & Pacific Market Volume in (Metric tons) Forecast by Distribution Channel, 2020-2035
  • Table 57: Middle East and Africa Market Value (USD Billion) Forecast by Country, 2020-2035
  • Table 58: Middle East and Africa Market Volume in (Metric tons) Forecast by Country, 2020-2035
  • Table 59: Middle East and Africa Market Value (USD Billion) Forecast by Product Type, 2020-2035
  • Table 60: Middle East and Africa Market Volume in (Metric tons) Forecast by Product Type, 2020-2035
  • Table 61: Middle East and Africa Market Value (USD Billion) Forecast by End Use Industry, 2020-2035
  • Table 62: Middle East and Africa Market Volume in (Metric tons) Forecast by End Use Industry, 2020-2035
  • Table 63: Middle East and Africa Market Value (USD Billion) Forecast by Distribution Channel, 2020-2035
  • Table 64: Middle East and Africa Market Volume in (Metric tons) Forecast by Distribution Channel, 2020-2035

List of Figures

  • Figure 1: Global Market Volume in (Metric tons) Forecast 2020-2035
  • Figure 2: Global Market Pricing Analysis
  • Figure 3: Global Market Value (USD Billion) Forecast 2020-2035
  • Figure 4: Global Market Value Share and BPS Analysis by Product Type, 2025 and 2035
  • Figure 5: Global Market Y-o-Y Growth Comparison by Product Type, 2025-2035
  • Figure 6: Global Market Attractiveness Analysis by Product Type
  • Figure 7: Global Market Value Share and BPS Analysis by End Use Industry, 2025 and 2035
  • Figure 8: Global Market Y-o-Y Growth Comparison by End Use Industry, 2025-2035
  • Figure 9: Global Market Attractiveness Analysis by End Use Industry
  • Figure 10: Global Market Value Share and BPS Analysis by Distribution Channel, 2025 and 2035
  • Figure 11: Global Market Y-o-Y Growth Comparison by Distribution Channel, 2025-2035
  • Figure 12: Global Market Attractiveness Analysis by Distribution Channel
  • Figure 13: Global Market Value (USD Billion) Share and BPS Analysis by Region, 2025 and 2035
  • Figure 14: Global Market Y-o-Y Growth Comparison by Region, 2025-2035
  • Figure 15: Global Market Attractiveness Analysis by Region
  • Figure 16: North America Market Incremental $ Opportunity, 2025-2035
  • Figure 17: Latin America Market Incremental $ Opportunity, 2025-2035
  • Figure 18: Western Europe Market Incremental $ Opportunity, 2025-2035
  • Figure 19: Eastern Europe Market Incremental $ Opportunity, 2025-2035
  • Figure 20: East Asia Market Incremental $ Opportunity, 2025-2035
  • Figure 21: South Asia & Pacific Market Incremental $ Opportunity, 2025-2035
  • Figure 22: Middle East and Africa Market Incremental $ Opportunity, 2025-2035
  • Figure 23: North America Market Value Share and BPS Analysis by Country, 2025 and 2035
  • Figure 24: North America Market Value Share and BPS Analysis by Product Type, 2025 and 2035
  • Figure 25: North America Market Y-o-Y Growth Comparison by Product Type, 2025-2035
  • Figure 26: North America Market Attractiveness Analysis by Product Type
  • Figure 27: North America Market Value Share and BPS Analysis by End Use Industry, 2025 and 2035
  • Figure 28: North America Market Y-o-Y Growth Comparison by End Use Industry, 2025-2035
  • Figure 29: North America Market Attractiveness Analysis by End Use Industry
  • Figure 30: North America Market Value Share and BPS Analysis by Distribution Channel, 2025 and 2035
  • Figure 31: North America Market Y-o-Y Growth Comparison by Distribution Channel, 2025-2035
  • Figure 32: North America Market Attractiveness Analysis by Distribution Channel
  • Figure 33: Latin America Market Value Share and BPS Analysis by Country, 2025 and 2035
  • Figure 34: Latin America Market Value Share and BPS Analysis by Product Type, 2025 and 2035
  • Figure 35: Latin America Market Y-o-Y Growth Comparison by Product Type, 2025-2035
  • Figure 36: Latin America Market Attractiveness Analysis by Product Type
  • Figure 37: Latin America Market Value Share and BPS Analysis by End Use Industry, 2025 and 2035
  • Figure 38: Latin America Market Y-o-Y Growth Comparison by End Use Industry, 2025-2035
  • Figure 39: Latin America Market Attractiveness Analysis by End Use Industry
  • Figure 40: Latin America Market Value Share and BPS Analysis by Distribution Channel, 2025 and 2035
  • Figure 41: Latin America Market Y-o-Y Growth Comparison by Distribution Channel, 2025-2035
  • Figure 42: Latin America Market Attractiveness Analysis by Distribution Channel
  • Figure 43: Western Europe Market Value Share and BPS Analysis by Country, 2025 and 2035
  • Figure 44: Western Europe Market Value Share and BPS Analysis by Product Type, 2025 and 2035
  • Figure 45: Western Europe Market Y-o-Y Growth Comparison by Product Type, 2025-2035
  • Figure 46: Western Europe Market Attractiveness Analysis by Product Type
  • Figure 47: Western Europe Market Value Share and BPS Analysis by End Use Industry, 2025 and 2035
  • Figure 48: Western Europe Market Y-o-Y Growth Comparison by End Use Industry, 2025-2035
  • Figure 49: Western Europe Market Attractiveness Analysis by End Use Industry
  • Figure 50: Western Europe Market Value Share and BPS Analysis by Distribution Channel, 2025 and 2035
  • Figure 51: Western Europe Market Y-o-Y Growth Comparison by Distribution Channel, 2025-2035
  • Figure 52: Western Europe Market Attractiveness Analysis by Distribution Channel
  • Figure 53: Eastern Europe Market Value Share and BPS Analysis by Country, 2025 and 2035
  • Figure 54: Eastern Europe Market Value Share and BPS Analysis by Product Type, 2025 and 2035
  • Figure 55: Eastern Europe Market Y-o-Y Growth Comparison by Product Type, 2025-2035
  • Figure 56: Eastern Europe Market Attractiveness Analysis by Product Type
  • Figure 57: Eastern Europe Market Value Share and BPS Analysis by End Use Industry, 2025 and 2035
  • Figure 58: Eastern Europe Market Y-o-Y Growth Comparison by End Use Industry, 2025-2035
  • Figure 59: Eastern Europe Market Attractiveness Analysis by End Use Industry
  • Figure 60: Eastern Europe Market Value Share and BPS Analysis by Distribution Channel, 2025 and 2035
  • Figure 61: Eastern Europe Market Y-o-Y Growth Comparison by Distribution Channel, 2025-2035
  • Figure 62: Eastern Europe Market Attractiveness Analysis by Distribution Channel
  • Figure 63: East Asia Market Value Share and BPS Analysis by Country, 2025 and 2035
  • Figure 64: East Asia Market Value Share and BPS Analysis by Product Type, 2025 and 2035
  • Figure 65: East Asia Market Y-o-Y Growth Comparison by Product Type, 2025-2035
  • Figure 66: East Asia Market Attractiveness Analysis by Product Type
  • Figure 67: East Asia Market Value Share and BPS Analysis by End Use Industry, 2025 and 2035
  • Figure 68: East Asia Market Y-o-Y Growth Comparison by End Use Industry, 2025-2035
  • Figure 69: East Asia Market Attractiveness Analysis by End Use Industry
  • Figure 70: East Asia Market Value Share and BPS Analysis by Distribution Channel, 2025 and 2035
  • Figure 71: East Asia Market Y-o-Y Growth Comparison by Distribution Channel, 2025-2035
  • Figure 72: East Asia Market Attractiveness Analysis by Distribution Channel
  • Figure 73: South Asia & Pacific Market Value Share and BPS Analysis by Country, 2025 and 2035
  • Figure 74: South Asia & Pacific Market Value Share and BPS Analysis by Product Type, 2025 and 2035
  • Figure 75: South Asia & Pacific Market Y-o-Y Growth Comparison by Product Type, 2025-2035
  • Figure 76: South Asia & Pacific Market Attractiveness Analysis by Product Type
  • Figure 77: South Asia & Pacific Market Value Share and BPS Analysis by End Use Industry, 2025 and 2035
  • Figure 78: South Asia & Pacific Market Y-o-Y Growth Comparison by End Use Industry, 2025-2035
  • Figure 79: South Asia & Pacific Market Attractiveness Analysis by End Use Industry
  • Figure 80: South Asia & Pacific Market Value Share and BPS Analysis by Distribution Channel, 2025 and 2035
  • Figure 81: South Asia & Pacific Market Y-o-Y Growth Comparison by Distribution Channel, 2025-2035
  • Figure 82: South Asia & Pacific Market Attractiveness Analysis by Distribution Channel
  • Figure 83: Middle East and Africa Market Value Share and BPS Analysis by Country, 2025 and 2035
  • Figure 84: Middle East and Africa Market Value Share and BPS Analysis by Product Type, 2025 and 2035
  • Figure 85: Middle East and Africa Market Y-o-Y Growth Comparison by Product Type, 2025-2035
  • Figure 86: Middle East and Africa Market Attractiveness Analysis by Product Type
  • Figure 87: Middle East and Africa Market Value Share and BPS Analysis by End Use Industry, 2025 and 2035
  • Figure 88: Middle East and Africa Market Y-o-Y Growth Comparison by End Use Industry, 2025-2035
  • Figure 89: Middle East and Africa Market Attractiveness Analysis by End Use Industry
  • Figure 90: Middle East and Africa Market Value Share and BPS Analysis by Distribution Channel, 2025 and 2035
  • Figure 91: Middle East and Africa Market Y-o-Y Growth Comparison by Distribution Channel, 2025-2035
  • Figure 92: Middle East and Africa Market Attractiveness Analysis by Distribution Channel
  • Figure 93: Global Market - Tier Structure Analysis
  • Figure 94: Global Market - Company Share Analysis

Frequently Asked Questions

What is the estimated market size of the bean ingredients industry in 2025?

The industry is valued at USD 3.0 billion in 2025.

What is the projected industry size of the bean ingredients industry by 2035?

It is forecasted to reach USD 4.6 billion by 2035.

What is the expected CAGR for the bean ingredients industry between 2025 and 2035?

The industry is anticipated to grow at a CAGR of 4.3% during this period.

Which segment is expected to lead the bean ingredients market in 2025?

Conventional are projected to lead the market with a 52.6% share in 2025.

Which region is expected to witness the highest growth in the bean ingredients market?

Asia Pacific, particularly India, is expected to be the key growth region with a projected growth rate of 6.6%.

Explore Similar Insights

Future Market Insights

Bean Ingredients Market