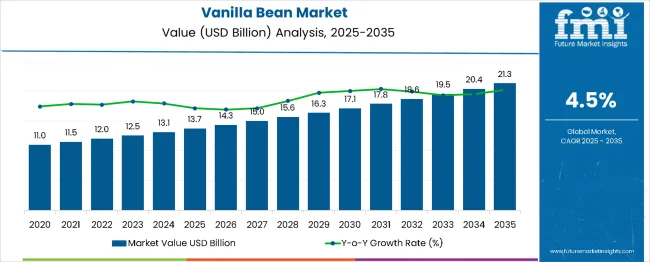
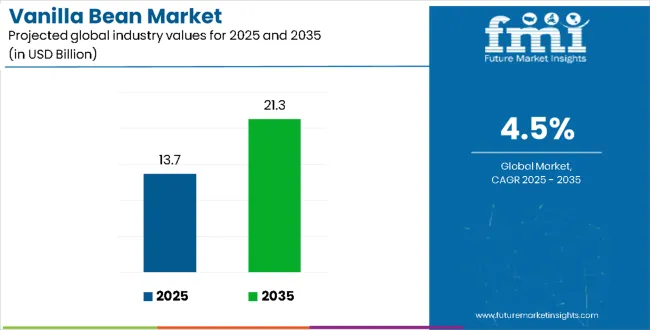
The global vanilla bean market is projected to grow from USD 13.7 billion in 2025 to approximately USD 21.3 billion by 2035, recording an absolute increase of USD 7.6 billion over the forecast period. This translates into a total growth of 55.5%, with the market forecast to expand at a compound annual growth rate (CAGR) of 4.5% between 2025 and 2035. The overall market size is expected to grow by nearly 1.56X during the same period, supported by increasing demand for natural flavoring agents, growing consumer preference for premium food products, and rising adoption of vanilla in diverse culinary applications across the global food and beverage industries.
Vanilla Bean Market Key Takeaways
| Metric | Value |
|---|---|
| Estimated Value in (2025E) | USD 13.7 billion |
| Forecast Value in (2035F) | USD 21.3 billion |
| Forecast CAGR (2025 to 2035) | 4.5% |
Between 2020 and 2024, the vanilla bean market experienced steady growth, driven by increasing consumer awareness of natural flavoring benefits and growing recognition of vanilla's versatility across food, beverage, and fragrance applications. The market developed as food manufacturers recognized the potential for vanilla to enhance product appeal while meeting clean-label requirements. Technological advancement in extraction methods and quality preservation began emphasizing the critical importance of maintaining flavor integrity while extending shelf life and improving cost-effectiveness.
Between 2025 and 2030, the vanilla bean market is projected to expand from USD 13.7 billion to USD 17.1 billion, resulting in a value increase of USD 3.4 billion, which represents 44.7% of the total forecast growth for the decade. This phase of development will be shaped by increasing consumer demand for natural and organic food ingredients, rising adoption of premium vanilla products in artisanal and gourmet applications, and growing utilization in bakery, confectionery, and beverage manufacturing. Food manufacturers and flavor companies are expanding their vanilla sourcing capabilities to address the growing preference for authentic vanilla flavor profiles in processed foods and premium culinary products.
From 2030 to 2035, the market is forecast to grow from USD 17.1 billion to USD 21.3 billion, adding another USD 4.2 billion, which constitutes 55.3% of the overall ten-year expansion. This period is expected to be characterized by the expansion of sustainable sourcing programs, the integration of traceability technologies for premium vanilla products, and the development of value-added vanilla formulations for specialized applications. The growing emphasis on ethical sourcing and fair trade practices will drive demand for certified vanilla products with transparent supply chain documentation and farmer support programs.
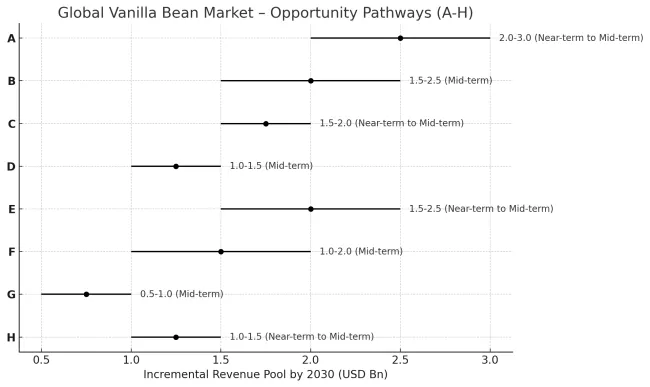
Vanilla beans are entering a period of strategic growth. With rising global demand for authentic, natural flavours, especially in clean-label, premium, and artisanal food & beverage products, vanilla’s value proposition is stronger than ever. Consumers increasingly prefer real beans over synthetic alternatives, and that preference supports premium pricing, origin differentiation, and sustainability premium.
At the same time, supply remains fragile: vanilla cultivation is labour-intensive, sensitive to climate, disease/pests, and processing post-harvest is critical to flavour quality. These issues create both risk and opportunity.
The success of vanilla beans, driven by clean-label demand, premium flavor positioning, and ESG-linked sourcing, will not only elevate value creation for producing regions but also strengthen resilience in global flavor supply chains. It will consolidate emerging markets such as Madagascar, Uganda, and Indonesia as key vanilla producers while aligning advanced economies with transparent, sustainable, and ethical ingredient sourcing. This calls for a concerted effort by all stakeholders: governments, industry bodies, suppliers, OEMs, and investors. Each can be a crucial enabler in preparing the market for its next phase of growth.
Market expansion is being supported by the increasing global demand for natural and authentic flavoring ingredients and the corresponding shift away from synthetic alternatives that can provide similar taste profiles while meeting consumer preferences for clean-label products. Modern food and beverage manufacturers are increasingly focused on incorporating natural vanilla to enhance product premium positioning while satisfying consumer demands for recognizable ingredients and authentic flavor experiences. Vanilla's proven ability to deliver superior taste enhancement, aromatic complexity, and consumer appeal makes it an essential ingredient for premium food product development and culinary applications.
The growing emphasis on artisanal and craft food production is driving demand for high-quality vanilla products that can support distinctive flavor profiles and premium product positioning across bakery, confectionery, and specialty food categories. Manufacturer preference for ingredients that combine flavor excellence with natural origin credentials is creating opportunities for innovative vanilla implementations in both traditional and emerging food applications. The rising influence of gourmet cooking trends and culinary sophistication is also contributing to increased adoption of premium vanilla products that can provide authentic Madagascar and other origin-specific flavor characteristics.
The market is segmented by form, distribution channel, and region. By form, the market is divided into extract and whole vanilla beans. Based on distribution channel, the market is categorized into supermarket/hypermarket, wholesaler, direct sales, online retailer, and specialty stores. Regionally, the market is divided into North America, Europe, East Asia, South Asia & Pacific, Latin America, and the Middle East & Africa.
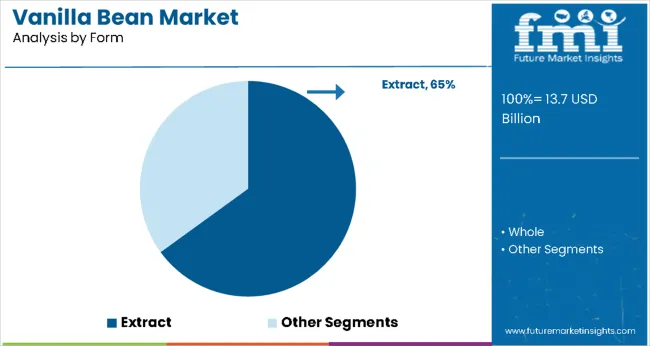
The extract segment is projected to account for 65.0% of the vanilla bean market in 2025, reaffirming its position as the leading form category. Food manufacturers and commercial bakers increasingly utilize vanilla extract for its convenience, consistent flavor delivery, and ease of incorporation in large-scale production processes across diverse food applications. Extract form technology's standardized concentration and liquid format directly address the industrial requirements for uniform flavor distribution and efficient processing in commercial food manufacturing operations.
This form segment forms the foundation of modern vanilla applications, as it represents the format with the greatest versatility and established manufacturing compatibility across multiple food production systems. Manufacturer investments in extraction optimization and quality standardization continue to strengthen adoption among commercial food producers. With food companies prioritizing operational efficiency and consistent flavor profiles, vanilla extract aligns with both production convenience objectives and quality assurance requirements, making it the central component of comprehensive vanilla flavoring strategies.
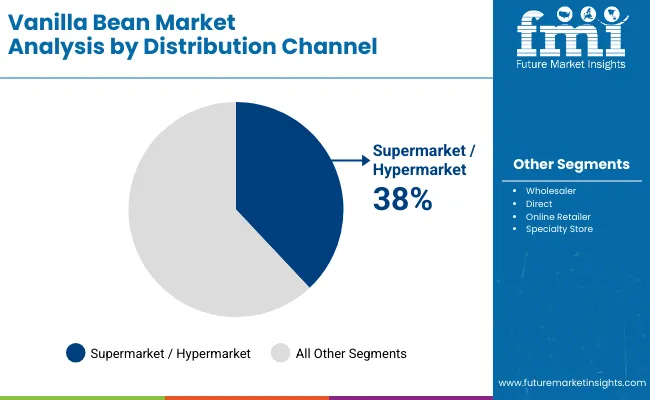
Supermarket/hypermarket distribution channels are projected to represent 38.0% of vanilla bean demand in 2025, underscoring their critical role as the primary retail avenue for consumer vanilla purchases. Retail outlets prefer vanilla products for their strong consumer demand, premium pricing potential, and ability to support both everyday cooking and specialty culinary applications while offering attractive profit margins. Positioned as essential ingredients for home cooking and baking, vanilla products offer both consumer appeal and retail profitability advantages.
The segment is supported by continuous growth in home cooking trends and the growing availability of premium vanilla varieties that enable product differentiation and consumer education at the retail level. Additionally, supermarkets are investing in specialty food sections to support premium vanilla product positioning and consumer accessibility. As cooking at home continues to gain popularity and consumers seek quality ingredients, supermarket/hypermarket channels will continue to dominate the distribution landscape while supporting brand visibility and consumer education strategies.
The vanilla bean market is advancing steadily due to increasing consumer preference for natural flavoring ingredients and growing demand for premium culinary experiences that emphasize authentic taste profiles across food and beverage applications. However, the market faces challenges, including supply chain vulnerabilities due to geographic concentration of production, price volatility from weather-related crop variations, and competition from synthetic vanilla alternatives. Innovation in sustainable farming practices and supply chain diversification continues to influence market development and expansion patterns.
Expansion of Premium and Artisanal Applications
The growing adoption of vanilla in craft food production and artisanal applications is enabling food manufacturers to develop products that provide distinctive flavor experiences while commanding premium pricing and enhanced brand positioning. Premium applications provide superior taste differentiation while allowing more sophisticated product development across various culinary categories and consumer segments. Manufacturers are increasingly recognizing the competitive advantages of authentic vanilla positioning for luxury product development and gourmet market penetration.
Integration of Sustainable Sourcing Programs
Modern vanilla suppliers are incorporating sustainable farming support, fair trade certification, and traceability systems to enhance supply chain stability, improve farmer livelihoods, and meet consumer demands for ethical sourcing practices. These programs improve supply security while enabling new applications, including certified organic and fair trade vanilla products. Advanced sustainability integration also allows suppliers to support premium market positioning and consumer trust building beyond traditional commodity vanilla sourcing.
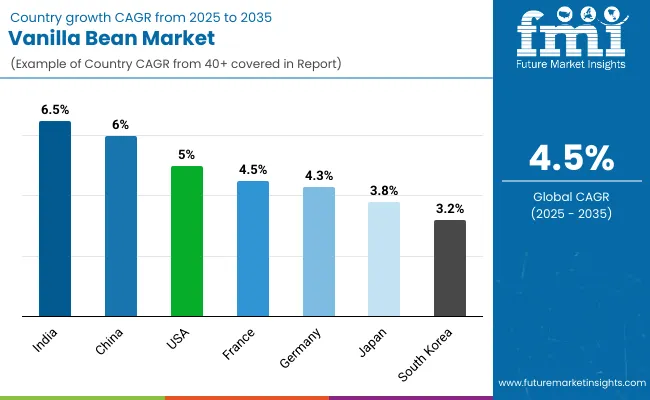
| Country | CAGR (2025 to 2035) |
|---|---|
| India | 6.5% |
| China | 6.0% |
| USA | 5.0% |
| France | 4.5% |
| Germany | 4.3% |
| Japan | 3.8% |
| South Korea | 3.2% |
The vanilla bean market is experiencing robust growth globally, with India leading at a 6.5% CAGR through 2035, driven by the expanding food processing industry, growing consumer preference for natural ingredients, and increasing adoption of Western-style desserts and baked goods. China follows at 6.0%, supported by rapid urbanization, rising disposable incomes, and growing demand for premium food products. The USA shows growth at 5.0%, emphasizing artisanal food trends and premium culinary applications. France records 4.5%, focusing on patisserie excellence and gourmet food manufacturing. Germany demonstrates 4.3% growth, prioritizing premium food processing and export market development. Japan exhibits 3.8% growth, supported by sophisticated culinary culture and premium ingredient appreciation. South Korea shows 3.2% growth, emphasizing production capacity expansion and quality enhancement.
The report covers an in-depth analysis of 40+ countries; seven top-performing countries are highlighted below.
Revenue from vanilla beans in India is projected to exhibit exceptional growth with a CAGR of 6.5% through 2035, driven by the rapidly expanding food processing industry and increasing consumer adoption of Western-style desserts, ice cream, and baked goods across urban markets. The country's growing middle-class population and changing dietary preferences are creating substantial demand for natural flavoring ingredients in both traditional and modern food applications. Major food manufacturers and flavor companies are establishing comprehensive sourcing and processing capabilities to serve both domestic consumption and export markets.
Revenue from vanilla beans in China is expanding at a CAGR of 6.0%, supported by rapid urbanization, increasing disposable incomes, and growing consumer exposure to international cuisine and premium food products. The country's developing food service industry and expanding retail infrastructure are driving demand for quality vanilla products across both commercial and consumer applications. International flavor companies and domestic food manufacturers are establishing comprehensive distribution and processing capabilities to address growing market demand for authentic vanilla flavoring.
Revenue from vanilla beans in the United States is projected to grow at a CAGR of 5.0% through 2035, driven by the country's thriving artisanal food movement, premium bakery sector expansion, and consumer preference for natural and authentic ingredients. The USA's sophisticated culinary culture and willingness to pay premium prices for high-quality vanilla products are creating substantial demand for both Madagascar and other origin-specific vanilla varieties. Leading food manufacturers and specialty suppliers are establishing comprehensive sourcing strategies to serve both commercial food production and growing home cooking markets.
Revenue from vanilla beans in France is projected to grow at a CAGR of 4.5% through 2035, supported by the country's renowned patisserie industry, premium chocolate manufacturing sector, and established tradition of culinary excellence requiring high-quality natural ingredients. French food manufacturers and artisanal producers consistently demand superior vanilla products that meet exacting quality standards for both domestic consumption and export markets. The country's position as a global culinary authority continues to drive innovation in vanilla applications and quality standards.
Revenue from vanilla beans in Germany is projected to grow at a CAGR of 4.3% through 2035, supported by the country's advanced food processing industry, strong export capabilities, and consumer preference for natural and organic food ingredients. German food manufacturers prioritize quality, consistency, and regulatory compliance, making vanilla an essential ingredient for both domestic production and export-oriented food manufacturing. The country's comprehensive food safety standards and technical expertise support continued vanilla market development.
Revenue from vanilla beans in Japan is projected to grow at a CAGR of 3.8% through 2035, supported by the country's sophisticated culinary culture, appreciation for premium ingredients, and established confectionery industry requiring high-quality natural flavoring agents. Japanese consumers' willingness to pay premium prices for authentic and superior products creates steady demand for Madagascar vanilla and other premium origins. The country's attention to ingredient quality and presentation drives consistent vanilla adoption across both traditional and Western-style applications.
Revenue from vanilla beans in South Korea is projected to grow at a CAGR of 3.2% through 2035, supported by the country's position as one of the world's leading vanilla producer and ongoing efforts to enhance quality standards, improve processing capabilities, and develop value-added products. The country’s vanilla industry continues to benefit from its reputation for producing the world's finest vanilla while working to address supply chain challenges and improve farmer incomes through sustainable practices.
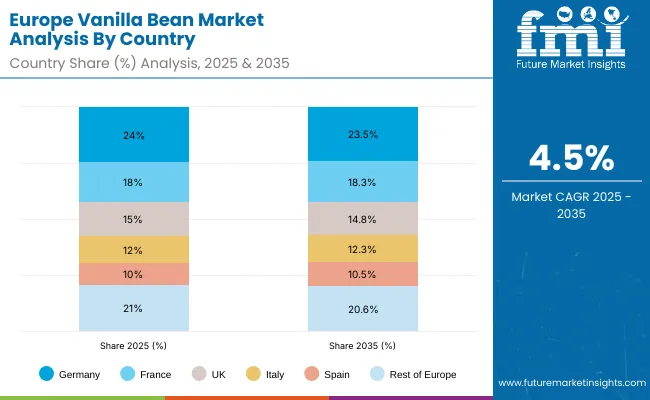
The vanilla bean market in Europe is projected to grow from USD 3.0 billion in 2025 to USD 4.7 billion by 2035, registering a CAGR of 4.5% over the forecast period. Germany is expected to maintain its leadership position with a 24.0% market share in 2025, declining slightly to 23.5% by 2035, supported by its strong food processing sector, premium dessert manufacturing industry, and comprehensive export capabilities serving European and international markets.
France follows with an 18.0% share in 2025, projected to reach 18.3% by 2035, driven by high patisserie and chocolate manufacturing demand, established culinary excellence traditions, and growing export of premium vanilla-containing products. The United Kingdom holds a 15.0% share in 2025, expected to decrease to 14.8% by 2035, supported by strong retail demand and home baking trends but facing challenges from market maturation and economic uncertainties. Italy commands a 12.0% share in 2025, projected to reach 12.3% by 2035, while Spain accounts for 10.0% in 2025, expected to reach 10.5% by 2035. The Netherlands maintains a 4.0% share in 2025, growing to 4.2% by 2035. The Rest of Europe region, including Nordic countries, Eastern Europe, Portugal, Belgium, Switzerland, and Austria, is anticipated to hold 21.0% in 2025, declining to 20.6% by 2035, attributed to mixed growth patterns with faster expansion in some Eastern European markets balanced by slower growth in smaller Western European countries implementing premium food development programs.
The vanilla bean market is characterized by competition among established flavor and fragrance companies, specialized vanilla processors, and integrated food ingredient suppliers. Companies are investing in sustainable sourcing programs, quality enhancement technologies, supply chain diversification, and comprehensive traceability systems to deliver consistent, high-quality, and ethically sourced vanilla products. Innovation in extraction methods, organic certification, and origin-specific product development is central to strengthening market position and consumer trust.
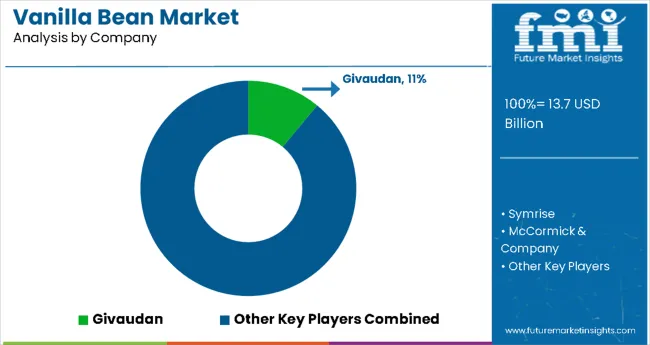
Givaudan leads the market with a strong focus on flavor innovation and sustainable sourcing, offering comprehensive vanilla solutions with emphasis on quality assurance and supply chain transparency. Symrise provides integrated flavor and fragrance capabilities with focus on natural ingredient development and global distribution networks. McCormick & Company delivers consumer and industrial vanilla products with a focus on brand recognition and retail market penetration. Nielsen-Massey Vanillas specializes in premium vanilla products with emphasis on artisanal quality and gourmet applications. Takasago International focuses on flavor technology and Asian market development. Synthite Industries emphasizes natural extract production with a focus on sustainable sourcing and quality standardization.
| Items | Values |
|---|---|
| Quantitative Units (2025) | USD 13.7 Billion |
| Form | Extract, Whole Beans |
| Distribution Channel | Supermarket/Hypermarket, Wholesaler, Direct Sales, Online Retailer, Specialty Stores |
| Regions Covered | North America, Europe, East Asia, South Asia & Pacific, Latin America, Middle East & Africa |
| Countries Covered | United States, Canada, United Kingdom, Germany, France, China, Japan, South Korea, India, Brazil, Australia and 40+ countries |
| Key Companies Profiled | Givaudan, Symrise, McCormick & Company, Nielsen-Massey Vanillas, Takasago International, Synthite Industries, Eurovanille S.A., Daintree Vanilla, Venui Vanilla, and Apex Flavors |
| Additional Attributes | Dollar sales by form and distribution channel, regional demand trends, competitive landscape, technological advancements in extraction methods, sustainable sourcing initiatives, quality standardization programs, and supply chain diversification strategies |
The global vanilla bean market is projected to reach USD 21.2 billion by 2035, growing from USD 13.7 billion in 2025, at a CAGR of 4.5%.
The Madagascar vanilla segment occupies the largest share at 21% in 2025.
The rise in consumer preference for natural ingredients, organic products, and health-conscious choices is driving demand for vanilla beans.
North America is expected to dominate the global vanilla bean market consumption.
Key players include Tharkan and Company, Daintree Vanilla and Company, and Nielsen-Massey Vanillas Inc.


Full Research Suite comprises of:
Market outlook & trends analysis
Interviews & case studies
Strategic recommendations
Vendor profiles & capabilities analysis
5-year forecasts
8 regions and 60+ country-level data splits
Market segment data splits
12 months of continuous data updates
DELIVERED AS:
PDF EXCEL ONLINE
Korea Vanilla Bean Market Analysis byDistribution Channel, Form, Nature, Product Variety, and Region Through 2025 to 2035
Demand for Vanilla Bean in EU Size and Share Forecast Outlook 2025 to 2035
Western Europe Vanilla Bean Market Analysis by Distribution Channel, Form, Nature, Product Variety, and Country Through 2035
Vanilla Bean Industry Analysis in Japan Size and Share Forecast Outlook 2025 to 2035
Vanilla Extract Market Size and Share Forecast Outlook 2025 to 2035
Vanilla Salt Market Insights - Sweet & Savory Fusion Trends 2025 to 2035
Bean Flour Market Size and Share Forecast Outlook 2025 to 2035
Bean Ingredients Market Size and Share Forecast Outlook 2025 to 2035
Market Share Breakdown of Bean Flour Manufacturers
Soybean Enzymatic Protein Market Size and Share Forecast Outlook 2025 to 2035
Soybean Derivatives Market Size and Share Forecast Outlook 2025 to 2035
Soybean Meal Market Analysis - Size, Share, and Forecast Outlook 2025 to 2035
Soybean Oil Market
Caribbean Cruises Market Size and Share Forecast Outlook 2025 to 2035
Fava Bean Protein Market Size and Share Forecast Outlook 2025 to 2035
Fava Bean Protein Industry in United States Analysis - Size, Share, and Forecast Outlook 2025 to 2035
Caribbean Destination Wedding Market Trends - Growth & Forecast 2025 to 2035
Fava Beans Market Report – Size, Share & Growth 2025-2035
Cocoa Bean Derivatives Market Size and Share Forecast Outlook 2025 to 2035
Cacao Beans Market Analysis - Size, Share, and Forecast Outlook 2025 to 2035

Thank you!
You will receive an email from our Business Development Manager. Please be sure to check your SPAM/JUNK folder too.
Chat With
MaRIA